You are not logged in.
This means you
CAN ONLY VIEW reports that were published prior to Tuesday, April 8, 2025.
You
MUST UPGRADE YOUR MEMBERSHIP if you want to see any current reports.
AFTER MARKET UPDATE - WEDNESDAY, NOVEMBER 9TH, 2022
Previous After Market Report Next After Market Report >>>
|
|
|
|
DOW |
-646.89 |
32,513.94 |
-1.95% |
|
Volume |
946,059,881 |
+0% |
|
Volume |
4,960,401,500 |
-2% |
|
NASDAQ |
-263.03 |
10,353.18 |
-2.48% |
|
Advancers |
557 |
18% |
|
Advancers |
1,151 |
25% |
|
S&P 500 |
-79.54 |
3,748.57 |
-2.08% |
|
Decliners |
2,473 |
82% |
|
Decliners |
3,457 |
75% |
|
Russell 2000 |
-48.53 |
1,760.40 |
-2.68% |
|
52 Wk Highs |
37 |
|
|
52 Wk Highs |
85 |
|
|
S&P 600 |
-27.13 |
1,157.13 |
-2.29% |
|
52 Wk Lows |
167 |
|
|
52 Wk Lows |
513 |
|
|
 |
Breadth Clearly Negative as Major Indices Fell
Kenneth J. Gruneisen - Passed the CAN SLIM® Master's Exam
The Dow lost 646 points, while the Nasdaq Composite decreased 2.5%. The S&P 500 declined 2%. The volume totals reported were near the prior session total on the NYSE and lighter on the Nasdaq exchange. Breadth was negative as decliners led advancers by more than a 4-1 margin on the NYSE and by a 3-1 margin on the Nasdaq exchange. There were 22 high-ranked companies from the Leaders List that hit new 52-week highs and were listed on the BreakOuts Page, versus the total of 63 on the prior session. New 52-week lows totals again expanded and solidly outnumbered shrinking new 52-week highs on the NYSE and on the Nasdaq exchange. The market is in a confirmed uptrend that recently has come under pressure (M criteria). Healthy leadership (new 52-week highs totals) must continue for the rally to be productive. Only stocks meeting all key-criteria of the fact-based investment system should be considered as buy candidates.
Chart courtesy of www.stockcharts.com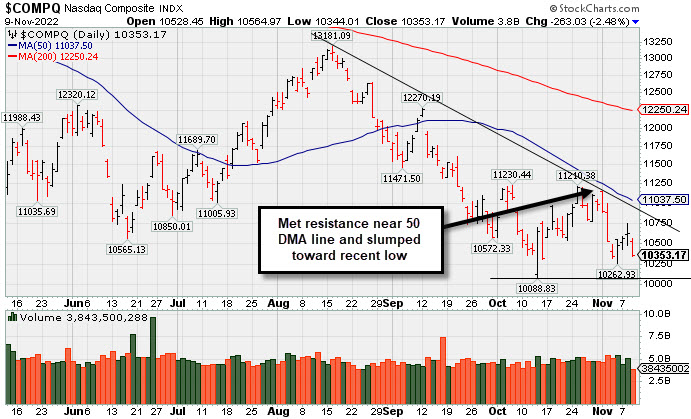 PICTURED: The Nasdaq Composite Index met resistance near its 50-day moving average (DMA) line and has slumped toward the recent low.
U.S. equities broke their three-day rally Wednesday as stocks declined following the rise of uncertainty in the midterm elections. Analysts are forecasting Republicans to win control of the Senate and House of Representatives to block any future tax and spending plans put into place by the Biden administration. All 11 sectors in the S&P 500 closed in negative territory Wednesday, with Energy leading laggards.
On the data front, MBA mortgage applications fell 0.1% in the week ending November 4 as rising mortgage rates weigh on demand. Meanwhile, a final update on wholesale inventories was revised downwards from 0.8% to 0.6% in September. In stock news, Tesla, Inc (TSLA -7.17%) fell Wednesday, hitting a two-year low, after Chief Executive Officer (CEO) Elon Musk announced he sold approximately $4 billion worth of stock. The Walt Disney Company (DIS -13.16%) fell after the company missed analyst earnings and revenue projections. CEO Christine McCarthy expects the next fiscal year to produce a revenue growth less than 10%.
Treasuries strengthened, with the yield on the benchmark 10-year note down five basis points (0.05%) to 4.09%, while the 30-year bond yield slipped two basis points (0.02%) to 4.26%. The yield on the more policy-sensitive two-year note decreased by eight basis points (0.08%) to 4.59%. In commodities, West Texas Intermediate (WTI) crude decreased 3.8% to $85.52/barrel following the Department of Energy’s data release showing a greater-than-expected increase in U.S. crude inventories. The U.S. Dollar Index advanced 0.7% against several major currencies Wednesday as the Senate and House of Representatives races tighten.
|
 Kenneth J. Gruneisen started out as a licensed stockbroker in August 1987, a couple of months prior to the historic stock market crash that took the Dow Jones Industrial Average down -22.6% in a single day. He has published daily fact-based fundamental and technical analysis on high-ranked stocks online for two decades. Through FACTBASEDINVESTING.COM, Kenneth provides educational articles, news, market commentary, and other information regarding proven investment systems that work in good times and bad.
Comments contained in the body of this report are technical opinions only and are not necessarily those of Gruneisen Growth Corp. The material herein has been obtained from sources believed to be reliable and accurate, however, its accuracy and completeness cannot be guaranteed. Our firm, employees, and customers may effect transactions, including transactions contrary to any recommendation herein, or have positions in the securities mentioned herein or options with respect thereto. Any recommendation contained in this report may not be suitable for all investors and it is not to be deemed an offer or solicitation on our part with respect to the purchase or sale of any securities. |
|
 |
Retail, Financial, Tech, and Commodity-Linked Groups Suffered Losses
Kenneth J. Gruneisen - Passed the CAN SLIM® Master's Exam
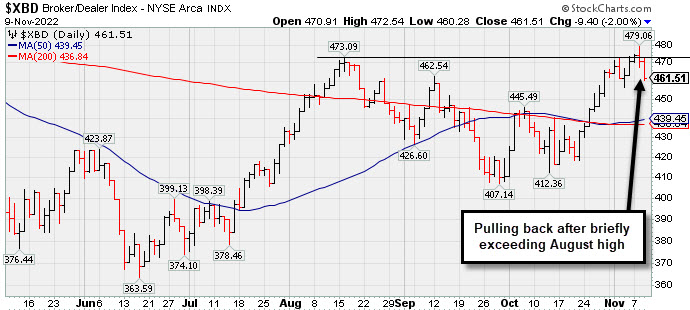
The Retail Index ($RLX -3.05%), Broker/Dealer Index ($XBD -2.00%), and Bank Index ($BKX -2.20%) all lost ground and created a drag on the major averages. The Networking Index ($NWX -4.68%) and Semiconductor Index ($SOX -3.14%) led the tech sector lower while the Biotech Index ($BTK -0.26%) ended just slightly in the red. The Oil Services Index ($OSX -5.64%) and Integrated Oil Index ($XOI -4.40%) both suffered large losses and the Gold & Silver Index ($XAU -2.84%) also slumped.
PICTURED: The Broker/Dealer Index ($XBD -2.00%) has pulled back after recently trading above its August high.
| Oil Services |
$OSX |
82.52 |
-4.93 |
-5.64% |
+56.52% |
| Integrated Oil |
$XOI |
1,826.32 |
-84.02 |
-4.40% |
+55.01% |
| Semiconductor |
$SOX |
2,424.82 |
-78.57 |
-3.14% |
-38.55% |
| Networking |
$NWX |
753.15 |
-37.00 |
-4.68% |
-22.44% |
| Broker/Dealer |
$XBD |
461.51 |
-9.40 |
-2.00% |
-5.21% |
| Retail |
$RLX |
2,680.42 |
-84.36 |
-3.05% |
-36.58% |
| Gold & Silver |
$XAU |
108.96 |
-3.18 |
-2.84% |
-17.74% |
| Bank |
$BKX |
102.92 |
-2.31 |
-2.20% |
-22.16% |
| Biotech |
$BTK |
5,002.66 |
-12.89 |
-0.26% |
-9.35% |
|
|
|
 |
Featured Stocks
Kenneth J. Gruneisen - Passed the CAN SLIM® Master's Exam
|
|
|
Color Codes Explained :
Y - Better candidates highlighted by our
staff of experts.
G - Previously featured
in past reports as yellow but may no longer be buyable under the
guidelines.
***Last / Change / Volume data in this table is the closing quote data***
Symbol/Exchange
Company Name
Industry Group |
PRICE |
CHANGE
(%Change) |
Day High |
Volume
(% DAV)
(% 50 day avg vol) |
52 Wk Hi
% From Hi |
Featured
Date |
Price
Featured |
Pivot Featured |
|
Max Buy |
 CI
-
NYSE
CI
-
NYSE
Cigna Corp
Medical-Managed Care
|
$324.99
|
-2.75
-0.84% |
$331.05
|
1,277,922
63.86% of 50 DAV
50 DAV is 2,001,000
|
$329.39
-1.34%
|
7/7/2022
|
$276.55
|
PP = $273.68
|
|
MB = $287.36
|
Most Recent Note - 11/8/2022 5:27:05 PM
G - Posted a gain with lighter volume as it hit yet another new all-time high. Reported Sep '22 quarterly earnings +5% after the close. Its 50 DMA line ($295.88) defines near-term support to watch.
>>> FEATURED STOCK ARTICLE : Cigna Reported Earnings Perched at High - 11/3/2022 |
View all notes |
Set NEW NOTE alert |
Company Profile |
SEC
News |
Chart |
Request a new note
C
A
S
I |
ESQ
-
NASDAQ
Esquire Financial Hldgs
Finance-Commercial Loans
|
$42.95
|
-1.29
-2.92% |
$44.33
|
27,476
98.13% of 50 DAV
50 DAV is 28,000
|
$45.49
-5.58%
|
10/18/2022
|
$40.02
|
PP = $39.95
|
|
MB = $41.95
|
 Most Recent Note - 11/9/2022 6:09:45 PM
G - Pulled back for a 3rd consecutive loss today with near average volume, retreating from its 52-week high. Prior highs in the $41 area define initial support to watch above its 50 DMA line ($36.30).
>>> FEATURED STOCK ARTICLE : New High With 6th Consecutive Volume-Driven Gain - 10/31/2022 |
View all notes |
Set NEW NOTE alert |
Company Profile |
SEC
News |
Chart |
Request a new note
C
A
S
I |
CCRN
-
NASDAQ
Cross Country Healthcare
DIVERSIFIED SERVICES - Staffing and Outsourcing Service
|
$33.24
|
-0.74
-2.18% |
$35.05
|
625,920
68.41% of 50 DAV
50 DAV is 915,000
|
$38.68
-14.06%
|
9/9/2022
|
$27.32
|
PP = $30.61
|
|
MB = $32.14
|
Most Recent Note - 11/8/2022 5:24:46 PM
G - Posted has 2 gains with lighter volume after halting its slide. A damaging volume-driven loss on 11/04/22 briefly undercut its "max buy" level. Reported Sep '22 quarterly earnings +75% on +70% sales revenues versus the year ago period. Its 50 DMA line ($31.10) and prior highs in the $30.50 area define important near-term support to watch. See the latest FSU analysis for more details and a new annotated graph.
>>> FEATURED STOCK ARTICLE : Consolidating Above Prior Highs and Above 50-Day Moving Average - 11/8/2022 |
View all notes |
Set NEW NOTE alert |
Company Profile |
SEC
News |
Chart |
Request a new note
C
A
S
I |
CMC
-
NYSE
Commercial Metals Co
METALS and MINING - Steel and Iron
|
$45.46
|
-1.45
-3.09% |
$46.96
|
712,735
67.69% of 50 DAV
50 DAV is 1,053,000
|
$47.28
-3.84%
|
10/14/2022
|
$41.61
|
PP = $44.45
|
|
MB = $46.67
|
Most Recent Note - 11/9/2022 6:05:20 PM
Y - Pulled back today with lighter than average volume after hitting a new 52-week high on the prior session while recently wedging higher. Fundamentals remain strong.
>>> FEATURED STOCK ARTICLE : Steel/Metal Products Firm Quietly Perched Near All Time High - 11/7/2022 |
View all notes |
Set NEW NOTE alert |
Company Profile |
SEC
News |
Chart |
Request a new note
C
A
S
I |
VRTX
-
NASDAQ
Vertex Pharmaceuticals
Medical-Biomed/Biotech
|
$309.34
|
+2.84
0.93% |
$312.15
|
1,321,402
92.80% of 50 DAV
50 DAV is 1,424,000
|
$316.48
-2.26%
|
10/24/2022
|
$308.47
|
PP = $306.05
|
|
MB = $321.35
|
Most Recent Note - 11/7/2022 5:22:52 PM
Y - Pulled back today with near average volume. Its 50 DMA line ($293.81) defines near-term support . Recently reported Sep '22 quarterly earnings +14% on +18% sales revenues versus the year ago period, below the +25% minimum earnings guideline raising concerns (C criteria). Annual earnings (A criteria) history has been strong.
>>> FEATURED STOCK ARTICLE : Volume-Driven Gain Triggered Technical Buy Signal - 10/24/2022 |
View all notes |
Set NEW NOTE alert |
Company Profile |
SEC
News |
Chart |
Request a new note
C
A
S
I |
Symbol/Exchange
Company Name
Industry Group |
PRICE |
CHANGE
(%Change) |
Day High |
Volume
(% DAV)
(% 50 day avg vol) |
52 Wk Hi
% From Hi |
Featured
Date |
Price
Featured |
Pivot Featured |
|
Max Buy |
GPK
-
NYSE
Graphic Packaging Hldg
CONSUMER NON-DURABLES - Packaging and Containers
|
$22.57
|
-0.28
-1.23% |
$23.00
|
2,044,201
72.57% of 50 DAV
50 DAV is 2,817,000
|
$24.07
-6.23%
|
10/25/2022
|
$22.75
|
PP = $24.17
|
|
MB = $25.38
|
Most Recent Note - 11/8/2022 5:34:47 PM
Y - Volume totals have been cooling while consolidating well above its 50 DMA line ($21.65). Subsequent gains above the pivot point backed by at least +40% above average volume may trigger a technical buy signal. Reported Sep '22 quarterly earnings +79% on +38% sales revenues versus the year ago period.
>>> FEATURED STOCK ARTICLE : Rebound Above 50-Day Moving Average Helped Outlook Improve - 10/25/2022 |
View all notes |
Set NEW NOTE alert |
Company Profile |
SEC
News |
Chart |
Request a new note
C
A
S
I |
CBZ
-
NYSE
C B I Z Inc
Comml Svcs-Consulting
|
$47.18
|
-0.13
-0.27% |
$47.79
|
226,304
84.13% of 50 DAV
50 DAV is 269,000
|
$50.57
-6.70%
|
10/26/2022
|
$47.83
|
PP = $48.57
|
|
MB = $51.00
|
Most Recent Note - 11/9/2022 6:08:39 PM
Y - Pulled back today with below average volume. Recent losses undercutting the prior high in the $48 area raised some concerns. Its 50 DMA line ($45.20) defines the next important support. Recently reported Sep '22 quarterly earnings +24% on +28% sales revenues versus the year ago period. Volume and volatility often increase near earnings news.
>>> FEATURED STOCK ARTICLE : Earnings Report Due for Commercial Services and Consulting Firm - 10/26/2022 |
View all notes |
Set NEW NOTE alert |
Company Profile |
SEC
News |
Chart |
Request a new note
C
A
S
I |
ENPH
-
NASDAQ
Enphase Energy Inc
Energy-Solar
|
$284.75
|
+4.68
1.67% |
$295.90
|
3,322,490
82.59% of 50 DAV
50 DAV is 4,023,000
|
$324.84
-12.34%
|
10/26/2022
|
$301.55
|
PP = $324.94
|
|
MB = $341.19
|
Most Recent Note - 11/8/2022 5:36:48 PM
G - Posted a big gain today with lighter volume. A rebound above the 50 DMA line ($282) is needed for its outlook to improve. Faces near-term resistance due to overhead supply up to the $324 level. Fundamentals remain strong.
>>> FEATURED STOCK ARTICLE : Enphase Energy Rebound Above 50-Day Moving Average Helped Outlook - 10/28/2022 |
View all notes |
Set NEW NOTE alert |
Company Profile |
SEC
News |
Chart |
Request a new note
C
A
S
I |
HRMY
-
NASDAQ
Harmony Biosciences Hldg
Medical-Biomed/Biotech
|
$57.08
|
-1.57
-2.68% |
$59.35
|
377,956
73.11% of 50 DAV
50 DAV is 517,000
|
$60.41
-5.51%
|
11/1/2022
|
$55.31
|
PP = $57.23
|
|
MB = $60.09
|
Most Recent Note - 11/8/2022 12:37:29 PM
Y - Posting a solid gain today after briefly undercutting is pivot point on the prior session. Prior highs in the $57 area define initial support to watch.
>>> FEATURED STOCK ARTICLE : Volume Heavy Behind Technical Breakout After Earnings - 11/1/2022 |
View all notes |
Set NEW NOTE alert |
Company Profile |
SEC
News |
Chart |
Request a new note
C
A
S
I |
CLH
-
NYSE
Clean Harbors Inc
Pollution Control
|
$112.29
|
-2.43
-2.12% |
$114.99
|
368,070
83.84% of 50 DAV
50 DAV is 439,000
|
$124.49
-9.80%
|
11/2/2022
|
$121.59
|
PP = $124.59
|
|
MB = $130.82
|
Most Recent Note - 11/8/2022 5:33:00 PM
G - Posted a solid gain today with near average volume. Following damaging volume-driven losses a rebound above the 50 DMA line ($116.42) is needed for its outlook to improve. Fundamentals remain strong after reporting Sep '22 quarterly earnings +113% on +43% sales revenues versus the year ago period.
>>> FEATURED STOCK ARTICLE : Testing 50 Day Moving Average Line After Forming New Base - 11/2/2022 |
View all notes |
Set NEW NOTE alert |
Company Profile |
SEC
News |
Chart |
Request a new note
C
A
S
I |
Symbol/Exchange
Company Name
Industry Group |
PRICE |
CHANGE
(%Change) |
Day High |
Volume
(% DAV)
(% 50 day avg vol) |
52 Wk Hi
% From Hi |
Featured
Date |
Price
Featured |
Pivot Featured |
|
Max Buy |
NPO
-
NYSE
Enpro Industries Inc
Machinery-Gen Industrial
|
$117.34
|
-2.78
-2.31% |
$120.03
|
76,992
81.91% of 50 DAV
50 DAV is 94,000
|
$122.35
-4.09%
|
11/4/2022
|
$119.06
|
PP = $117.73
|
|
MB = $123.62
|
Most Recent Note - 11/9/2022 6:07:18 PM
Y - Pulled back today for a 2nd loss with below average volume. Faces no resistance due to overhead supply. Rallied into new 52-week high territory last week with impressive volume-driven gains after a 9-month consolidation. Reported Sep '22 quarterly earnings +65% on +34% sales revenues versus the year ago period, its 3rd strong quarterly comparison above the +25% minimum earnings guideline (C criteria), helping it better match the winning models of the fact-based investment system. Annual earnings growth has been steady even through the pandemic.
>>> FEATURED STOCK ARTICLE : Finished Strong After Highlighted in Friday Mid-Day Report - 11/4/2022 |
View all notes |
Set NEW NOTE alert |
Company Profile |
SEC
News |
Chart |
Request a new note
C
A
S
I |
|
|
|
THESE ARE NOT BUY RECOMMENDATIONS!
Comments contained in the body of this report are technical
opinions only. The material herein has been obtained
from sources believed to be reliable and accurate, however,
its accuracy and completeness cannot be guaranteed.
This site is not an investment advisor, hence it does
not endorse or recommend any securities or other investments.
Any recommendation contained in this report may not
be suitable for all investors and it is not to be deemed
an offer or solicitation on our part with respect to
the purchase or sale of any securities. All trademarks,
service marks and trade names appearing in this report
are the property of their respective owners, and are
likewise used for identification purposes only.
This report is a service available
only to active Paid Premium Members.
You may opt-out of receiving report notifications
at any time. Questions or comments may be submitted
by writing to Premium Membership Services 665 S.E. 10 Street, Suite 201 Deerfield Beach, FL 33441-5634 or by calling 1-800-965-8307
or 954-785-1121.
|
|
|