You are not logged in.
This means you
CAN ONLY VIEW reports that were published prior to Tuesday, April 8, 2025.
You
MUST UPGRADE YOUR MEMBERSHIP if you want to see any current reports.
AFTER MARKET UPDATE - TUESDAY, NOVEMBER 8TH, 2022
Previous After Market Report Next After Market Report >>>
|
|
|
|
DOW |
+333.83 |
33,160.83 |
+1.02% |
|
Volume |
944,848,786 |
+3% |
|
Volume |
5,072,853,200 |
+15% |
|
NASDAQ |
+51.68 |
10,616.20 |
+0.49% |
|
Advancers |
1,834 |
60% |
|
Advancers |
2,357 |
52% |
|
S&P 500 |
+21.31 |
3,828.11 |
+0.56% |
|
Decliners |
1,197 |
39% |
|
Decliners |
2,192 |
48% |
|
Russell 2000 |
-0.88 |
1,808.93 |
-0.05% |
|
52 Wk Highs |
77 |
|
|
52 Wk Highs |
111 |
|
|
S&P 600 |
+1.43 |
1,184.26 |
+0.12% |
|
52 Wk Lows |
97 |
|
|
52 Wk Lows |
296 |
|
|
 |
Leadership Improved as Indices Rose With Higher Volume Totals
Kenneth J. Gruneisen - Passed the CAN SLIM® Master's Exam
The Dow added 333 points, while the Nasdaq Composite climbed 0.5%. The S&P 500 advanced 0.6%. The volume totals reported were higher than the prior session on the NYSE and on the Nasdaq exchange, indicative of an increase in institutional buying demand. Breadth was positive as advancers led decliners by a 3-2 margin on the NYSE and by about a narrower margin on the Nasdaq exchange. There were 63 high-ranked companies from the Leaders List that hit new 52-week highs and were listed on the BreakOuts Page, versus the total of 54 on the prior session. New 52-week lows totals again outnumbered new 52-week highs on the NYSE and on the Nasdaq exchange. The market is in a confirmed uptrend that recently has come under pressure (M criteria). Healthy leadership (new 52-week highs totals) has continued helping the rally to be productive. Only stocks meeting all key-criteria of the fact-based investment system should be considered as buy candidates.
Chart courtesy of www.stockcharts.com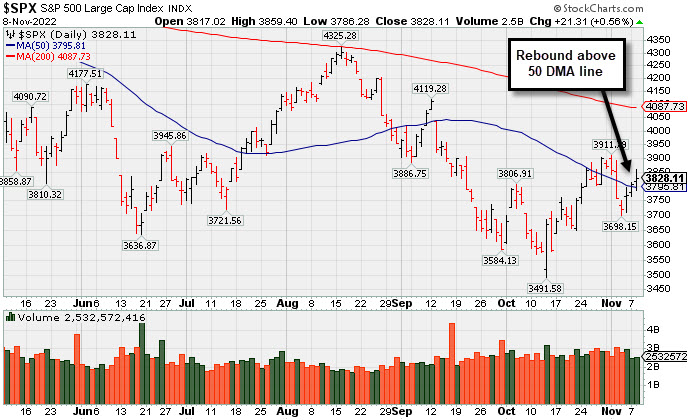 PICTURED: The S&P 500 Index has rebounded above its 50-day moving average (DMA) line with a 3rd consecutive gain.
U.S. equities finished in the green Tuesday for the third straight day as investors await the results of the 2022 midterm congressional elections. Nonpartisan analysts are projecting a divided government with Republicans taking control of the House of Representatives and potentially limiting the Biden administration's legislative plans. Ten of 11 sectors in the S&P 500 closed in positive territory Tuesday, with Materials the leading gains.
On the data front, the NFIB’s Small Business Optimism Index decreased 0.8 points in the month of October to 91.3, falling for the first time since June amid a darkening sales outlook and concerns over inflation. In earnings, Norwegian Cruise Line Holdings Ltd (NCLH +3.66%) ended higher after the company stated it expects 2023 to produce similar booking levels seen in 2019 but at a significantly higher price point. Kohl’s Corp (KSS +7.34%) rose following the announcement of Chief Executive Officer (CEO) Michelle Gass’ exit from the company.
Treasuries strengthened, with the yield on the benchmark 10-year note down eight basis points (0.08%) to 4.14%, while the 30-year bond yield slipped five basis points (0.05%) to 4.28%. The yield on the more policy-sensitive two-year note decreased by five basis points (0.05%) to 4.67%. In commodities, West Texas Intermediate (WTI) crude decreased 2.8% to $89.19/barrel as demand worries grew after reports showed COVID-19 outbreaks have worsened in China, the top crude importer. The U.S. Dollar Index slid 0.4% as the Euro strengthened amid rising German bond yields. |
 Kenneth J. Gruneisen started out as a licensed stockbroker in August 1987, a couple of months prior to the historic stock market crash that took the Dow Jones Industrial Average down -22.6% in a single day. He has published daily fact-based fundamental and technical analysis on high-ranked stocks online for two decades. Through FACTBASEDINVESTING.COM, Kenneth provides educational articles, news, market commentary, and other information regarding proven investment systems that work in good times and bad.
Comments contained in the body of this report are technical opinions only and are not necessarily those of Gruneisen Growth Corp. The material herein has been obtained from sources believed to be reliable and accurate, however, its accuracy and completeness cannot be guaranteed. Our firm, employees, and customers may effect transactions, including transactions contrary to any recommendation herein, or have positions in the securities mentioned herein or options with respect thereto. Any recommendation contained in this report may not be suitable for all investors and it is not to be deemed an offer or solicitation on our part with respect to the purchase or sale of any securities. |
|
 |
Gold & Silver, Semiconductor, and Biotech Indexes Led Gainers
Kenneth J. Gruneisen - Passed the CAN SLIM® Master's Exam
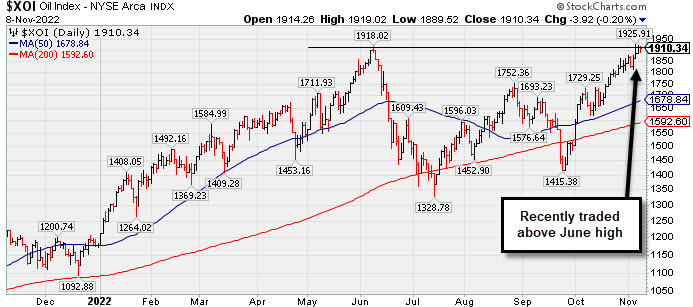
The tech sector had a positive bias as the Semiconductor Index ($SOX +2.15%) and Biotech Index ($BTK +1.06%) both outpaced the Networking Index ($NWX +0.49%). Financials were mixed as the Broker/Dealer Index ($XBD -0.64%) fell while the Bank Index ($BKX +0.56%) rose modestly. The Retail Index ($RLX -0.08%) finished flat. The Oil Services Index ($OSX +0.10%) and Integrated Oil Index ($XOI -0.20%) were mixed and little changed. The Gold & Silver Index ($XAU +5.16%) posted a standout gain.
PICTURED: The Integrated Oil Index ($XOI -0.20%) has recently traded above its June high.
| Oil Services |
$OSX |
87.45 |
+0.09 |
+0.10% |
+65.87% |
| Integrated Oil |
$XOI |
1,910.34 |
-3.92 |
-0.20% |
+62.14% |
| Semiconductor |
$SOX |
2,503.39 |
+52.76 |
+2.15% |
-36.56% |
| Networking |
$NWX |
790.15 |
+3.83 |
+0.49% |
-18.63% |
| Broker/Dealer |
$XBD |
470.93 |
-3.03 |
-0.64% |
-3.27% |
| Retail |
$RLX |
2,764.78 |
-2.31 |
-0.08% |
-34.58% |
| Gold & Silver |
$XAU |
112.14 |
+5.50 |
+5.16% |
-15.33% |
| Bank |
$BKX |
105.23 |
+0.59 |
+0.56% |
-20.41% |
| Biotech |
$BTK |
5,015.88 |
+52.70 |
+1.06% |
-9.11% |
|
|
|
 |
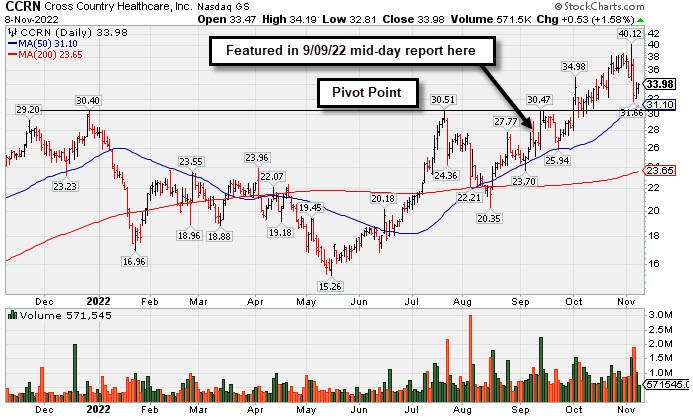
Consolidating Above Prior Highs and Above 50-Day Moving Average
Kenneth J. Gruneisen - Passed the CAN SLIM® Master's Exam
Cross Country Healthcare (CCRN +$0.53 or +1.58% to $33.98) has posted 2 gains with lighter volume after halting its slide since suffering a damaging volume-driven loss on Friday, 11/04/22, It briefly undercut its "max buy" level. Prior highs in the $30.50 area define important near-term support to watch along with its 50-day moving average (DMA) line ($31.10).
CCRN was highlighted yellow with pivot point cited based on its 7/21/22 high plus 10 cents in the 9/09/22 mid-day report (read here). It was last shown in greater detail on 10/03/22 with an annotated graph under the headline, "".
CCRN has a 99 Earnings Per Share Rating, the highest possible. It recently reported Sep '22 quarterly earnings +75% on +70% sales revenues versus the year ago period. Prior quarterly comparisons showed strong sales revenues and earnings increases. Annual earnings growth (A criteria) has been strong since a downturn in FY '17 and '18.
The company has only 38.2 million shares outstanding (S criteria), which can contribute to greater price volatility in the event of institutional buying or selling. The number of top-rated funds owning its shares rose from 326 in Sep '21 to 402 in Sep '22, a reassuring sign concerning the I criteria. Its current Up/Down Volume Ratio of 1.6 is an unbiased indication its shares have been under accumulation over the past 50 days. It has a Timeliness Rating of A and Sponsorship Rating of B.
|
|
|
Color Codes Explained :
Y - Better candidates highlighted by our
staff of experts.
G - Previously featured
in past reports as yellow but may no longer be buyable under the
guidelines.
***Last / Change / Volume data in this table is the closing quote data***
Symbol/Exchange
Company Name
Industry Group |
PRICE |
CHANGE
(%Change) |
Day High |
Volume
(% DAV)
(% 50 day avg vol) |
52 Wk Hi
% From Hi |
Featured
Date |
Price
Featured |
Pivot Featured |
|
Max Buy |
 CI
-
NYSE
CI
-
NYSE
Cigna Corp
Medical-Managed Care
|
$327.74
|
+3.37
1.04% |
$329.39
|
1,341,634
67.18% of 50 DAV
50 DAV is 1,997,000
|
$327.37
0.11%
|
7/7/2022
|
$276.55
|
PP = $273.68
|
|
MB = $287.36
|
 Most Recent Note - 11/8/2022 5:27:05 PM
G - Posted a gain with lighter volume as it hit yet another new all-time high. Reported Sep '22 quarterly earnings +5% after the close. Its 50 DMA line ($295.88) defines near-term support to watch.
>>> FEATURED STOCK ARTICLE : Cigna Reported Earnings Perched at High - 11/3/2022 |
View all notes |
Set NEW NOTE alert |
Company Profile |
SEC
News |
Chart |
Request a new note
C
A
S
I |
ESQ
-
NASDAQ
Esquire Financial Hldgs
Finance-Commercial Loans
|
$44.24
|
-1.22
-2.68% |
$45.49
|
32,496
116.06% of 50 DAV
50 DAV is 28,000
|
$47.11
-6.09%
|
10/18/2022
|
$40.02
|
PP = $39.95
|
|
MB = $41.95
|
Most Recent Note - 11/8/2022 5:42:23 PM
G - Pulled back for a 2nd consecutive loss today with near average volume, retreating from its 52-week high. It has been noted as extended from the previously noted base. Prior highs in the $41 area define initial support to watch above its 50 DMA line ($39.60).
>>> FEATURED STOCK ARTICLE : New High With 6th Consecutive Volume-Driven Gain - 10/31/2022 |
View all notes |
Set NEW NOTE alert |
Company Profile |
SEC
News |
Chart |
Request a new note
C
A
S
I |
CCRN
-
NASDAQ
Cross Country Healthcare
DIVERSIFIED SERVICES - Staffing and Outsourcing Service
|
$33.98
|
+0.53
1.58% |
$34.19
|
571,545
62.74% of 50 DAV
50 DAV is 911,000
|
$38.68
-12.15%
|
9/9/2022
|
$27.32
|
PP = $30.61
|
|
MB = $32.14
|
Most Recent Note - 11/8/2022 5:24:46 PM
G - Posted has 2 gains with lighter volume after halting its slide. A damaging volume-driven loss on 11/04/22 briefly undercut its "max buy" level. Reported Sep '22 quarterly earnings +75% on +70% sales revenues versus the year ago period. Its 50 DMA line ($31.10) and prior highs in the $30.50 area define important near-term support to watch. See the latest FSU analysis for more details and a new annotated graph.
>>> FEATURED STOCK ARTICLE : Consolidating Above Prior Highs and Above 50-Day Moving Average - 11/8/2022 |
View all notes |
Set NEW NOTE alert |
Company Profile |
SEC
News |
Chart |
Request a new note
C
A
S
I |
CMC
-
NYSE
Commercial Metals Co
METALS and MINING - Steel and Iron
|
$46.91
|
+1.21
2.65% |
$47.28
|
1,080,538
103.70% of 50 DAV
50 DAV is 1,042,000
|
$46.68
0.49%
|
10/14/2022
|
$41.61
|
PP = $44.45
|
|
MB = $46.67
|
Most Recent Note - 11/7/2022 5:37:32 PM
Y - Pulled back today with lighter than average volume after touching a new 52-week high on the prior session while recently wedging higher. Fundamentals remain strong. See the latest FSU analysis for more details and a new annotated graph.
>>> FEATURED STOCK ARTICLE : Steel/Metal Products Firm Quietly Perched Near All Time High - 11/7/2022 |
View all notes |
Set NEW NOTE alert |
Company Profile |
SEC
News |
Chart |
Request a new note
C
A
S
I |
VRTX
-
NASDAQ
Vertex Pharmaceuticals
Medical-Biomed/Biotech
|
$306.50
|
+3.27
1.08% |
$311.68
|
1,350,623
95.25% of 50 DAV
50 DAV is 1,418,000
|
$316.48
-3.15%
|
10/24/2022
|
$308.47
|
PP = $306.05
|
|
MB = $321.35
|
Most Recent Note - 11/7/2022 5:22:52 PM
Y - Pulled back today with near average volume. Its 50 DMA line ($293.81) defines near-term support . Recently reported Sep '22 quarterly earnings +14% on +18% sales revenues versus the year ago period, below the +25% minimum earnings guideline raising concerns (C criteria). Annual earnings (A criteria) history has been strong.
>>> FEATURED STOCK ARTICLE : Volume-Driven Gain Triggered Technical Buy Signal - 10/24/2022 |
View all notes |
Set NEW NOTE alert |
Company Profile |
SEC
News |
Chart |
Request a new note
C
A
S
I |
Symbol/Exchange
Company Name
Industry Group |
PRICE |
CHANGE
(%Change) |
Day High |
Volume
(% DAV)
(% 50 day avg vol) |
52 Wk Hi
% From Hi |
Featured
Date |
Price
Featured |
Pivot Featured |
|
Max Buy |
CLFD
-
NASDAQ
Clearfield Inc
TELECOMMUNICATIONS - Cables / Satalite Equipment
|
$88.44
|
-2.21
-2.44% |
$95.18
|
441,321
183.12% of 50 DAV
50 DAV is 241,000
|
$130.01
-31.97%
|
10/25/2022
|
$117.96
|
PP = $130.11
|
|
MB = $136.62
|
Most Recent Note - 11/8/2022 5:30:34 PM
It will be dropped from the Featured Stocks list after today's damaging 7th consecutive loss with above average volume undercutting the prior low ($88.57). Decisively violated its 50 DMA line ($102.43) triggering a technical sell signal. A rebound above the 50 DMA line is needed for its outlook to improve. Due to report Sep '22 quarterly results. Volume and volatility often increase near earnings news.
>>> FEATURED STOCK ARTICLE : Clearfield Perched -8.6% Off High After Recent Rebound - 10/27/2022 |
View all notes |
Set NEW NOTE alert |
Company Profile |
SEC
News |
Chart |
Request a new note
C
A
S
I |
GPK
-
NYSE
Graphic Packaging Hldg
CONSUMER NON-DURABLES - Packaging and Containers
|
$22.85
|
+0.14
0.62% |
$23.04
|
2,570,634
91.45% of 50 DAV
50 DAV is 2,811,000
|
$24.07
-5.07%
|
10/25/2022
|
$22.75
|
PP = $24.17
|
|
MB = $25.38
|
Most Recent Note - 11/8/2022 5:34:47 PM
Y - Volume totals have been cooling while consolidating well above its 50 DMA line ($21.65). Subsequent gains above the pivot point backed by at least +40% above average volume may trigger a technical buy signal. Reported Sep '22 quarterly earnings +79% on +38% sales revenues versus the year ago period.
>>> FEATURED STOCK ARTICLE : Rebound Above 50-Day Moving Average Helped Outlook Improve - 10/25/2022 |
View all notes |
Set NEW NOTE alert |
Company Profile |
SEC
News |
Chart |
Request a new note
C
A
S
I |
CBZ
-
NYSE
C B I Z Inc
Comml Svcs-Consulting
|
$47.31
|
+0.18
0.38% |
$48.02
|
258,926
96.61% of 50 DAV
50 DAV is 268,000
|
$50.57
-6.45%
|
10/26/2022
|
$47.83
|
PP = $48.57
|
|
MB = $51.00
|
Most Recent Note - 11/4/2022 5:38:49 PM
Y - Pulled back today with below average volume for 5th consecutive loss undercutting the prior high in the $48 area raising some concerns. Its 50 DMA line ($45) defines the next important support. Recently reported Sep '22 quarterly earnings +24% on +28% sales revenues versus the year ago period. Volume and volatility often increase near earnings news.
>>> FEATURED STOCK ARTICLE : Earnings Report Due for Commercial Services and Consulting Firm - 10/26/2022 |
View all notes |
Set NEW NOTE alert |
Company Profile |
SEC
News |
Chart |
Request a new note
C
A
S
I |
ENPH
-
NASDAQ
Enphase Energy Inc
Energy-Solar
|
$280.07
|
+11.24
4.18% |
$282.72
|
2,748,778
68.26% of 50 DAV
50 DAV is 4,027,000
|
$324.84
-13.78%
|
10/26/2022
|
$301.55
|
PP = $324.94
|
|
MB = $341.19
|
Most Recent Note - 11/8/2022 5:36:48 PM
G - Posted a big gain today with lighter volume. A rebound above the 50 DMA line ($282) is needed for its outlook to improve. Faces near-term resistance due to overhead supply up to the $324 level. Fundamentals remain strong.
>>> FEATURED STOCK ARTICLE : Enphase Energy Rebound Above 50-Day Moving Average Helped Outlook - 10/28/2022 |
View all notes |
Set NEW NOTE alert |
Company Profile |
SEC
News |
Chart |
Request a new note
C
A
S
I |
HRMY
-
NASDAQ
Harmony Biosciences Hldg
Medical-Biomed/Biotech
|
$58.65
|
+1.54
2.70% |
$60.41
|
737,376
144.30% of 50 DAV
50 DAV is 511,000
|
$59.44
-1.33%
|
11/1/2022
|
$55.31
|
PP = $57.23
|
|
MB = $60.09
|
Most Recent Note - 11/8/2022 12:37:29 PM
Y - Posting a solid gain today after briefly undercutting is pivot point on the prior session. Prior highs in the $57 area define initial support to watch.
>>> FEATURED STOCK ARTICLE : Volume Heavy Behind Technical Breakout After Earnings - 11/1/2022 |
View all notes |
Set NEW NOTE alert |
Company Profile |
SEC
News |
Chart |
Request a new note
C
A
S
I |
Symbol/Exchange
Company Name
Industry Group |
PRICE |
CHANGE
(%Change) |
Day High |
Volume
(% DAV)
(% 50 day avg vol) |
52 Wk Hi
% From Hi |
Featured
Date |
Price
Featured |
Pivot Featured |
|
Max Buy |
CLH
-
NYSE
Clean Harbors Inc
Pollution Control
|
$114.72
|
+3.28
2.94% |
$115.04
|
417,720
96.03% of 50 DAV
50 DAV is 435,000
|
$124.49
-7.85%
|
11/2/2022
|
$121.59
|
PP = $124.59
|
|
MB = $130.82
|
Most Recent Note - 11/8/2022 5:33:00 PM
G - Posted a solid gain today with near average volume. Following damaging volume-driven losses a rebound above the 50 DMA line ($116.42) is needed for its outlook to improve. Fundamentals remain strong after reporting Sep '22 quarterly earnings +113% on +43% sales revenues versus the year ago period.
>>> FEATURED STOCK ARTICLE : Testing 50 Day Moving Average Line After Forming New Base - 11/2/2022 |
View all notes |
Set NEW NOTE alert |
Company Profile |
SEC
News |
Chart |
Request a new note
C
A
S
I |
NPO
-
NYSE
Enpro Industries Inc
Machinery-Gen Industrial
|
$120.12
|
-0.90
-0.74% |
$122.35
|
80,243
86.28% of 50 DAV
50 DAV is 93,000
|
$121.99
-1.53%
|
11/4/2022
|
$119.06
|
PP = $117.73
|
|
MB = $123.62
|
Most Recent Note - 11/4/2022 5:30:35 PM
Y - Finished strong after highlighted in yellow with pivot point cited based on its 1/14/22 high plus 10 cents in the earlier mid-day report. Faces no resistance due to overhead supply. Rallied into new 52-week high territory this week with impressive volume-driven gains after a 9-month consolidation. Reported Sep '22 quarterly earnings +65% on +34% sales revenues versus the year ago period, its 3rd strong quarterly comparison above the +25% minimum earnings guideline (C criteria), helping it better match the winning models of the fact-based investment system. Annual earnings growth has been steady even through the pandemic. See the latest FSU analysis for more details and an new annotated graph.
>>> FEATURED STOCK ARTICLE : Finished Strong After Highlighted in Friday Mid-Day Report - 11/4/2022 |
View all notes |
Set NEW NOTE alert |
Company Profile |
SEC
News |
Chart |
Request a new note
C
A
S
I |
|
|
|
THESE ARE NOT BUY RECOMMENDATIONS!
Comments contained in the body of this report are technical
opinions only. The material herein has been obtained
from sources believed to be reliable and accurate, however,
its accuracy and completeness cannot be guaranteed.
This site is not an investment advisor, hence it does
not endorse or recommend any securities or other investments.
Any recommendation contained in this report may not
be suitable for all investors and it is not to be deemed
an offer or solicitation on our part with respect to
the purchase or sale of any securities. All trademarks,
service marks and trade names appearing in this report
are the property of their respective owners, and are
likewise used for identification purposes only.
This report is a service available
only to active Paid Premium Members.
You may opt-out of receiving report notifications
at any time. Questions or comments may be submitted
by writing to Premium Membership Services 665 S.E. 10 Street, Suite 201 Deerfield Beach, FL 33441-5634 or by calling 1-800-965-8307
or 954-785-1121.
|
|
|