You are not logged in.
This means you
CAN ONLY VIEW reports that were published prior to Tuesday, April 8, 2025.
You
MUST UPGRADE YOUR MEMBERSHIP if you want to see any current reports.
AFTER MARKET UPDATE - THURSDAY, NOVEMBER 10TH, 2022
Previous After Market Report Next After Market Report >>>
|
|
|
|
DOW |
+1,201.43 |
33,715.37 |
+3.70% |
|
Volume |
1,193,201,296 |
+26% |
|
Volume |
6,383,061,000 |
+29% |
|
NASDAQ |
+760.97 |
11,114.15 |
+7.35% |
|
Advancers |
2,798 |
88% |
|
Advancers |
3,758 |
80% |
|
S&P 500 |
+207.80 |
3,956.37 |
+5.54% |
|
Decliners |
370 |
12% |
|
Decliners |
956 |
20% |
|
Russell 2000 |
+107.53 |
1,867.93 |
+6.11% |
|
52 Wk Highs |
75 |
|
|
52 Wk Highs |
139 |
|
|
S&P 600 |
+68.22 |
1,225.35 |
+5.90% |
|
52 Wk Lows |
50 |
|
|
52 Wk Lows |
212 |
|
|
 |
Major Averages' Rally Shows Greater Institutional Buying Conviction
Kenneth J. Gruneisen - Passed the CAN SLIM® Master's Exam
The Dow added 1201 points to notch its best day since 2020. The Nasdaq Composite soared 7.4%, while the S&P 500 jumped 5.5%. The volume totals reported were clearly higher than the prior session total on the NYSE and on the Nasdaq exchange, indicative of an encouraging increase in institutional buying demand. Breadth was clearly positive as advancers led decliners by more than a 7-1 margin on the NYSE and by almost a 4-1 margin on the Nasdaq exchange. There were 81 high-ranked companies from the Leaders List that hit new 52-week highs and were listed on the BreakOuts Page, versus the total of 22 on the prior session. New 52-week highs outnumbered new 52-week lows on the NYSE but new lows still outnumbered new highs on the Nasdaq exchange. The market is in a confirmed uptrend (M criteria). Healthy leadership (new 52-week highs totals) has continued to help the rally be productive. Only stocks meeting all key-criteria of the fact-based investment system should be considered as buy candidates.
Chart courtesy of www.stockcharts.com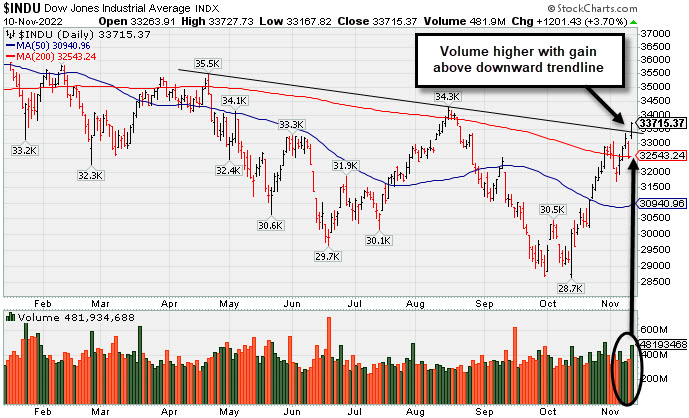 PICTURED: The Dow Jones Industrial Average posted a big gain with higher volume while rallying above a downward trendline connecting the April-August highs.
U.S. equites finished higher Thursday as investors digested better than expected inflation data. The October Consumer Price Index (CPI) report showed prices remained unchanged from September’s 0.4% monthly gain. Core CPI, which excludes the more volatile food and energy prices eased more than expected to 0.3% month-over-month. The headline CPI figure came in at 7.7%, easing from September’s 8.2% annual gain but still well above the Federal Reserve’s (Fed) 2% target. The headline print for Core CPI showed prices rose 6.3% year-over-year. The softer report has boosted hopes the Federal Reserve (Fed) will ease the pace of rate hikes at their December meeting. All sectors in the S&P 500 finished higher, with Information Technology pacing gains.
Treasury yields plummeted following the report. The benchmark 10-year note shed 27 basis points (0.27%) to 3.82%, while the 30-year bond yield fell 21 basis points (0.21%) to 4.05%. The two-year note yield, which is more sensitive to changes in policy, slid 26 basis points (0.26%) to 4.33%. The U.S. Dollar Index plunged 2.3% against a basket of major currencies, its worst performance since 2015. In commodities, West Texas Intermediate (WTI) crude reversed earlier losses to add 0.5% to $86.28/barrel amid a softening dollar. However, demand concerns due to China’s renewed COVID-19 restrictions have kept a cap on gains. |
 Kenneth J. Gruneisen started out as a licensed stockbroker in August 1987, a couple of months prior to the historic stock market crash that took the Dow Jones Industrial Average down -22.6% in a single day. He has published daily fact-based fundamental and technical analysis on high-ranked stocks online for two decades. Through FACTBASEDINVESTING.COM, Kenneth provides educational articles, news, market commentary, and other information regarding proven investment systems that work in good times and bad.
Comments contained in the body of this report are technical opinions only and are not necessarily those of Gruneisen Growth Corp. The material herein has been obtained from sources believed to be reliable and accurate, however, its accuracy and completeness cannot be guaranteed. Our firm, employees, and customers may effect transactions, including transactions contrary to any recommendation herein, or have positions in the securities mentioned herein or options with respect thereto. Any recommendation contained in this report may not be suitable for all investors and it is not to be deemed an offer or solicitation on our part with respect to the purchase or sale of any securities. |
|
 |
Retail and Semiconductor Indexes Posted Standout Gains
Kenneth J. Gruneisen - Passed the CAN SLIM® Master's Exam
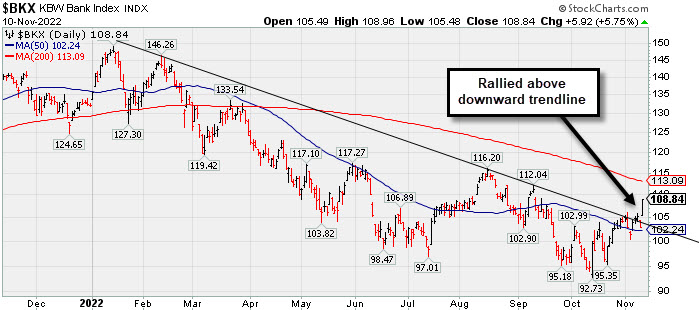
The Retail Index ($RLX +9.21%) posted a big gain on Thursday which had a great influence on the major averages. Financials also underpinned the rally as the Bank Index ($BKX +5.75%) and Broker/Dealer Index ($XBD +3.72%) both posted solid gains. The Semiconductor Index ($SOX +10.21%) led the tech sector with a huge gain while the Networking Index ($NWX +5.78%) and Biotech Index ($BTK +4.10%) also charged higher. Commodity-linked groups had a positive bias as the Gold & Silver Index ($XAU +6.81%) outpaced the Oil Services Index ($OSX +2.06%) and the Integrated Oil Index ($XOI +2.15%). PICTURED: The Bank Index ($BKX +5.75%) rallied above a downward trendline connecting this year's prior highs. Financial indexes have been reliable leading indicators, so the improvement bodes well for the broader market outlook.
| Oil Services |
$OSX |
84.22 |
+1.70 |
+2.06% |
+59.75% |
| Integrated Oil |
$XOI |
1,865.63 |
+39.31 |
+2.15% |
+58.35% |
| Semiconductor |
$SOX |
2,672.50 |
+247.69 |
+10.21% |
-32.28% |
| Networking |
$NWX |
796.72 |
+43.57 |
+5.78% |
-17.96% |
| Broker/Dealer |
$XBD |
478.67 |
+17.16 |
+3.72% |
-1.68% |
| Retail |
$RLX |
2,927.18 |
+246.76 |
+9.21% |
-30.74% |
| Gold & Silver |
$XAU |
116.38 |
+7.42 |
+6.81% |
-12.13% |
| Bank |
$BKX |
108.84 |
+5.92 |
+5.75% |
-17.68% |
| Biotech |
$BTK |
5,207.67 |
+205.01 |
+4.10% |
-5.63% |
|
|
|
 |
Finish Below Pivot Point Leaves Disciplined Investors Waiting
Kenneth J. Gruneisen - Passed the CAN SLIM® Master's Exam
Digi International Inc (DGII +$2.80 or +7.69% to $39.23) finished in the middle of its intra-day range after highlighted in yellow with pivot point cited based on its 10/31/22 high plus 10 cents in the earlier mid-day report (read here). It hit a new 52-week high with today's big volume-driven gain while trying to rise from an advanced ascending base pattern. The close below the pivot point suggests that it was encountering distributional pressure. Subsequent gains and a strong close above the pivot point backed by at least +40% above average volume may trigger a technical buy signal. Disciplined investors may keep the stock on their watchlist and wait for confirmation of fresh institutional buying demand.
DGII has a highest possible 99 Earnings Per Share Rating. It reported Sep '22 quarterly earnings +80% on +34% sales revenues versus the year ago period, its 3rd strong quarterly comparison well above the +25% minimum earnings guideline (C criteria), helping it better match the fact-based investment system's winning models. Annual earnings (A criteria) history has been strong after a downturn in FY '17-18.
The company hails from the Computer - Networking group which is currently ranked 12th on the 197 Industry Groups list (L criteria). The small supply of only 35.3 million shares outstanding can contribute to greater price volatility in the event of institutional buying or selling. The number of top-rated funds owning its shares rose from 308 in Dec '21 to 366 in Sep '22, a reassuring sign concerning the I criteria. It has an Accumulation/Distribution Rating of B+, a Timeliness Rating of A, and a Sponsorship Rating of B.
|
|
|
Color Codes Explained :
Y - Better candidates highlighted by our
staff of experts.
G - Previously featured
in past reports as yellow but may no longer be buyable under the
guidelines.
***Last / Change / Volume data in this table is the closing quote data***
Symbol/Exchange
Company Name
Industry Group |
PRICE |
CHANGE
(%Change) |
Day High |
Volume
(% DAV)
(% 50 day avg vol) |
52 Wk Hi
% From Hi |
Featured
Date |
Price
Featured |
Pivot Featured |
|
Max Buy |
 CI
-
NYSE
CI
-
NYSE
Cigna Corp
Medical-Managed Care
|
$323.34
|
-1.65
-0.51% |
$329.05
|
2,053,950
102.59% of 50 DAV
50 DAV is 2,002,000
|
$331.05
-2.33%
|
7/7/2022
|
$276.55
|
PP = $273.68
|
|
MB = $287.36
|
Most Recent Note - 11/8/2022 5:27:05 PM
G - Posted a gain with lighter volume as it hit yet another new all-time high. Reported Sep '22 quarterly earnings +5% after the close. Its 50 DMA line ($295.88) defines near-term support to watch.
>>> FEATURED STOCK ARTICLE : Cigna Reported Earnings Perched at High - 11/3/2022 |
View all notes |
Set NEW NOTE alert |
Company Profile |
SEC
News |
Chart |
Request a new note
C
A
S
I |
ESQ
-
NASDAQ
Esquire Financial Hldgs
Finance-Commercial Loans
|
$45.09
|
+2.14
4.98% |
$45.61
|
41,113
146.83% of 50 DAV
50 DAV is 28,000
|
$45.20
-0.24%
|
10/18/2022
|
$40.02
|
PP = $39.95
|
|
MB = $41.95
|
 Most Recent Note - 11/10/2022 5:46:44 PM
G - Posted a solid gain today with above average volume. Prior highs in the $41 area define initial support to watch above its 50 DMA line ($39.86).
>>> FEATURED STOCK ARTICLE : New High With 6th Consecutive Volume-Driven Gain - 10/31/2022 |
View all notes |
Set NEW NOTE alert |
Company Profile |
SEC
News |
Chart |
Request a new note
C
A
S
I |
CCRN
-
NASDAQ
Cross Country Healthcare
DIVERSIFIED SERVICES - Staffing and Outsourcing Service
|
$33.17
|
-0.07
-0.21% |
$34.66
|
681,799
74.35% of 50 DAV
50 DAV is 917,000
|
$38.68
-14.25%
|
9/9/2022
|
$27.32
|
PP = $30.61
|
|
MB = $32.14
|
Most Recent Note - 11/8/2022 5:24:46 PM
G - Posted has 2 gains with lighter volume after halting its slide. A damaging volume-driven loss on 11/04/22 briefly undercut its "max buy" level. Reported Sep '22 quarterly earnings +75% on +70% sales revenues versus the year ago period. Its 50 DMA line ($31.10) and prior highs in the $30.50 area define important near-term support to watch. See the latest FSU analysis for more details and a new annotated graph.
>>> FEATURED STOCK ARTICLE : Consolidating Above Prior Highs and Above 50-Day Moving Average - 11/8/2022 |
View all notes |
Set NEW NOTE alert |
Company Profile |
SEC
News |
Chart |
Request a new note
C
A
S
I |
CMC
-
NYSE
Commercial Metals Co
METALS and MINING - Steel and Iron
|
$47.89
|
+2.43
5.35% |
$47.94
|
1,119,046
106.37% of 50 DAV
50 DAV is 1,052,000
|
$46.96
1.98%
|
10/14/2022
|
$41.61
|
PP = $44.45
|
|
MB = $46.67
|
Most Recent Note - 11/10/2022 5:45:31 PM
G - Posted a big gain today with average volume hitting another new 52-week high and its color code is changed to green after wedging above its "max buy" level. Fundamentals remain strong. Prior high in the $44 area defines initial support to watch on pullbacks.
>>> FEATURED STOCK ARTICLE : Steel/Metal Products Firm Quietly Perched Near All Time High - 11/7/2022 |
View all notes |
Set NEW NOTE alert |
Company Profile |
SEC
News |
Chart |
Request a new note
C
A
S
I |
VRTX
-
NASDAQ
Vertex Pharmaceuticals
Medical-Biomed/Biotech
|
$311.03
|
+1.69
0.55% |
$316.18
|
2,103,982
146.82% of 50 DAV
50 DAV is 1,433,000
|
$316.48
-1.72%
|
10/24/2022
|
$308.47
|
PP = $306.05
|
|
MB = $321.35
|
Most Recent Note - 11/10/2022 5:52:16 PM
Y - Posted a 3rd consecutive gain today with +47% above average volume. Its 50 DMA line ($295.46) defines near-term support . Recently reported Sep '22 quarterly earnings +14% on +18% sales revenues versus the year ago period, below the +25% minimum earnings guideline raising concerns (C criteria). Annual earnings (A criteria) history has been strong.
>>> FEATURED STOCK ARTICLE : Volume-Driven Gain Triggered Technical Buy Signal - 10/24/2022 |
View all notes |
Set NEW NOTE alert |
Company Profile |
SEC
News |
Chart |
Request a new note
C
A
S
I |
Symbol/Exchange
Company Name
Industry Group |
PRICE |
CHANGE
(%Change) |
Day High |
Volume
(% DAV)
(% 50 day avg vol) |
52 Wk Hi
% From Hi |
Featured
Date |
Price
Featured |
Pivot Featured |
|
Max Buy |
GPK
-
NYSE
Graphic Packaging Hldg
CONSUMER NON-DURABLES - Packaging and Containers
|
$22.49
|
-0.08
-0.35% |
$23.23
|
6,630,692
235.80% of 50 DAV
50 DAV is 2,812,000
|
$24.07
-6.56%
|
10/25/2022
|
$22.75
|
PP = $24.17
|
|
MB = $25.38
|
Most Recent Note - 11/10/2022 12:48:11 PM
Y - Churning higher volume while pulling back today. Volume totals had been cooling while consolidating well above its 50 DMA line ($21.65). Subsequent gains above the pivot point backed by at least +40% above average volume may trigger a technical buy signal. Reported Sep '22 quarterly earnings +79% on +38% sales revenues versus the year ago period.
>>> FEATURED STOCK ARTICLE : Rebound Above 50-Day Moving Average Helped Outlook Improve - 10/25/2022 |
View all notes |
Set NEW NOTE alert |
Company Profile |
SEC
News |
Chart |
Request a new note
C
A
S
I |
CBZ
-
NYSE
C B I Z Inc
Comml Svcs-Consulting
|
$49.38
|
+2.20
4.66% |
$49.45
|
256,386
94.96% of 50 DAV
50 DAV is 270,000
|
$50.57
-2.35%
|
10/26/2022
|
$47.83
|
PP = $48.57
|
|
MB = $51.00
|
Most Recent Note - 11/10/2022 5:48:12 PM
Y - Posted a solid gain today rebounding back above the pivot point. Its 50 DMA line ($45.32) defines the next important support. Recently reported Sep '22 quarterly earnings +24% on +28% sales revenues versus the year ago period.
>>> FEATURED STOCK ARTICLE : Earnings Report Due for Commercial Services and Consulting Firm - 10/26/2022 |
View all notes |
Set NEW NOTE alert |
Company Profile |
SEC
News |
Chart |
Request a new note
C
A
S
I |
ENPH
-
NASDAQ
Enphase Energy Inc
Energy-Solar
|
$309.25
|
+24.50
8.60% |
$312.29
|
4,388,146
109.13% of 50 DAV
50 DAV is 4,021,000
|
$324.84
-4.80%
|
10/26/2022
|
$301.55
|
PP = $324.94
|
|
MB = $341.19
|
Most Recent Note - 11/10/2022 5:41:51 PM
Y - Color code is changed to yellow after a big 3rd consecutive gain today with higher (near average) volume had it rebounding well above the 50 DMA line ($282.50) helping its outlook improve. Faces little near-term resistance due to overhead supply up to the $324 level. Fundamentals remain strong.
>>> FEATURED STOCK ARTICLE : Enphase Energy Rebound Above 50-Day Moving Average Helped Outlook - 10/28/2022 |
View all notes |
Set NEW NOTE alert |
Company Profile |
SEC
News |
Chart |
Request a new note
C
A
S
I |
HRMY
-
NASDAQ
Harmony Biosciences Hldg
Medical-Biomed/Biotech
|
$58.71
|
+1.63
2.86% |
$59.57
|
565,681
109.84% of 50 DAV
50 DAV is 515,000
|
$59.35
-1.08%
|
11/1/2022
|
$55.31
|
PP = $57.23
|
|
MB = $60.09
|
Most Recent Note - 11/10/2022 5:53:46 PM
Y - Posted a solid gain today with average volume. Recently consolidating above prior highs in the $57 area that define initial support to watch.
>>> FEATURED STOCK ARTICLE : Volume Heavy Behind Technical Breakout After Earnings - 11/1/2022 |
View all notes |
Set NEW NOTE alert |
Company Profile |
SEC
News |
Chart |
Request a new note
C
A
S
I |
CLH
-
NYSE
Clean Harbors Inc
Pollution Control
|
$118.35
|
+6.06
5.40% |
$118.35
|
506,931
114.69% of 50 DAV
50 DAV is 442,000
|
$124.49
-4.93%
|
11/2/2022
|
$121.59
|
PP = $124.59
|
|
MB = $130.82
|
Most Recent Note - 11/10/2022 5:43:22 PM
Y - Today's volume-driven gain and rebound above the 50 DMA line ($116.33) helped its outlook to improve and its color code is changed to yellow. Fundamentals remain strong after reporting Sep '22 quarterly earnings +113% on +43% sales revenues versus the year ago period.
>>> FEATURED STOCK ARTICLE : Testing 50 Day Moving Average Line After Forming New Base - 11/2/2022 |
View all notes |
Set NEW NOTE alert |
Company Profile |
SEC
News |
Chart |
Request a new note
C
A
S
I |
Symbol/Exchange
Company Name
Industry Group |
PRICE |
CHANGE
(%Change) |
Day High |
Volume
(% DAV)
(% 50 day avg vol) |
52 Wk Hi
% From Hi |
Featured
Date |
Price
Featured |
Pivot Featured |
|
Max Buy |
NPO
-
NYSE
Enpro Industries Inc
Machinery-Gen Industrial
|
$122.90
|
+5.56
4.74% |
$124.10
|
99,837
106.21% of 50 DAV
50 DAV is 94,000
|
$120.03
2.39%
|
11/4/2022
|
$119.06
|
PP = $117.73
|
|
MB = $123.62
|
Most Recent Note - 11/10/2022 5:50:53 PM
Y - Posted a solid gain today with higher (near average) volume for another new 52-week high while challenging its "max buy" level. Reported Sep '22 quarterly earnings +65% on +34% sales revenues versus the year ago period, its 3rd strong quarterly comparison above the +25% minimum earnings guideline (C criteria), helping it better match the winning models of the fact-based investment system. Annual earnings growth has been steady even through the pandemic.
>>> FEATURED STOCK ARTICLE : Finished Strong After Highlighted in Friday Mid-Day Report - 11/4/2022 |
View all notes |
Set NEW NOTE alert |
Company Profile |
SEC
News |
Chart |
Request a new note
C
A
S
I |
DGII
-
NASDAQ
Digi International Inc
COMPUTER HARDWARE - Networking and Communication Dev
|
$39.23
|
+2.80
7.69% |
$42.04
|
791,672
197.92% of 50 DAV
50 DAV is 400,000
|
$40.86
-3.99%
|
11/10/2022
|
$41.82
|
PP = $40.96
|
|
MB = $43.01
|
Most Recent Note - 11/10/2022 5:38:05 PM
Y - Finished in the middle of its intra-day range after highlighted in yellow in the earlier mid-day report with pivot point cited based on its 10/31/22 high plus 10 cents. Hit a new 52-week high with today's big volume-driven gain while trying to rise from an advanced "ascending base" pattern. Subsequent gains above the pivot point are needed to confirm a proper technical buy signal. Reported Sep '22 quarterly earnings +80% versus the year ago period, its 3rd strong quarterly comparison well above the +25% minimum earnings guideline (C criteria), helping it better match the fact-based investment system's winning models. Annual earnings (A criteria) history has been strong after a downturn in FY '17-18. See the latest FSU analysis for more details and an annotated graph.
>>> FEATURED STOCK ARTICLE : Finish Below Pivot Point Leaves Disciplined Investors Waiting - 11/10/2022 |
View all notes |
Set NEW NOTE alert |
Company Profile |
SEC
News |
Chart |
Request a new note
C
A
S
I |
GFF
-
NYSE
Griffon Corporation
MATERIALS and CONSTRUCTION - General Building Materials
|
$33.88
|
+2.26
7.15% |
$34.38
|
531,003
151.72% of 50 DAV
50 DAV is 350,000
|
$34.92
-2.98%
|
11/10/2022
|
$34.13
|
PP = $35.02
|
|
MB = $36.77
|
Most Recent Note - 11/10/2022 12:43:32 PM
Y - Color code is changed to yellow with new pivot point cited based on its 9/09/22 high plus 10 cents. Challenging its 52-week high with today's gap up and volume-driven gain. Subsequent gains above the pivot point backed by at least +40% above average volume may trigger a technical buy signal. Showed resilience since dropped from the Featured Stocks list on 9/23/22. Fundamentals remain strong. Due to report Sep '22 quarterly results on 10/16/22. Volume and volatility often increase near earnings news.
>>> FEATURED STOCK ARTICLE : Griffon Near All-Time High Making Limited Progress - 9/15/2022 |
View all notes |
Set NEW NOTE alert |
Company Profile |
SEC
News |
Chart |
Request a new note
C
A
S
I |
|
|
|
THESE ARE NOT BUY RECOMMENDATIONS!
Comments contained in the body of this report are technical
opinions only. The material herein has been obtained
from sources believed to be reliable and accurate, however,
its accuracy and completeness cannot be guaranteed.
This site is not an investment advisor, hence it does
not endorse or recommend any securities or other investments.
Any recommendation contained in this report may not
be suitable for all investors and it is not to be deemed
an offer or solicitation on our part with respect to
the purchase or sale of any securities. All trademarks,
service marks and trade names appearing in this report
are the property of their respective owners, and are
likewise used for identification purposes only.
This report is a service available
only to active Paid Premium Members.
You may opt-out of receiving report notifications
at any time. Questions or comments may be submitted
by writing to Premium Membership Services 665 S.E. 10 Street, Suite 201 Deerfield Beach, FL 33441-5634 or by calling 1-800-965-8307
or 954-785-1121.
|
|
|