You are not logged in.
This means you
CAN ONLY VIEW reports that were published prior to Friday, April 18, 2025.
You
MUST UPGRADE YOUR MEMBERSHIP if you want to see any current reports.
AFTER MARKET UPDATE - TUESDAY, AUGUST 1ST, 2023
Previous After Market Report Next After Market Report >>>
|
|
|
|
DOW |
+71.15 |
35,630.68 |
+0.20% |
|
Volume |
877,029,981 |
+227% |
|
Volume |
4,706,965,800 |
+98% |
|
NASDAQ |
-62.11 |
14,283.91 |
-0.43% |
|
Advancers |
974 |
33% |
|
Advancers |
1,707 |
38% |
|
S&P 500 |
-12.23 |
4,576.73 |
-0.27% |
|
Decliners |
1,933 |
66% |
|
Decliners |
2,726 |
61% |
|
Russell 2000 |
-9.01 |
1,994.17 |
-0.45% |
|
52 Wk Highs |
103 |
|
|
52 Wk Highs |
101 |
|
|
S&P 600 |
-6.31 |
1,276.12 |
-0.49% |
|
52 Wk Lows |
17 |
|
|
52 Wk Lows |
88 |
|
|
 |
Major Indices were Mixed as Earnings News Created a Negative Bias
Kenneth J. Gruneisen - Passed the CAN SLIM® Master's Exam
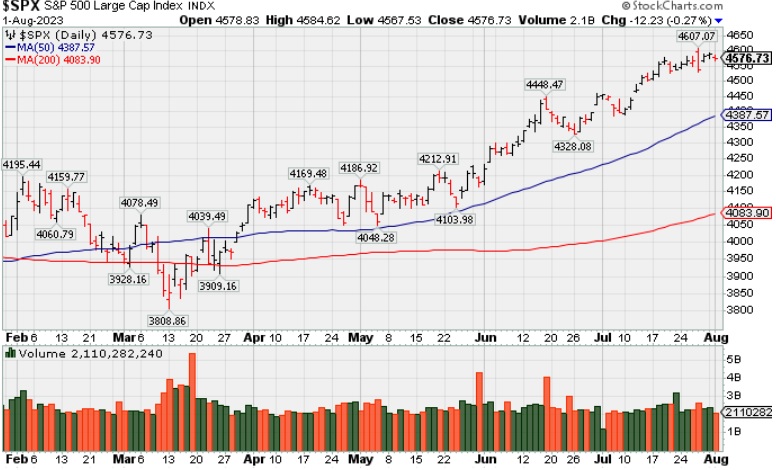
The major averages ended mixed as the Dow again posted a standout gain. The volume totals reported were higher on the NYSE and on the Nasdaq exchange versus the prior session. Breadth was negative as decliners led advancers by a 2-1 margin on the NYSE and by 3-2 on the Nasdaq exchange. There were 49 high-ranked companies from the Leaders List that hit a new 52-week high and were listed on the BreakOuts Page, versus the total of 57 on the prior session. New 52-week highs totals outnumbered new 52-week lows on the NYSE and on the Nasdaq exchange. The major indices are in a confirmed uptrend (M criteria). Appropriate new buying efforts may be considered under the fact-based investment system.
PICTURED: The S&P 500 Index is perched near its 2023 high.
The Dow Jones Industrial Average outperformed (+0.2%), closing with a slim gain. It was helped by a big move higher in Caterpillar (CAT +8.9%), which reported pleasing quarterly results. Only two of the S&P 500 sectors closed with gains, information technology (+0.3%) and industrials (+0.1%), while the utilities sector (-1.3%) saw the largest decline.
Some companies that reported earnings and endured sizable losses included Norwegian Cruise Line Holdings (NCLH -12.1%), ZoomInfo Technologies (ZI -27.0%), and Uber (UBER -5.7%).
The 10-yr note yield settled back above 4.00%, up nine basis points to 4.05%. The 2-yr note yield rose five basis points 4.91%. |
 Kenneth J. Gruneisen started out as a licensed stockbroker in August 1987, a couple of months prior to the historic stock market crash that took the Dow Jones Industrial Average down -22.6% in a single day. He has published daily fact-based fundamental and technical analysis on high-ranked stocks online for two decades. Through FACTBASEDINVESTING.COM, Kenneth provides educational articles, news, market commentary, and other information regarding proven investment systems that work in good times and bad.
Comments contained in the body of this report are technical opinions only and are not necessarily those of Gruneisen Growth Corp. The material herein has been obtained from sources believed to be reliable and accurate, however, its accuracy and completeness cannot be guaranteed. Our firm, employees, and customers may effect transactions, including transactions contrary to any recommendation herein, or have positions in the securities mentioned herein or options with respect thereto. Any recommendation contained in this report may not be suitable for all investors and it is not to be deemed an offer or solicitation on our part with respect to the purchase or sale of any securities. |
|
 |
Gold & Silver, Retail, Financial, and Biotech Indexes Led Decliners
Kenneth J. Gruneisen - Passed the CAN SLIM® Master's Exam
The Retail Index ($RLX -1.02%), Bank Index ($BKX -0.99%) and the Broker/Dealer Index ($XBD -0.38%) each lost ground. The tech sector was mixed as the Networking Index ($NWX +1.83%) finished higher but the Biotech Index ($BTK -0.92%) lost ground. Commodity-linked groups had a negative bias as the Gold & Silver Index ($XAU -3.54%) outpaced the Oil Services Index ($OSX -0.41%) and the Integrated Oil Index ($XOI -0.17%) to the downside.
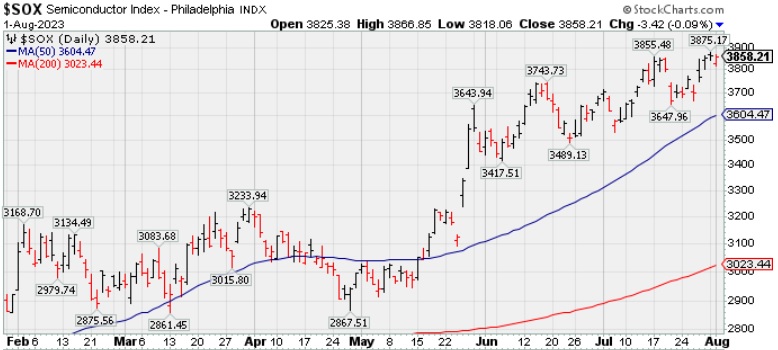
PICTURED: The Semiconductor Index ($SOX -0.09%) finished flat, perched near its 2023 high.
| Oil Services |
$OSX |
93.12 |
-0.38 |
-0.41% |
+11.04% |
| Integrated Oil |
$XOI |
1,834.61 |
-3.19 |
-0.17% |
+2.65% |
| Semiconductor |
$SOX |
3,858.21 |
-3.42 |
-0.09% |
+52.37% |
| Networking |
$NWX |
826.40 |
+14.89 |
+1.83% |
+5.50% |
| Broker/Dealer |
$XBD |
510.21 |
-1.93 |
-0.38% |
+13.60% |
| Retail |
$RLX |
3,538.20 |
-36.51 |
-1.02% |
+28.47% |
| Gold & Silver |
$XAU |
122.56 |
-4.50 |
-3.54% |
+1.41% |
| Bank |
$BKX |
88.45 |
-0.88 |
-0.99% |
-12.29% |
| Biotech |
$BTK |
5,277.22 |
-49.26 |
-0.92% |
-0.07% |
|
|
|
 |
Featured Stocks
Kenneth J. Gruneisen - Passed the CAN SLIM® Master's Exam
|
|
|
Color Codes Explained :
Y - Better candidates highlighted by our
staff of experts.
G - Previously featured
in past reports as yellow but may no longer be buyable under the
guidelines.
***Last / Change / Volume data in this table is the closing quote data***
Symbol/Exchange
Company Name
Industry Group |
PRICE |
CHANGE
(%Change) |
Day High |
Volume
(% DAV)
(% 50 day avg vol) |
52 Wk Hi
% From Hi |
Featured
Date |
Price
Featured |
Pivot Featured |
|
Max Buy |
 STRL
-
NASDAQ
STRL
-
NASDAQ
Sterling Infrastructure
Bldg-Heavy Construction
|
$62.98
|
+2.99
4.98% |
$63.21
|
717,474
218.08% of 50 DAV
50 DAV is 329,000
|
$62.50
0.77%
|
12/14/2022
|
$32.41
|
PP = $33.72
|
|
MB = $35.41
|
 Most Recent Note - 8/1/2023 1:02:46 PM
G - Posting a 6th consecutive gain today for a new all-time high. It is very extended from any sound base and its 50 DMA line ($54) defines near-term support to watch. Mar '23 quarterly earnings were below the +25% minimum guideline (C criteria) raising fundamental concerns.
>>> FEATURED STOCK ARTICLE : Streak of Gains Lifts Sterling Infrastructure to New Highs - 7/3/2023 |
View all notes |
Set NEW NOTE alert |
Company Profile |
SEC
News |
Chart |
Request a new note
C
A
S
I |
FIX
-
NYSE
Comfort Systems USA
Bldg-A/C and Heating Prds
|
$173.66
|
-0.31
-0.18% |
$176.09
|
155,371
69.05% of 50 DAV
50 DAV is 225,000
|
$176.27
-1.48%
|
4/27/2023
|
$148.85
|
PP = $152.23
|
|
MB = $159.84
|
Most Recent Note - 7/28/2023 6:00:19 PM
G - Hit a new all-time high today after testing its 50 DMA line ($159) on the prior session. Reported Jun '23 quarterly earnings +65% on +27% versus the year ago period. Volume and volatility often increase near earnings news.
>>> FEATURED STOCK ARTICLE : Pulled Back From High With Lighter Volume - 7/19/2023 |
View all notes |
Set NEW NOTE alert |
Company Profile |
SEC
News |
Chart |
Request a new note
C
A
S
I |
KOF
-
NYSE
Coca-Cola Femsa ADR
Beverages-Non-Alcoholic
|
$83.70
|
-0.62
-0.74% |
$84.41
|
88,268
54.15% of 50 DAV
50 DAV is 163,000
|
$91.23
-8.25%
|
6/9/2023
|
$88.61
|
PP = $91.33
|
|
MB = $95.90
|
Most Recent Note - 7/25/2023 5:23:18 PM
G - Due to report Jun '23 quarterly results. Volume and volatility often increase near earnings news. Its Relative Strength Rating has slumped to 79 while lingering below its 50 DMA line. A rebound above the 50 DMA line ($85.33) is needed for its outlook to improve. Fundamentals remain strong.
>>> FEATURED STOCK ARTICLE : Slumping Below 50-Day Moving Average and Below Prior Low - 7/6/2023 |
View all notes |
Set NEW NOTE alert |
Company Profile |
SEC
News |
Chart |
Request a new note
C
A
S
I |
CLH
-
NYSE
Clean Harbors
Pollution Control
|
$166.74
|
+0.48
0.29% |
$169.27
|
385,896
100.76% of 50 DAV
50 DAV is 383,000
|
$172.54
-3.36%
|
3/10/2023
|
$136.89
|
PP = $136.74
|
|
MB = $143.58
|
Most Recent Note - 7/25/2023 5:10:35 PM
G - Hovering near its all-time high, extended from any sound base. Its 50 DMA line ($155.89) defines important near-term support to watch on pullbacks. Due to report Jun '23 quarterly results on 8/02/23.
>>> FEATURED STOCK ARTICLE : Negative Reversal at High After +26% Rally in 4 Months - 7/18/2023 |
View all notes |
Set NEW NOTE alert |
Company Profile |
SEC
News |
Chart |
Request a new note
C
A
S
I |
SPSC
-
NASDAQ
SPS Commerce
Comp Sftwr-Spec Enterprs
|
$175.16
|
-5.23
-2.90% |
$179.91
|
231,491
111.29% of 50 DAV
50 DAV is 208,000
|
$196.39
-10.81%
|
4/24/2023
|
$150.01
|
PP = $157.56
|
|
MB = $165.44
|
Most Recent Note - 7/31/2023 5:01:47 PM
Y - Posted a 2nd consecutive volume-driven gain and rebounded above its 50 DMA line ($177) and its color code is changed to yellow. Reported Jun '23 quarterly earnings +30% on +19% sales revenues versus the year-ago period.
>>> FEATURED STOCK ARTICLE : Pulled Back Abruptly to 50-Day Moving Average Line - 7/24/2023 |
View all notes |
Set NEW NOTE alert |
Company Profile |
SEC
News |
Chart |
Request a new note
C
A
S
I |
Symbol/Exchange
Company Name
Industry Group |
PRICE |
CHANGE
(%Change) |
Day High |
Volume
(% DAV)
(% 50 day avg vol) |
52 Wk Hi
% From Hi |
Featured
Date |
Price
Featured |
Pivot Featured |
|
Max Buy |
HUBB
-
NYSE
Hubbell
Electrical-Power/Equipmt
|
$315.70
|
+3.70
1.19% |
$320.39
|
627,430
149.39% of 50 DAV
50 DAV is 420,000
|
$340.06
-7.16%
|
4/25/2023
|
$262.85
|
PP = $257.51
|
|
MB = $270.39
|
Most Recent Note - 7/26/2023 5:38:35 PM
G - Abruptly retreated from its all-time high with today's 2nd consecutive volume-driven undercutting its 50 DMA line ($311) raising concerns. Fundamentals remain strong after Jun '23 earnings rose +45%. See the latest FSU analysis for more details and a new annotated graph.
>>> FEATURED STOCK ARTICLE : Pulled Back Undercutting 50 Day Moving Average Line - 7/26/2023 |
View all notes |
Set NEW NOTE alert |
Company Profile |
SEC
News |
Chart |
Request a new note
C
A
S
I |
NVR
-
NYSE
N V R Inc
MATERIALS and CONSTRUCTION - Residential Construction
|
$6,324.00
|
+17.56
0.28% |
$6,350.00
|
16,906
71.94% of 50 DAV
50 DAV is 23,500
|
$6,474.53
-2.32%
|
4/25/2023
|
$5,882.18
|
PP = $5,978.25
|
|
MB = $6,277.16
|
Most Recent Note - 7/27/2023 7:50:27 PM
G - Pulled back today with above average volume. Reported Jun '23 quarterly earnings -6% on -13% sales revenues raising greater fundamental concerns. Its prior low ($6,009 on 7/06) and 50 DMA line ($6,028) define near-term support watch.
>>> FEATURED STOCK ARTICLE : New High Close for Strong Homebuilder - 6/30/2023 |
View all notes |
Set NEW NOTE alert |
Company Profile |
SEC
News |
Chart |
Request a new note
C
A
S
I |
PHM
-
NYSE
PulteGroup
Bldg-Resident/Comml
|
$84.62
|
+0.23
0.27% |
$85.18
|
1,595,949
56.86% of 50 DAV
50 DAV is 2,807,000
|
$86.01
-1.62%
|
4/25/2023
|
$65.17
|
PP = $64.01
|
|
MB = $67.21
|
Most Recent Note - 7/27/2023 7:42:23 PM
G - There was a "negative reversal" today after hitting another new high. It is very extended from any sound base. Recently reported earnings +18% for the Jun '23 quarter versus the year-ago period, below the +25% minimum guideline (C criteria) raising concerns. Important support to watch is defined by its 50 DMA line ($74.54). See the latest FSU analysis for more details and a new annotated graph.
>>> FEATURED STOCK ARTICLE : Reversed After Reaching a New All-Time High - 7/27/2023 |
View all notes |
Set NEW NOTE alert |
Company Profile |
SEC
News |
Chart |
Request a new note
C
A
S
I |
AMPH
-
NASDAQ
Amphastar Pharm
Medical-Biomed/Biotech
|
$60.64
|
-0.05
-0.08% |
$60.98
|
252,697
57.04% of 50 DAV
50 DAV is 443,000
|
$63.72
-4.83%
|
5/15/2023
|
$43.56
|
PP = $44.15
|
|
MB = $46.36
|
Most Recent Note - 7/26/2023 5:40:51 PM
G - Hovering near its all-time high. It did not form a sound new base of sufficient length. Its 50 DMA line ($52) defines important support to watch. Fundamentals remain strong.
>>> FEATURED STOCK ARTICLE : 6th Straight Gain for Amphastar - 7/20/2023 |
View all notes |
Set NEW NOTE alert |
Company Profile |
SEC
News |
Chart |
Request a new note
C
A
S
I |
ANET
-
NYSE
Arista Networks
Computer-Networking
|
$185.61
|
+30.52
19.68% |
$190.65
|
16,026,711
461.33% of 50 DAV
50 DAV is 3,474,000
|
$180.39
2.89%
|
8/1/2023
|
$188.84
|
PP = $178.46
|
|
MB = $187.38
|
Most Recent Note - 8/1/2023 12:45:50 PM
Y - Gapped up today and rallied for a new high with a considerable volume-driven gain. Color code is changed to yellow with new pivot point cited based on its 5/30/23 high plus 10 cents. Bullish action came after it reported Jun '23 quarterly earnings +40% on +39% sales revenues versus the year-ago period. Volume and volatility often increase near earnings news.
>>> FEATURED STOCK ARTICLE : Wedging Higher After Rebounding Above 50-Day Moving Average - 7/12/2023 |
View all notes |
Set NEW NOTE alert |
Company Profile |
SEC
News |
Chart |
Request a new note
C
A
S
I |
Symbol/Exchange
Company Name
Industry Group |
PRICE |
CHANGE
(%Change) |
Day High |
Volume
(% DAV)
(% 50 day avg vol) |
52 Wk Hi
% From Hi |
Featured
Date |
Price
Featured |
Pivot Featured |
|
Max Buy |
PANW
-
NASDAQ
Palo Alto Networks
Computer Sftwr-Security
|
$253.17
|
+3.21
1.28% |
$254.03
|
2,315,442
35.30% of 50 DAV
50 DAV is 6,560,000
|
$258.88
-2.21%
|
6/5/2023
|
$228.35
|
PP = $213.73
|
|
MB = $224.42
|
Most Recent Note - 7/31/2023 4:58:13 PM
G - Posted a 4th consecutive gain today with light volume. Volume totals have been cooling while consolidating above its 50 DMA line ($234) which defines near-term support to watch. Fundamentals remain strong. See the latest FSU analysis for more details and a new annotated graph.
>>> FEATURED STOCK ARTICLE : Volume Cooling While Hovering Near High - 7/31/2023 |
View all notes |
Set NEW NOTE alert |
Company Profile |
SEC
News |
Chart |
Request a new note
C
A
S
I |
LSCC
-
NASDAQ
Lattice Semiconductor
Elec-Semicondctor Fablss
|
$92.98
|
+2.04
2.24% |
$93.47
|
3,139,116
141.72% of 50 DAV
50 DAV is 2,215,000
|
$98.18
-5.30%
|
6/13/2023
|
$91.73
|
PP = $96.92
|
|
MB = $101.77
|
Most Recent Note - 7/27/2023 7:44:48 PM
Y - Color code is changed to yellow after today's gap up and big volume-driven gain helped it promptly rebound above the 50 DMA line helping its outlook improve, Due to report Jun '23 quarterly results on 7/31/23.
>>> FEATURED STOCK ARTICLE : Perched Near Pivot Point After Best-Ever Close - 7/17/2023 |
View all notes |
Set NEW NOTE alert |
Company Profile |
SEC
News |
Chart |
Request a new note
C
A
S
I |
XPEL
-
NASDAQ
XPEL
Auto/Truck-Replace Parts
|
$82.80
|
+1.57
1.93% |
$83.31
|
79,753
60.88% of 50 DAV
50 DAV is 131,000
|
$87.46
-5.33%
|
6/28/2023
|
$83.14
|
PP = $87.11
|
|
MB = $91.47
|
Most Recent Note - 7/31/2023 4:25:08 PM
Y - Color code was changed to yellow after rebounding back above its 50 DMA line ($78.68) with 2 consecutive gains. Stalled after recently hitting a new 52-week high. Reported Mar '23 quarterly earnings +46% on +19% sales revenues versus the year-ago period, its 3rd quarterly comparison above the +25% minimum earnings guideline (C criteria), helping it better match the winning models of the fact-based investment system.
>>> FEATURED STOCK ARTICLE : XPEL Returns to Featured Stocks List After Long Consolidation - 6/28/2023 |
View all notes |
Set NEW NOTE alert |
Company Profile |
SEC
News |
Chart |
Request a new note
C
A
S
I |
FTNT
-
NASDAQ
Fortinet
Computer Sftwr-Security
|
$78.03
|
+0.31
0.40% |
$78.58
|
2,616,112
48.23% of 50 DAV
50 DAV is 5,424,000
|
$81.24
-3.95%
|
7/10/2023
|
$78.29
|
PP = $74.45
|
|
MB = $78.17
|
Most Recent Note - 7/31/2023 5:03:18 PM
Y - Volume totals are cooling while perched near its all-time high. Its prior high in the $74 area defines support above its 50 DMA line ($73.14) Fundamentals remain strong.
>>> FEATURED STOCK ARTICLE : Fortinet Powered to New All-Time High - 7/10/2023 |
View all notes |
Set NEW NOTE alert |
Company Profile |
SEC
News |
Chart |
Request a new note
C
A
S
I |
PII
-
NYSE
Polaris
Leisure-Products
|
$132.88
|
-2.96
-2.18% |
$135.02
|
608,435
100.24% of 50 DAV
50 DAV is 607,000
|
$138.49
-4.05%
|
7/11/2023
|
$126.92
|
PP = $123.97
|
|
MB = $130.17
|
Most Recent Note - 7/31/2023 5:06:08 PM
G - Posted a gain today with above average volume. Reported Jun '23 quarterly earnings +0% versus the year ago period, below the +25% minimum earnings guideline (C criteria). On pullbacks, the prior highs define initial support to watch above its 50 DMA line ($120.73).
>>> FEATURED STOCK ARTICLE : Volume-Driven Breakout for Polaris - 7/11/2023 |
View all notes |
Set NEW NOTE alert |
Company Profile |
SEC
News |
Chart |
Request a new note
C
A
S
I |
Symbol/Exchange
Company Name
Industry Group |
PRICE |
CHANGE
(%Change) |
Day High |
Volume
(% DAV)
(% 50 day avg vol) |
52 Wk Hi
% From Hi |
Featured
Date |
Price
Featured |
Pivot Featured |
|
Max Buy |
ALGM
-
NASDAQ
Allegro MicroSystems
Elec-Semicondctor Fablss
|
$45.24
|
-6.37
-12.34% |
$49.64
|
4,346,323
296.27% of 50 DAV
50 DAV is 1,467,000
|
$53.05
-14.72%
|
7/13/2023
|
$49.86
|
PP = $48.82
|
|
MB = $51.26
|
Most Recent Note - 8/1/2023 12:40:58 PM
G - Gapped down today undercutting the prior low with a big volume-driven loss raising concerns and its color code is changed to green. Reported Jun '23 quarterly earnings +63% versus the year-ago period. Volume and volatility often increase near earnings news. Disciplined investors always limit losses by selling any stock that falls more than -8% from their purchase price.
>>> FEATURED STOCK ARTICLE : Volume Heavy Behind Considerable Breakout Gain - 7/13/2023 |
View all notes |
Set NEW NOTE alert |
Company Profile |
SEC
News |
Chart |
Request a new note
C
A
S
I |
ESQ
-
NASDAQ
Esquire Finl Hldgs
Finance-Commercial Loans
|
$49.84
|
-0.11
-0.21% |
$50.05
|
31,998
106.66% of 50 DAV
50 DAV is 30,000
|
$54.03
-7.75%
|
7/14/2023
|
$45.80
|
PP = $48.23
|
|
MB = $50.64
|
Most Recent Note - 7/27/2023 7:46:46 PM
Y - Color code is changed to yellow after pulling back below its "max buy" level. Found support above its 50 DMA line on the recent pullback.
>>> FEATURED STOCK ARTICLE : Esquire Perched Near Prior Highs - 7/14/2023 |
View all notes |
Set NEW NOTE alert |
Company Profile |
SEC
News |
Chart |
Request a new note
C
A
S
I |
MEDP
-
NASDAQ
Medpace Holdings
Medical-Research Eqp/Svc
|
$255.64
|
+2.47
0.98% |
$255.99
|
223,837
57.25% of 50 DAV
50 DAV is 391,000
|
$264.19
-3.24%
|
7/25/2023
|
$196.32
|
PP = $241.57
|
|
MB = $253.65
|
Most Recent Note - 7/27/2023 7:53:30 PM
Y - Pulled back with average volume today for a 2nd consecutive loss after hitting a new all-time high. Prior highs in the $241 area define support to watch on pullbacks. Reported earnings increases above the +25% minimum earnings guideline (C criteria) in the past 5 quarterly comparisons through Jun '23.
>>> FEATURED STOCK ARTICLE : Medpace Posted a Solid Volume-Driven Gain for a New High - 7/25/2023 |
View all notes |
Set NEW NOTE alert |
Company Profile |
SEC
News |
Chart |
Request a new note
C
A
S
I |
|
|
|
THESE ARE NOT BUY RECOMMENDATIONS!
Comments contained in the body of this report are technical
opinions only. The material herein has been obtained
from sources believed to be reliable and accurate, however,
its accuracy and completeness cannot be guaranteed.
This site is not an investment advisor, hence it does
not endorse or recommend any securities or other investments.
Any recommendation contained in this report may not
be suitable for all investors and it is not to be deemed
an offer or solicitation on our part with respect to
the purchase or sale of any securities. All trademarks,
service marks and trade names appearing in this report
are the property of their respective owners, and are
likewise used for identification purposes only.
This report is a service available
only to active Paid Premium Members.
You may opt-out of receiving report notifications
at any time. Questions or comments may be submitted
by writing to Premium Membership Services 665 S.E. 10 Street, Suite 201 Deerfield Beach, FL 33441-5634 or by calling 1-800-965-8307
or 954-785-1121.
|
|
|