You are not logged in.
This means you
CAN ONLY VIEW reports that were published prior to Thursday, April 17, 2025.
You
MUST UPGRADE YOUR MEMBERSHIP if you want to see any current reports.
AFTER MARKET UPDATE - THURSDAY, APRIL 20TH, 2023
Previous After Market Report Next After Market Report >>>
|
|
|
|
DOW |
-110.39 |
33,786.62 |
-0.33% |
|
Volume |
838,542,518 |
+10% |
|
Volume |
4,533,009,800 |
-8% |
|
NASDAQ |
-97.67 |
12,059.56 |
-0.80% |
|
Advancers |
1,071 |
37% |
|
Advancers |
1,606 |
36% |
|
S&P 500 |
-24.73 |
4,129.79 |
-0.60% |
|
Decliners |
1,822 |
63% |
|
Decliners |
2,833 |
64% |
|
Russell 2000 |
-9.74 |
1,789.70 |
-0.54% |
|
52 Wk Highs |
64 |
|
|
52 Wk Highs |
57 |
|
|
S&P 600 |
-4.20 |
1,163.81 |
-0.36% |
|
52 Wk Lows |
31 |
|
|
52 Wk Lows |
149 |
|
|
 |
Major Averages Sputter Again as Market Reads Latest Earnigs News
Kenneth J. Gruneisen - Passed the CAN SLIM® Master's Exam
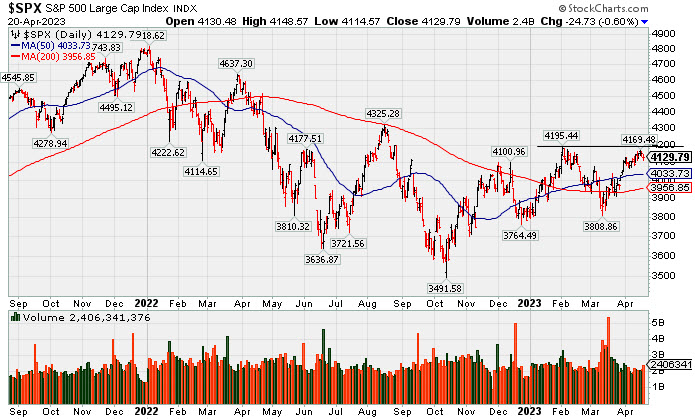
The Dow lost 110 points (-0.3%), while the Nasdaq Composite declined 0.8%. The S&P 500 decreased 0.6% with ten of 11 sectors finishing in negative territory. Volume totals reported were mixed, higher than the prior session on the NYSE and ligher on the Nasdaq exchange. Breadth was negative as decliners led advancers by almost a 3-2 margin on the NYSE and by a 7-4 margin on the Nasdaq exchange. There were 35 high-ranked companies from the Leaders List that hit a new 52-week high and were listed on the BreakOuts Page, versus the total of 36 on the prior session. New 52-week highs outnumbered new 52-week lows on the NYSE but new lows still solidly outnumbered new highs on the Nasdaq exchange.The major indices are in a confirmed uptrend (M criteria). Appropriate new buying efforts may be considered under the fact-based investment system.
PICTURED: The S&P 500 Index is perched -1.6% off its February 2023 high.
U.S. equities finished lower Thursday amid weak corporate earnings and contracting economic data. In Fedspeak, Cleveland Federal Reserve (Fed) President Loretta Mester reiterated rates may have further to rise this year and may need to stay at that heightened rate for a while as inflation remains too high. In earnings, the American Express Company (AXP -1.01%) fell after the company missed earnings estimates but topped revenue expectations with a 22% year-over-year growth. The company also reaffirmed its full year outlook with a growth between 15-17%. AT&T Inc.(T -10.41%) was hitr hard after it reported strong earnings but missed revenue estimates as subscriber growth continued to dwindle.
On the data front, initial jobless claims for the week ended April 15 unexpectedly ticked higher to 245,000 from the prior week’s upwardly revised 240,000 print. Meanwhile, March’s existing home sales declined further than forecasted to a 2.4% decline from the 13.8% growth seen in February as aspiring home buyers struggle to break into the market. Lastly, the Conference Board’s Leading Economic Index fell by 1.2% in March potentially signaling a recession in the near future.
Treasuries strengthened, with the yield on the 10-year note declining five basis points (0.05%) to 3.54%, while the 30-year bond yield dropped four basis points (0.04%) to 3.74%. The yield on the two-year note declined eleven basis points (0.11%) to 4.15%. In commodities, West Texas Intermediate (WTI) crude fell 2.4% to $77.29/barrel as oil prices fall to their lowest level in roughly three-weeks amid expectations of another potential interest rate hike.
|
 Kenneth J. Gruneisen started out as a licensed stockbroker in August 1987, a couple of months prior to the historic stock market crash that took the Dow Jones Industrial Average down -22.6% in a single day. He has published daily fact-based fundamental and technical analysis on high-ranked stocks online for two decades. Through FACTBASEDINVESTING.COM, Kenneth provides educational articles, news, market commentary, and other information regarding proven investment systems that work in good times and bad.
Comments contained in the body of this report are technical opinions only and are not necessarily those of Gruneisen Growth Corp. The material herein has been obtained from sources believed to be reliable and accurate, however, its accuracy and completeness cannot be guaranteed. Our firm, employees, and customers may effect transactions, including transactions contrary to any recommendation herein, or have positions in the securities mentioned herein or options with respect thereto. Any recommendation contained in this report may not be suitable for all investors and it is not to be deemed an offer or solicitation on our part with respect to the purchase or sale of any securities. |
|
 |
Tech, Energy, and Financial Indexes Fell
Kenneth J. Gruneisen - Passed the CAN SLIM® Master's Exam
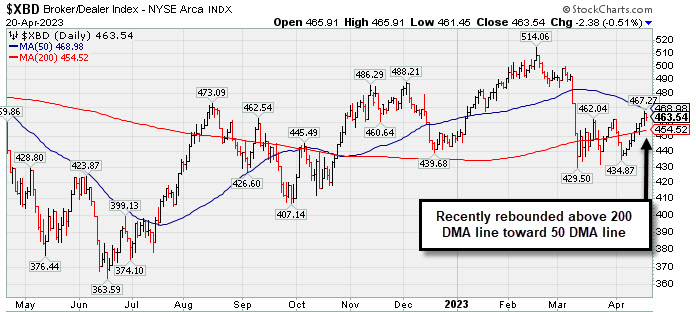
Financial stocks had a negative influence on the major average as the Bank Index ($BKX -1.81%) outpaced the Broker/Dealer Index ($XBD -0.51%) to the downside. The Retail Index ($RLX +0.05%) was little changed. The Semiconductor Index ($SOX -0.00%) also finished flat, meanwhile the Networking Index ($NWX -1.24%) and Biotech Index ($BTK -1.15%) both fell. The Oil Services Index ($OSX -1.34%) and Integrated Oil Index ($XOI -0.85%) both outpaced the Gold & Silver Index ($XAU -0.11%) to the downside.
PICTURED: The Broker/Dealer Index ($XBD -0.51%) has recently rebounded above its 200-day moving average (DMA) line toward its 50 DMA line.
| Oil Services |
$OSX |
80.95 |
-1.10 |
-1.34% |
-3.47% |
| Integrated Oil |
$XOI |
1,767.69 |
-15.14 |
-0.85% |
-1.09% |
| Semiconductor |
$SOX |
3,046.28 |
-0.10 |
-0.00% |
+20.31% |
| Networking |
$NWX |
773.79 |
-9.71 |
-1.24% |
-1.22% |
| Broker/Dealer |
$XBD |
463.54 |
-2.38 |
-0.51% |
+3.21% |
| Retail |
$RLX |
3,028.52 |
+1.65 |
+0.05% |
+9.97% |
| Gold & Silver |
$XAU |
135.94 |
-0.15 |
-0.11% |
+12.48% |
| Bank |
$BKX |
84.16 |
-1.55 |
-1.81% |
-16.55% |
| Biotech |
$BTK |
5,346.94 |
-62.01 |
-1.15% |
+1.25% |
|
|
|
 |
Perion Pulls Back Toward 50-Day Moving Average Line
Kenneth J. Gruneisen - Passed the CAN SLIM® Master's Exam
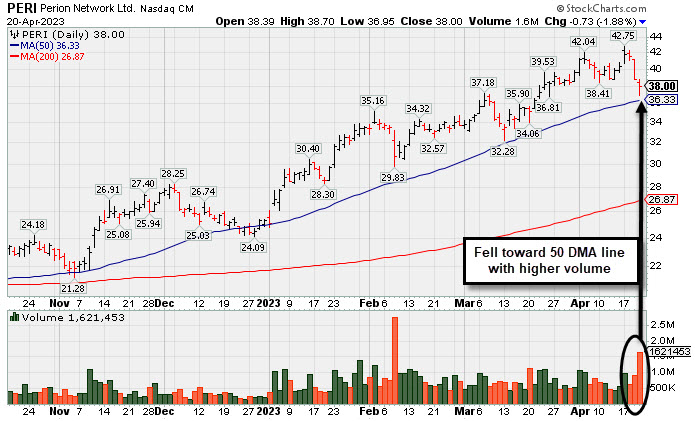
Perion Networks Ltd (PERI -$0.73 or -1.88% to $38.00) suffered a 3rd consecutive loss today with ever-increasing volume, abruptly retreating from its all-time high. Its 50-day moving average (DMA) line ($36.33) defines important near-term support to watch. Below its 50 DMA line, the prior high ($33) defines important near-term support. Any violations would raise concerns and trigger technical sell signals.
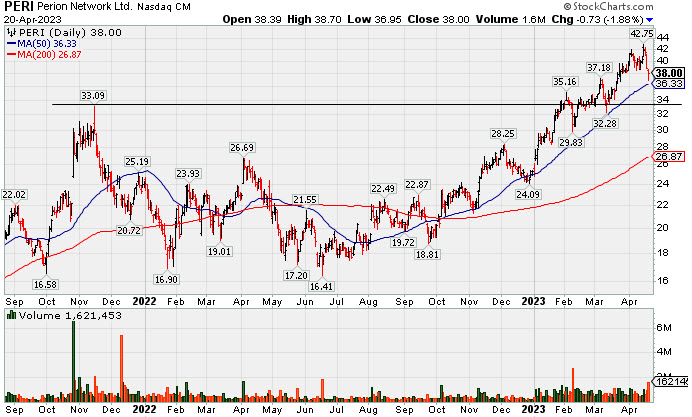
PERI was highlighted in yellow in the 1/25/23 mid-day report (read here) with pivot point cited based upon its 11/15/21 high plus 10 cents. It was last shown in this FSU section in greater detail on 3/31/23 with an annotated graph under the headline, "Hit Another New High With Gain Backed by Light Volume".
PERI has a 98 Earnings Per Share Rating. It reported Dec '22 quarterly earnings +45% on +33% sales revenues versus the year ago period and its prior quarterly earnings history has been above the +25% minimum (C criteria). Its annual earnings (A criteria) history has been improving steadily after a downturn from FY '15-18. It hails from the Commercial Services-Advertising group which is currently ranked 69th on the 197 Industry Groups list.
There are 45.8 million shares outstanding which can contribute to greater price volatility in the event of institutional buying or selling. The number of top-rated funds owning its shares rose from 113 in Mar '22 to 169 in Mar '23, a reassuring sign concerning the I criteria. Its current Up/Down Volume Ratio of 1.5 is an unbiased indication its shares have been under accumulation over the past 50 days.
Charts below illustrate the pullback to the 50 DMA line, followed by the longer-term chart which provides context since the technical breakout noted in earlier reports.
|
|
|
Color Codes Explained :
Y - Better candidates highlighted by our
staff of experts.
G - Previously featured
in past reports as yellow but may no longer be buyable under the
guidelines.
***Last / Change / Volume data in this table is the closing quote data***
Symbol/Exchange
Company Name
Industry Group |
PRICE |
CHANGE
(%Change) |
Day High |
Volume
(% DAV)
(% 50 day avg vol) |
52 Wk Hi
% From Hi |
Featured
Date |
Price
Featured |
Pivot Featured |
|
Max Buy |
 GPK
-
NYSE
GPK
-
NYSE
Graphic Packaging
CONSUMER NON-DURABLES - Packaging and Containers
|
$24.68
|
-0.31
-1.24% |
$24.88
|
3,213,748
103.27% of 50 DAV
50 DAV is 3,112,000
|
$25.62
-3.67%
|
10/25/2022
|
$22.75
|
PP = $24.17
|
|
MB = $25.38
|
Most Recent Note - 4/17/2023 3:47:51 PM
Y - Volume totals have been near average or lighter than average while consolidating below its "max buy" level and just -3% below its all-time high. Recent gains lacked great volume conviction. Its 50 DMA line ($24.16) and recent low ($22.99 on 3/16/23) define important near-term support to watch.
>>> FEATURED STOCK ARTICLE : Quietly Consolidating Just Below "Max Buy" Level - 4/10/2023 |
View all notes |
Set NEW NOTE alert |
Company Profile |
SEC
News |
Chart |
Request a new note
C
A
S
I |
STRL
-
NASDAQ
Sterling Infrastructure
MATERIALS and; CONSTRUCTION - Heavy Construction
|
$37.79
|
+0.50
1.34% |
$37.84
|
115,890
46.54% of 50 DAV
50 DAV is 249,000
|
$42.00
-10.02%
|
12/14/2022
|
$32.41
|
PP = $33.72
|
|
MB = $35.41
|
Most Recent Note - 4/18/2023 5:56:46 PM
G - Met resistance at its 50 DMA line today and ended with a loss and near the session low breaking a streak of 6 consecutive gains with below-average volume. A rebound above the 50 DMA line ($37.74) is needed for its outlook to improve.
>>> FEATURED STOCK ARTICLE : Volume-Driven 50-Day Moving Average Violation Triggered Sell Signal - 4/5/2023 |
View all notes |
Set NEW NOTE alert |
Company Profile |
SEC
News |
Chart |
Request a new note
C
A
S
I |
PERI
-
NASDAQ
Perion Network
Comml Svcs-Advertising
|
$38.00
|
-0.73
-1.88% |
$38.70
|
1,621,453
212.23% of 50 DAV
50 DAV is 764,000
|
$42.75
-11.11%
|
1/25/2023
|
$31.79
|
PP = $33.19
|
|
MB = $34.85
|
 Most Recent Note - 4/20/2023 4:48:55 PM
G - Suffered a 3rd consecutive loss today with ever-increasing volume, abruptly retreating from its all-time high. Its 50 DMA line ($36.33) defines important near-term support to watch. See the latest FSU analysis for more details and a new annotated graph.
>>> FEATURED STOCK ARTICLE : Perion Pulls Back Toward 50-Day Moving Average Line - 4/20/2023 |
View all notes |
Set NEW NOTE alert |
Company Profile |
SEC
News |
Chart |
Request a new note
C
A
S
I |
ALGM
-
NASDAQ
Allegro MicroSystems
Elec-Semiconductor Mfg
|
$41.87
|
-1.77
-4.06% |
$42.61
|
2,722,125
198.55% of 50 DAV
50 DAV is 1,371,000
|
$48.72
-14.06%
|
1/31/2023
|
$37.80
|
PP = $38.38
|
|
MB = $40.30
|
Most Recent Note - 4/20/2023 12:16:04 PM
G - Gapped down today for a more damaging volume-driven loss undercutting prior lows and raising greater concerns after the 50 DMA violation on 4/17/23 triggered a noted technical sell signal. Only a prompt rebound above the 50 DMA line ($44.90) would help its outlook improve.
>>> FEATURED STOCK ARTICLE : Consolidating Near 50 DMA Line After Recent Rally - 4/11/2023 |
View all notes |
Set NEW NOTE alert |
Company Profile |
SEC
News |
Chart |
Request a new note
C
A
S
I |
FIX
-
NYSE
Comfort Systems USA
MATERIALS and CONSTRUCTION - General Contractors
|
$137.50
|
+3.38
2.52% |
$137.55
|
217,526
76.32% of 50 DAV
50 DAV is 285,000
|
$152.13
-9.62%
|
2/23/2023
|
$136.52
|
PP = $128.78
|
|
MB = $135.22
|
Most Recent Note - 4/20/2023 4:52:22 PM
Y - Color code is changed to yellow after it posted a 4th consecutive small gain today with below-average volume and rebounded above the 50 DMA line ($136.35) helping its outlook improve. Fundamentals remain strong. It has not formed a sound base and faces resistance due to overhead supply.
>>> FEATURED STOCK ARTICLE : Pullback With Higher Volume While Consolidating - 4/4/2023 |
View all notes |
Set NEW NOTE alert |
Company Profile |
SEC
News |
Chart |
Request a new note
C
A
S
I |
Symbol/Exchange
Company Name
Industry Group |
PRICE |
CHANGE
(%Change) |
Day High |
Volume
(% DAV)
(% 50 day avg vol) |
52 Wk Hi
% From Hi |
Featured
Date |
Price
Featured |
Pivot Featured |
|
Max Buy |
KOF
-
NYSE
Coca-Cola Femsa ADR
FOOD and BEVERAGE - Beverages - Soft Drinks
|
$83.63
|
-0.05
-0.06% |
$83.99
|
118,639
64.13% of 50 DAV
50 DAV is 185,000
|
$84.68
-1.24%
|
3/7/2023
|
$76.63
|
PP = $77.11
|
|
MB = $80.97
|
Most Recent Note - 4/17/2023 3:43:23 PM
G - Hovering at its all-time high following a noted streak of 12 consecutive gains. Extended from the prior base. On pullbacks, prior highs in the $79-$77 area define initial support to watch above its 50 DMA line ($76.15).
>>> FEATURED STOCK ARTICLE : Streak of 11 Straight Gains into New High Territory - 4/12/2023 |
View all notes |
Set NEW NOTE alert |
Company Profile |
SEC
News |
Chart |
Request a new note
C
A
S
I |
ANET
-
NYSE
Arista Networks
Computer-Networking
|
$155.39
|
-2.70
-1.71% |
$157.43
|
2,295,432
88.70% of 50 DAV
50 DAV is 2,588,000
|
$171.44
-9.36%
|
3/8/2023
|
$147.59
|
PP = $148.67
|
|
MB = $156.10
|
Most Recent Note - 4/19/2023 5:29:39 PM
G - Gapped down and fell with higher volume today for a 4th consecutive loss. Its 50 DMA line ($152) and prior highs in the $148-145 area define important support to watch.
>>> FEATURED STOCK ARTICLE : Near High With Volume Cooling Following Volume-Driven Gains - 4/17/2023 |
View all notes |
Set NEW NOTE alert |
Company Profile |
SEC
News |
Chart |
Request a new note
C
A
S
I |
CLH
-
NYSE
Clean Harbors
Pollution Control
|
$144.06
|
-0.21
-0.15% |
$146.03
|
325,445
75.51% of 50 DAV
50 DAV is 431,000
|
$146.05
-1.36%
|
3/10/2023
|
$136.89
|
PP = $136.74
|
|
MB = $143.58
|
Most Recent Note - 4/19/2023 5:10:39 PM
G - Posted a small gain today with near-average volume for a best-ever close and its color code is changed to green after wedging up above its "max buy" level. Found prompt support near its 50 DMA line ($135.84) during recent consolidations. Below that important short-term average, the recent low ($129.93 on 3/24/23) defines the next important support where a violation would raise concerns and trigger a more worrisome technical sell signal. Fundamentals remain strong. See the latest FSU analysis for more details and a new annotated graph.
>>> FEATURED STOCK ARTICLE : Wedged to a New High Close Above "Max Buy" Level - 4/19/2023 |
View all notes |
Set NEW NOTE alert |
Company Profile |
SEC
News |
Chart |
Request a new note
C
A
S
I |
MTRN
-
NYSE
Materion
METALS and MINING - Industrial Metals and Minerals
|
$113.11
|
-1.60
-1.39% |
$115.00
|
82,794
64.18% of 50 DAV
50 DAV is 129,000
|
$119.75
-5.54%
|
4/18/2023
|
$114.52
|
PP = $118.30
|
|
MB = $124.22
|
Most Recent Note - 4/20/2023 4:17:25 PM
Y - Still sputtering after highlighted in yellow with pivot point cited based on its 3/03/23 high plus 10 cents in the 4/18/23 mid-day report. Hit a new all-time high with an early gain, but encountered distributional pressure. Subsequent gains and a strong close above the pivot point backed by at least +40% above average volume may trigger a proper technical buy signal. Reported earnings +33% on +9% sales revenues for the Dec '22 quarter versus the year-ago period. Three of the past 4 quarterly comparisons were above the +25% minimum earnings guideline (C criteria). A downturn in its FY '20 annual earnings history (A criteria) has been followed by much stronger '21 and '22 results.
>>> FEATURED STOCK ARTICLE : Encountered Distributional Pressure When Poised for Breakout - 4/18/2023 |
View all notes |
Set NEW NOTE alert |
Company Profile |
SEC
News |
Chart |
Request a new note
C
A
S
I |
|
|
|
THESE ARE NOT BUY RECOMMENDATIONS!
Comments contained in the body of this report are technical
opinions only. The material herein has been obtained
from sources believed to be reliable and accurate, however,
its accuracy and completeness cannot be guaranteed.
This site is not an investment advisor, hence it does
not endorse or recommend any securities or other investments.
Any recommendation contained in this report may not
be suitable for all investors and it is not to be deemed
an offer or solicitation on our part with respect to
the purchase or sale of any securities. All trademarks,
service marks and trade names appearing in this report
are the property of their respective owners, and are
likewise used for identification purposes only.
This report is a service available
only to active Paid Premium Members.
You may opt-out of receiving report notifications
at any time. Questions or comments may be submitted
by writing to Premium Membership Services 665 S.E. 10 Street, Suite 201 Deerfield Beach, FL 33441-5634 or by calling 1-800-965-8307
or 954-785-1121.
|
|
|