You are not logged in.
This means you
CAN ONLY VIEW reports that were published prior to Thursday, April 17, 2025.
You
MUST UPGRADE YOUR MEMBERSHIP if you want to see any current reports.
AFTER MARKET UPDATE - TUESDAY, APRIL 4TH, 2023
Previous After Market Report Next After Market Report >>>
|
|
|
|
DOW |
-198.77 |
33,402.38 |
-0.59% |
|
Volume |
920,858,603 |
-3% |
|
Volume |
4,228,579,300 |
-12% |
|
NASDAQ |
-63.13 |
12,126.33 |
-0.52% |
|
Advancers |
887 |
30% |
|
Advancers |
1,332 |
30% |
|
S&P 500 |
-23.91 |
4,100.60 |
-0.58% |
|
Decliners |
2,036 |
70% |
|
Decliners |
3,147 |
70% |
|
Russell 2000 |
-32.66 |
1,769.66 |
-1.81% |
|
52 Wk Highs |
48 |
|
|
52 Wk Highs |
86 |
|
|
S&P 600 |
-23.36 |
1,159.35 |
-1.98% |
|
52 Wk Lows |
39 |
|
|
52 Wk Lows |
234 |
|
|
Last Wednesday's gains with higher volume and greater leadership marked a follow-through day confirming a new uptrend. New buying efforts may be made based on the (M criteria) of the fact-based investment system. Disciplined investors know to only buy stocks meeting all key criteria.
|
 |
Breadth Negative but Volume Lighter as Major Indices Fell
Kenneth J. Gruneisen - Passed the CAN SLIM® Master's Exam
The Dow lost 198 points (0.6%), while the S&P 500 shed 0.6% with seven of 11 sectors finishing in negative territory. The Nasdaq Composite lost 0.5%. Volume totals reported were lighter than the prior session on the NYSE and on the Nasdaq exchange, action indicative of less selling or "distributuinal pressure" from the institutional crowd. Breadth was negative as decliners led advancers by more than a 2-1 margin on the NYSE and on the Nasdaq exchange. There were 30 high-ranked companies from the Leaders List that hit a new 52-week high and were listed on the BreakOuts Page, versus the total of 28 on the prior session. New 52-week highs outnumbered new 52-week lows on the NYSE, but on the Nasdaq exchange new 52-week lows swelled and outnumbered shrinking new 52-week highs. The major indices are in a new confirmed uptrend (M criteria). Appropriate new buying efforts may be considered under the fact-based investment system.
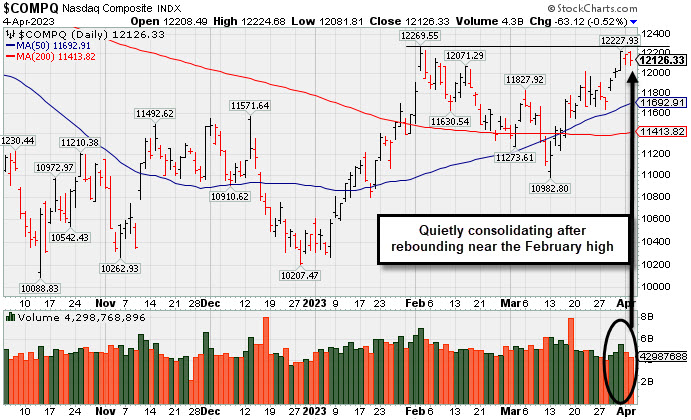
PICTURED: The Nasdaq Composite Index is quietly consolidating after rebounding near its February high. The tech heavy index has made steady progress since its 50-day moving average (DMA) line crossed above its 200-day moving average, a bullish technical signal termed a "golden cross".
U.S. equities finished lower Tuesday following today’s jobs data and amid a renewed rout in banking shares despite assurances from U.S. Treasury Secretary Janet Yellen. In an interview this morning, Yellen said the banking turmoil is stabilizing, but U.S. regulators remain ready to act to protect deposits if needed.
On the data front today, the Job Openings and Labor Turnover Survey (JOLTS) showed job openings fell under 10 million in February to their lowest since May 2021. The larger than expected drop in vacancies suggests the labor market, which has remained resilient in the wake of the Federal Reserve’s (Fed) monetary policy, is beginning to soften. Meanwhile, factory orders fell 0.7% in February while durable goods orders declined 1%. Treasuries strengthened as investors digested the jobs data, with the yield on the benchmark 10-year note down seven basis points (0.07%) to 3.34%, while the 30-year bond yield shed three basis points (0.03%) to 3.60%. The yield on the two-year note, which is more sensitive to changes in Fed policy, fell 14 basis points (0.14%) to 3.83%. In commodities, West Texas Intermediate (WTI) crude climbed 0.1% to $80.46/barrel as the production cuts from the Organization of Petroleum Exporting Countries and their allies (OPEC+) outweighed concerns over oil demand.
|
 Kenneth J. Gruneisen started out as a licensed stockbroker in August 1987, a couple of months prior to the historic stock market crash that took the Dow Jones Industrial Average down -22.6% in a single day. He has published daily fact-based fundamental and technical analysis on high-ranked stocks online for two decades. Through FACTBASEDINVESTING.COM, Kenneth provides educational articles, news, market commentary, and other information regarding proven investment systems that work in good times and bad.
Comments contained in the body of this report are technical opinions only and are not necessarily those of Gruneisen Growth Corp. The material herein has been obtained from sources believed to be reliable and accurate, however, its accuracy and completeness cannot be guaranteed. Our firm, employees, and customers may effect transactions, including transactions contrary to any recommendation herein, or have positions in the securities mentioned herein or options with respect thereto. Any recommendation contained in this report may not be suitable for all investors and it is not to be deemed an offer or solicitation on our part with respect to the purchase or sale of any securities. |
|
 |
Standout Gain for Gold & Silver Index; Retail Index Inched Higher
Kenneth J. Gruneisen - Passed the CAN SLIM® Master's Exam
The Broker/Dealer Index ($XBD -1.53%) and Bank Index ($BKX -1.97%) both slumped and created a drag on the major averages. The Retail Index ($RLX +0.44%) eked out a small gains. Commodity-linked groups were mixed as the Gold & Silver Index ($XAU +3.22%) rose while the Oil Services Index ($OSX -2.90%) and Integrated Oil Index ($XOI -2.66%). The Semiconductor Index ($SOX -1.81%) led the tech sector lower while the Networking Index ($NWX -0.68%) and Biotech Index ($BTK -0.46%).
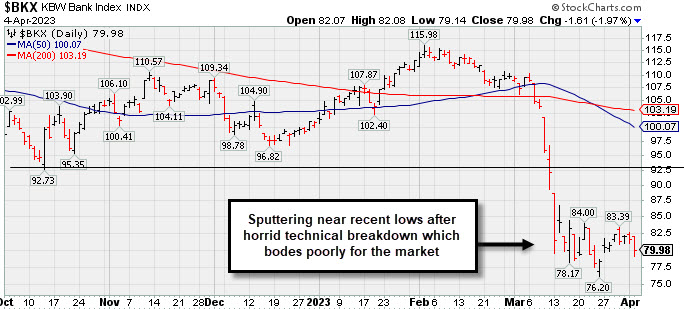
PICTURED: The Bank Index ($BKX -1.97%) is sputtering near the recent low after a horrid technical breakdown. Longtime members recognize that the weakness in financial stocks bodes poorly for the broader market outlook because the financials have been reliable "leading indicators".
| Oil Services |
$OSX |
81.22 |
-2.43 |
-2.90% |
-3.14% |
| Integrated Oil |
$XOI |
1,769.66 |
-48.39 |
-2.66% |
-0.98% |
| Semiconductor |
$SOX |
3,142.50 |
-57.92 |
-1.81% |
+24.11% |
| Networking |
$NWX |
840.42 |
-5.76 |
-0.68% |
+7.29% |
| Broker/Dealer |
$XBD |
446.16 |
-6.93 |
-1.53% |
-0.66% |
| Retail |
$RLX |
3,007.12 |
+13.28 |
+0.44% |
+9.19% |
| Gold & Silver |
$XAU |
138.03 |
+4.30 |
+3.22% |
+14.20% |
| Bank |
$BKX |
79.98 |
-1.61 |
-1.97% |
-20.69% |
| Biotech |
$BTK |
5,292.34 |
-24.61 |
-0.46% |
+0.21% |
|
|
|
 |
Pullback With Higher Volume While Consolidating
Kenneth J. Gruneisen - Passed the CAN SLIM® Master's Exam
Comfort Systems U S A (FIX -$6.41 or -4.37% to $140.20) pulled back today with above-average volume, action indicative of distributional pressure. It has been consolidating well above its 50-day moving average (DMA) line ($133.81) and the prior low ($132.56 on 3/24/23) defining important support to watch. Fundamentals remain strong.
FIX was highlighted in yellow in the 2/23/23 mid-day report (read here) with a pivot point cited based on its 11/23/22 high plus 10 cents. It broke out hitting a new 52-week high (N criteria) with volume +131% above average behind the gain, triggering a technical buy signal while rising from an orderly 3-month base. It was last shown in greater detail on 3/16/23 with an annotated graph under the headline, "Consolidating Above Support at Prior High and 50-Day Moving Average".
Bullish action came after it reported earnings +48% on +31% sales revenues for the Dec '22 quarter versus the year ago period, its 4th strong quarter above the +25% minimum guideline (C criteria). Annual earning history has been strong and steady. It has a 97 Earnings Per Share Rating.
It hails from the Building - A/C & Heating Products group which is currently ranked 30th on the 197 Industry Groups list. It has a small supply of only 35.7 million shares outstanding (S criteria) which can contribute to greater price volatility in the event of institutional buying or selling. The number of top-rated funds that own its shares rose from 487 in Jun '22 to 561 in Dec '22, a reassuring sign regarding the I criteria. Its current Up/Down Volume Ratio is 1.7, an unbiased indication its shares have been under accumulation over the past 50 days.
|
|
|
Color Codes Explained :
Y - Better candidates highlighted by our
staff of experts.
G - Previously featured
in past reports as yellow but may no longer be buyable under the
guidelines.
***Last / Change / Volume data in this table is the closing quote data***
Symbol/Exchange
Company Name
Industry Group |
PRICE |
CHANGE
(%Change) |
Day High |
Volume
(% DAV)
(% 50 day avg vol) |
52 Wk Hi
% From Hi |
Featured
Date |
Price
Featured |
Pivot Featured |
|
Max Buy |
 GPK
-
NYSE
GPK
-
NYSE
Graphic Packaging
CONSUMER NON-DURABLES - Packaging and Containers
|
$25.04
|
-0.45
-1.77% |
$25.50
|
2,071,720
62.55% of 50 DAV
50 DAV is 3,312,000
|
$25.62
-2.26%
|
10/25/2022
|
$22.75
|
PP = $24.17
|
|
MB = $25.38
|
 Most Recent Note - 4/4/2023 8:32:44 PM
Y - Pulled back today with light volume breaking a streak of 8 consecutive gains and closing below its "max buy" level. Recent gains lacked great volume conviction. Its 50 DMA line ($23.93) and recent low ($22.99 on 3/16/23) define important near-term support to watch.
>>> FEATURED STOCK ARTICLE : Found Encouraging Support Near 50-Day Moving Average Line - 3/21/2023 |
View all notes |
Set NEW NOTE alert |
Company Profile |
SEC
News |
Chart |
Request a new note
C
A
S
I |
STRL
-
NASDAQ
Sterling Infrastructure
MATERIALS and; CONSTRUCTION - Heavy Construction
|
$35.58
|
-2.41
-6.34% |
$38.25
|
231,715
82.76% of 50 DAV
50 DAV is 280,000
|
$42.00
-15.29%
|
12/14/2022
|
$32.41
|
PP = $33.72
|
|
MB = $35.41
|
Most Recent Note - 4/4/2023 8:36:37 PM
G - Suffered a damaging loss today with volume below average as it violated its 50 DMA line ($37.62) and slumped below the recent lows in the mid-$36 area triggering technical sell signals. Only a prompt rebound above the 50 DMA line would help its outlook improve.
>>> FEATURED STOCK ARTICLE : Posting Quiet Gains Just Above 50-Day Moving Average Line - 3/20/2023 |
View all notes |
Set NEW NOTE alert |
Company Profile |
SEC
News |
Chart |
Request a new note
C
A
S
I |
PERI
-
NASDAQ
Perion Network
Comml Svcs-Advertising
|
$41.17
|
+0.04
0.10% |
$42.04
|
1,006,884
125.86% of 50 DAV
50 DAV is 800,000
|
$41.31
-0.34%
|
1/25/2023
|
$31.79
|
PP = $33.19
|
|
MB = $34.85
|
Most Recent Note - 3/31/2023 5:11:32 PM
G - Posted a quiet gain for another new all-time high. Its 50 DMA line ($34.45) defines important near-term support. See the latest FSU analysis for more details and a new annotated graph.
>>> FEATURED STOCK ARTICLE : Hit Another New High With Gain Backed by Light Volume - 3/31/2023 |
View all notes |
Set NEW NOTE alert |
Company Profile |
SEC
News |
Chart |
Request a new note
C
A
S
I |
ALGM
-
NASDAQ
Allegro MicroSystems
Elec-Semiconductor Mfg
|
$46.24
|
-1.62
-3.38% |
$48.21
|
1,209,595
72.13% of 50 DAV
50 DAV is 1,677,000
|
$48.72
-5.09%
|
1/31/2023
|
$37.80
|
PP = $38.38
|
|
MB = $40.30
|
Most Recent Note - 4/4/2023 8:15:06 PM
G - Pulled back from its all-time high with today's 2nd consecutive loss with below-average volume. It is extended from the previously noted base. Its 50 DMA line ($43.42) and recent low ($41.30 on 3/18/23) define important near-term support to watch on pullbacks.
>>> FEATURED STOCK ARTICLE : Extended From Prior Base and Perched Near All-Time High - 3/22/2023 |
View all notes |
Set NEW NOTE alert |
Company Profile |
SEC
News |
Chart |
Request a new note
C
A
S
I |
FIX
-
NYSE
Comfort Systems USA
MATERIALS and CONSTRUCTION - General Contractors
|
$140.20
|
-6.41
-4.37% |
$147.32
|
469,208
178.41% of 50 DAV
50 DAV is 263,000
|
$152.13
-7.84%
|
2/23/2023
|
$136.52
|
PP = $128.78
|
|
MB = $135.22
|
Most Recent Note - 4/4/2023 8:30:51 PM
G - Pulled back today with above-average volume, action indicative of distributional pressure. Consolidating well above its 50 DMA line and recent low defining important support to watch. Fundamentals remain strong. See the latest FSU analysis for more details and a new annotated graph.
>>> FEATURED STOCK ARTICLE : Pullback With Higher Volume While Consolidating - 4/4/2023 |
View all notes |
Set NEW NOTE alert |
Company Profile |
SEC
News |
Chart |
Request a new note
C
A
S
I |
Symbol/Exchange
Company Name
Industry Group |
PRICE |
CHANGE
(%Change) |
Day High |
Volume
(% DAV)
(% 50 day avg vol) |
52 Wk Hi
% From Hi |
Featured
Date |
Price
Featured |
Pivot Featured |
|
Max Buy |
KOF
-
NYSE
Coca-Cola Femsa ADR
FOOD and BEVERAGE - Beverages - Soft Drinks
|
$81.57
|
+0.15
0.18% |
$82.41
|
254,266
137.44% of 50 DAV
50 DAV is 185,000
|
$82.39
-1.00%
|
3/7/2023
|
$76.63
|
PP = $77.11
|
|
MB = $80.97
|
Most Recent Note - 4/3/2023 12:20:41 PM
G - Hitting yet another new all-time high and rising above its "max buy" level with today's 5th consecutive gain backed by above-average volume and its color code is changed to green. On pullbacks, prior highs in the $79-$77 area define initial support to watch above its 50 DMA line ($74.73).
>>> FEATURED STOCK ARTICLE : Gain for Best-Ever Close With Near Average Volume - 3/24/2023 |
View all notes |
Set NEW NOTE alert |
Company Profile |
SEC
News |
Chart |
Request a new note
C
A
S
I |
ANET
-
NYSE
Arista Networks
Computer-Networking
|
$166.74
|
-1.00
-0.60% |
$168.66
|
1,522,913
56.36% of 50 DAV
50 DAV is 2,702,000
|
$171.44
-2.74%
|
3/8/2023
|
$147.59
|
PP = $148.67
|
|
MB = $156.10
|
Most Recent Note - 3/31/2023 5:00:34 PM
G - Posted a solid gain today rebounding near its all-time high. Very extended from any sound base after an impressive spurt of volume-driven gains. Prior highs in the $148-145 area define initial support to watch above its 50 DMA line ($143).
>>> FEATURED STOCK ARTICLE : Pulling Back After Getting Very Extended From Prior Base - 3/28/2023 |
View all notes |
Set NEW NOTE alert |
Company Profile |
SEC
News |
Chart |
Request a new note
C
A
S
I |
CLH
-
NYSE
Clean Harbors
Pollution Control
|
$136.25
|
-4.67
-3.31% |
$141.47
|
277,641
65.33% of 50 DAV
50 DAV is 425,000
|
$144.20
-5.51%
|
3/10/2023
|
$136.89
|
PP = $136.74
|
|
MB = $143.58
|
Most Recent Note - 4/4/2023 8:38:46 PM
Y - Pulled back from its all-time high with lighter volume behind today's loss. Its 50 DMA line ($133.71) and recent low ($129.93 on 3/24/23) define near-term support where violations would raise concerns and trigger technical sell signals. Fundamentals remain strong.
>>> FEATURED STOCK ARTICLE : Finding Support Recently at 50-Day Moving Average Line - 3/29/2023 |
View all notes |
Set NEW NOTE alert |
Company Profile |
SEC
News |
Chart |
Request a new note
C
A
S
I |
|
|
|
THESE ARE NOT BUY RECOMMENDATIONS!
Comments contained in the body of this report are technical
opinions only. The material herein has been obtained
from sources believed to be reliable and accurate, however,
its accuracy and completeness cannot be guaranteed.
This site is not an investment advisor, hence it does
not endorse or recommend any securities or other investments.
Any recommendation contained in this report may not
be suitable for all investors and it is not to be deemed
an offer or solicitation on our part with respect to
the purchase or sale of any securities. All trademarks,
service marks and trade names appearing in this report
are the property of their respective owners, and are
likewise used for identification purposes only.
This report is a service available
only to active Paid Premium Members.
You may opt-out of receiving report notifications
at any time. Questions or comments may be submitted
by writing to Premium Membership Services 665 S.E. 10 Street, Suite 201 Deerfield Beach, FL 33441-5634 or by calling 1-800-965-8307
or 954-785-1121.
|
|
|