You are not logged in.
This means you
CAN ONLY VIEW reports that were published prior to Thursday, April 17, 2025.
You
MUST UPGRADE YOUR MEMBERSHIP if you want to see any current reports.
AFTER MARKET UPDATE - FRIDAY, APRIL 21ST, 2023
Previous After Market Report Next After Market Report >>>
|
|
|
|
DOW |
+22.34 |
33,808.96 |
+0.07% |
|
Volume |
914,261,217 |
+9% |
|
Volume |
4,826,961,200 |
+6% |
|
NASDAQ |
+12.90 |
12,072.46 |
+0.11% |
|
Advancers |
1,314 |
45% |
|
Advancers |
2,056 |
46% |
|
S&P 500 |
+3.73 |
4,133.52 |
+0.09% |
|
Decliners |
1,594 |
55% |
|
Decliners |
2,372 |
54% |
|
Russell 2000 |
+1.81 |
1,791.51 |
+0.10% |
|
52 Wk Highs |
49 |
|
|
52 Wk Highs |
69 |
|
|
S&P 600 |
-3.70 |
1,160.11 |
-0.32% |
|
52 Wk Lows |
38 |
|
|
52 Wk Lows |
202 |
|
|
 |
Major Averages Inched Higher as Leadership Thinned
Kenneth J. Gruneisen - Passed the CAN SLIM® Master's Exam
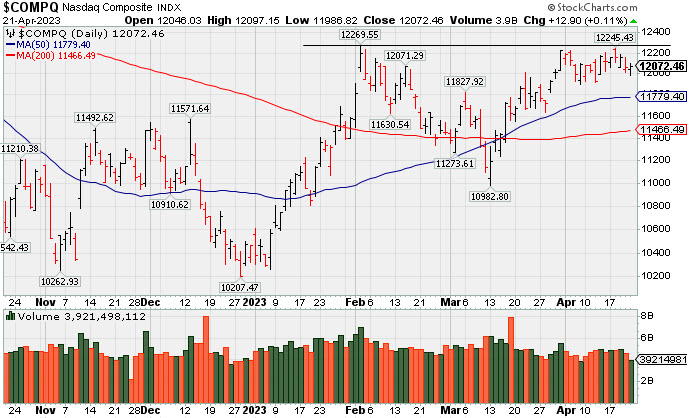
On Friday the Dow Jones Industrial Average, Nasdaq Composite, and S&P 500 Indexes each climbed by about +0.1%. Volume totals reported were higher than the prior session on the NYSE and on the Nasdaq exchange. Breadth was slightly negative as decliners led advancers by a narrow margin on the NYSE and on the Nasdaq exchange. There were 24 high-ranked companies from the Leaders List that hit a new 52-week high and were listed on the BreakOuts Page, versus the total of 35 on the prior session. New 52-week highs outnumbered new 52-week lows on the NYSE but new lows still solidly outnumbered new highs on the Nasdaq exchange.The major indices are in a confirmed uptrend (M criteria). Appropriate new buying efforts may be considered under the fact-based investment system.
PICTURED: The Nasdaq Composite Index is perched -1.6% off its February 2023 high.
Six of 11 sectors finished in positive territory as U.S. equities inched higher on Friday. Investors digested a slew of first-quarter earnings data. While many major companies reported strong results so far, analysts remain concerned that an earnings drop could occur as a potential recession looms on the horizon. For the week, all three major averages notched declines as earnings, economic data, and commentary from Federal Reserve (Fed) officials weighed on sentiment.
On the data front today, a preliminary April reading for the S&P Global US Manufacturing Purchasing Managers’ Index (PMI) unexpectedly climbed to 50.4 from March’s 49.2 reading, marking its first month in expansionary territory (a reading over 50) since October. Meanwhile, the Service PMI notched its highest print in a year, coming in at 53.7 versus March’s 52.6 figure. The report also noted there was an uptick in new orders, signaling demand is strong. The strong data has left some Wall Street analysts concerned over heightened price pressures and stickier inflation.
Treasuries weakened, with the yield on the 10-year note climbing two basis points (0.02%) to 3.56%, while the 30-year bond yield gained three basis points (0.03%) to 3.77%. The yield on the two-year note increased three basis points (0.03%) to 4.18%. In commodities, West Texas Intermediate (WTI) crude climbed 0.6% to $77.76/barrel following strong economic data from the U.S. and abroad. However, the domestic benchmark notched a weekly decline as concerns over the monetary policy and an increase in U.S. gasoline stockpiles weighed on sentiment.
|
 Kenneth J. Gruneisen started out as a licensed stockbroker in August 1987, a couple of months prior to the historic stock market crash that took the Dow Jones Industrial Average down -22.6% in a single day. He has published daily fact-based fundamental and technical analysis on high-ranked stocks online for two decades. Through FACTBASEDINVESTING.COM, Kenneth provides educational articles, news, market commentary, and other information regarding proven investment systems that work in good times and bad.
Comments contained in the body of this report are technical opinions only and are not necessarily those of Gruneisen Growth Corp. The material herein has been obtained from sources believed to be reliable and accurate, however, its accuracy and completeness cannot be guaranteed. Our firm, employees, and customers may effect transactions, including transactions contrary to any recommendation herein, or have positions in the securities mentioned herein or options with respect thereto. Any recommendation contained in this report may not be suitable for all investors and it is not to be deemed an offer or solicitation on our part with respect to the purchase or sale of any securities. |
|
 |
Retail, Biotech, and Networking Indexes Rose
Kenneth J. Gruneisen - Passed the CAN SLIM® Master's Exam
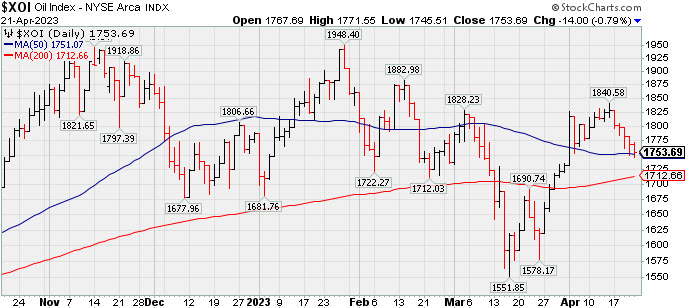
The Bank Index ($BKX -1.50%) and Broker/Dealer Index ($XBD -0.32%) both lost ground while the Retail Index ($RLX +1.66%) posted a solid gain on Friday. The tech sector was mixed as the Semiconductor Index ($SOX -0.82%) lost ground, meanwhile the Biotech Index ($BTK +1.05%) and Networking Index ($NWX +0.41%) both posted gains. Commodity-linked groups had a neagtive bias as the Gold & Silver Index ($XAU -1.27%), Oil Services Index ($OSX -1.76%), and Integrated Oil Index ($XOI -0.79%) each lost ground.
PICTURED: The Broker/Dealer Index ($XBD -0.51%) pulled back near its 50-day moving average (DMA) line. It rebounded impressively from its March low after slumping well below its 200 DMA line.
| Oil Services |
$OSX |
79.53 |
-1.42 |
-1.76% |
-5.17% |
| Integrated Oil |
$XOI |
1,753.69 |
-14.00 |
-0.79% |
-1.88% |
| Semiconductor |
$SOX |
3,021.44 |
-24.84 |
-0.82% |
+19.32% |
| Networking |
$NWX |
776.93 |
+3.14 |
+0.41% |
-0.81% |
| Broker/Dealer |
$XBD |
462.07 |
-1.47 |
-0.32% |
+2.88% |
| Retail |
$RLX |
3,078.76 |
+50.24 |
+1.66% |
+11.79% |
| Gold & Silver |
$XAU |
134.21 |
-1.73 |
-1.27% |
+11.05% |
| Bank |
$BKX |
82.90 |
-1.26 |
-1.50% |
-17.80% |
| Biotech |
$BTK |
5,403.09 |
+56.15 |
+1.05% |
+2.31% |
|
|
|
 |
Consolidating Near 50-Day Moving Average and -10.5% off High
Kenneth J. Gruneisen - Passed the CAN SLIM® Master's Exam
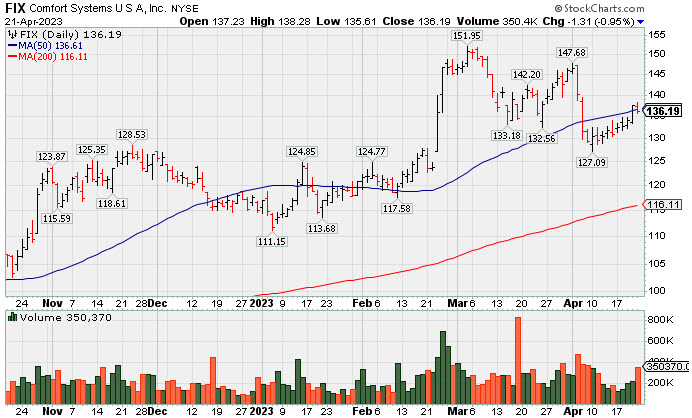
Comfort Systems U S A (FIX -$1.31 or -0.95% to $136.19) is consolidating near its 50-day moving average (DMA) line ($136.69) after quiet gains helped its outlook improve. It has not formed a sound new base, and it faces resistance due to overhead supply up to the $152 level. Fundamentals remain strong.
FIX was highlighted in yellow in the 2/23/23 mid-day report (read here) with a pivot point cited based on its 11/23/22 high plus 10 cents. It broke out hitting a new 52-week high (N criteria) with volume +131% above average behind the gain, triggering a technical buy signal while rising from an orderly 3-month base. It was last shown in greater detail on 4/04/23 with an annotated graph under the headline, "Pullback With Higher Volume While Consolidating".
Bullish action came after it reported earnings +48% on +31% sales revenues for the Dec '22 quarter versus the year ago period, its 4th strong quarter above the +25% minimum guideline (C criteria). Annual earning history has been strong and steady. It has a 97 Earnings Per Share Rating.
It hails from the Building - A/C & Heating Products group which is currently ranked 14th on the 197 Industry Groups list. It has a small supply of only 35.7 million shares outstanding (S criteria) which can contribute to greater price volatility in the event of institutional buying or selling. The number of top-rated funds that own its shares rose from 487 in Jun '22 to 569 in Mar '23, a reassuring sign regarding the I criteria. Its current Up/Down Volume Ratio is 1.4, an unbiased indication its shares have been under accumulation over the past 50 days.
|
|
|
Color Codes Explained :
Y - Better candidates highlighted by our
staff of experts.
G - Previously featured
in past reports as yellow but may no longer be buyable under the
guidelines.
***Last / Change / Volume data in this table is the closing quote data***
Symbol/Exchange
Company Name
Industry Group |
PRICE |
CHANGE
(%Change) |
Day High |
Volume
(% DAV)
(% 50 day avg vol) |
52 Wk Hi
% From Hi |
Featured
Date |
Price
Featured |
Pivot Featured |
|
Max Buy |
 GPK
-
NYSE
GPK
-
NYSE
Graphic Packaging
CONSUMER NON-DURABLES - Packaging and Containers
|
$24.42
|
-0.26
-1.05% |
$24.75
|
2,562,809
86.20% of 50 DAV
50 DAV is 2,973,000
|
$25.62
-4.68%
|
10/25/2022
|
$22.75
|
PP = $24.17
|
|
MB = $25.38
|
 Most Recent Note - 4/21/2023 5:29:35 PM
Y - Pulled back for a 3rd consecutive loss today testing its 50 DMA line ($24.29) which defines important near-term support to watch. It remains perched just -4.7% below its all-time high. Recent gains lacked great volume conviction. I
>>> FEATURED STOCK ARTICLE : Quietly Consolidating Just Below "Max Buy" Level - 4/10/2023 |
View all notes |
Set NEW NOTE alert |
Company Profile |
SEC
News |
Chart |
Request a new note
C
A
S
I |
STRL
-
NASDAQ
Sterling Infrastructure
MATERIALS and; CONSTRUCTION - Heavy Construction
|
$37.10
|
-0.69
-1.83% |
$37.75
|
156,478
63.87% of 50 DAV
50 DAV is 245,000
|
$42.00
-11.67%
|
12/14/2022
|
$32.41
|
PP = $33.72
|
|
MB = $35.41
|
Most Recent Note - 4/21/2023 5:32:05 PM
G - Met resistance at its 50 DMA line this week following a noted streak of 6 consecutive gains with below-average volume. A rebound above the 50 DMA line ($37.76) is needed for its outlook to improve.
>>> FEATURED STOCK ARTICLE : Volume-Driven 50-Day Moving Average Violation Triggered Sell Signal - 4/5/2023 |
View all notes |
Set NEW NOTE alert |
Company Profile |
SEC
News |
Chart |
Request a new note
C
A
S
I |
PERI
-
NASDAQ
Perion Network
Comml Svcs-Advertising
|
$38.38
|
+0.38
1.00% |
$38.78
|
447,695
57.18% of 50 DAV
50 DAV is 783,000
|
$42.75
-10.22%
|
1/25/2023
|
$31.79
|
PP = $33.19
|
|
MB = $34.85
|
Most Recent Note - 4/20/2023 4:48:55 PM
G - Suffered a 3rd consecutive loss today with ever-increasing volume, abruptly retreating from its all-time high. Its 50 DMA line ($36.33) defines important near-term support to watch. See the latest FSU analysis for more details and a new annotated graph.
>>> FEATURED STOCK ARTICLE : Perion Pulls Back Toward 50-Day Moving Average Line - 4/20/2023 |
View all notes |
Set NEW NOTE alert |
Company Profile |
SEC
News |
Chart |
Request a new note
C
A
S
I |
ALGM
-
NASDAQ
Allegro MicroSystems
Elec-Semiconductor Mfg
|
$41.66
|
-0.21
-0.50% |
$42.11
|
1,618,967
116.72% of 50 DAV
50 DAV is 1,387,000
|
$48.72
-14.49%
|
1/31/2023
|
$37.80
|
PP = $38.38
|
|
MB = $40.30
|
Most Recent Note - 4/20/2023 12:16:04 PM
G - Gapped down today for a more damaging volume-driven loss undercutting prior lows and raising greater concerns after the 50 DMA violation on 4/17/23 triggered a noted technical sell signal. Only a prompt rebound above the 50 DMA line ($44.90) would help its outlook improve.
>>> FEATURED STOCK ARTICLE : Consolidating Near 50 DMA Line After Recent Rally - 4/11/2023 |
View all notes |
Set NEW NOTE alert |
Company Profile |
SEC
News |
Chart |
Request a new note
C
A
S
I |
FIX
-
NYSE
Comfort Systems USA
MATERIALS and CONSTRUCTION - General Contractors
|
$136.19
|
-1.31
-0.95% |
$138.28
|
350,375
122.51% of 50 DAV
50 DAV is 286,000
|
$152.13
-10.48%
|
2/23/2023
|
$136.52
|
PP = $128.78
|
|
MB = $135.22
|
Most Recent Note - 4/21/2023 5:27:20 PM
Y - Pulled back today with above-average volume and closed just below its 50 DMA line ($136.68) after recent gains helped its outlook improve. Fundamentals remain strong. It has not formed a sound base and faces resistance due to overhead supply up to the $152 level. See the latest FSU analysis for more details and a new annotated graph.
>>> FEATURED STOCK ARTICLE : Consolidating Near 50-Day Moving Average and -10.5% off High - 4/21/2023 |
View all notes |
Set NEW NOTE alert |
Company Profile |
SEC
News |
Chart |
Request a new note
C
A
S
I |
Symbol/Exchange
Company Name
Industry Group |
PRICE |
CHANGE
(%Change) |
Day High |
Volume
(% DAV)
(% 50 day avg vol) |
52 Wk Hi
% From Hi |
Featured
Date |
Price
Featured |
Pivot Featured |
|
Max Buy |
KOF
-
NYSE
Coca-Cola Femsa ADR
FOOD and BEVERAGE - Beverages - Soft Drinks
|
$83.06
|
-0.57
-0.68% |
$84.02
|
144,774
78.68% of 50 DAV
50 DAV is 184,000
|
$84.68
-1.91%
|
3/7/2023
|
$76.63
|
PP = $77.11
|
|
MB = $80.97
|
Most Recent Note - 4/21/2023 5:31:01 PM
G - Still stubbornly holding its ground near its all-time high following a noted streak of 12 consecutive gains. Extended from the prior base. On pullbacks, prior highs in the $79-$77 area define initial support to watch along with its 50 DMA line ($77.05).
>>> FEATURED STOCK ARTICLE : Streak of 11 Straight Gains into New High Territory - 4/12/2023 |
View all notes |
Set NEW NOTE alert |
Company Profile |
SEC
News |
Chart |
Request a new note
C
A
S
I |
ANET
-
NYSE
Arista Networks
Computer-Networking
|
$155.87
|
+0.48
0.31% |
$156.41
|
1,567,690
60.60% of 50 DAV
50 DAV is 2,587,000
|
$171.44
-9.08%
|
3/8/2023
|
$147.59
|
PP = $148.67
|
|
MB = $156.10
|
Most Recent Note - 4/19/2023 5:29:39 PM
G - Gapped down and fell with higher volume today for a 4th consecutive loss. Its 50 DMA line ($152) and prior highs in the $148-145 area define important support to watch.
>>> FEATURED STOCK ARTICLE : Near High With Volume Cooling Following Volume-Driven Gains - 4/17/2023 |
View all notes |
Set NEW NOTE alert |
Company Profile |
SEC
News |
Chart |
Request a new note
C
A
S
I |
CLH
-
NYSE
Clean Harbors
Pollution Control
|
$143.92
|
-0.14
-0.10% |
$145.68
|
343,939
79.80% of 50 DAV
50 DAV is 431,000
|
$146.05
-1.46%
|
3/10/2023
|
$136.89
|
PP = $136.74
|
|
MB = $143.58
|
Most Recent Note - 4/19/2023 5:10:39 PM
G - Posted a small gain today with near-average volume for a best-ever close and its color code is changed to green after wedging up above its "max buy" level. Found prompt support near its 50 DMA line ($135.84) during recent consolidations. Below that important short-term average, the recent low ($129.93 on 3/24/23) defines the next important support where a violation would raise concerns and trigger a more worrisome technical sell signal. Fundamentals remain strong. See the latest FSU analysis for more details and a new annotated graph.
>>> FEATURED STOCK ARTICLE : Wedged to a New High Close Above "Max Buy" Level - 4/19/2023 |
View all notes |
Set NEW NOTE alert |
Company Profile |
SEC
News |
Chart |
Request a new note
C
A
S
I |
MTRN
-
NYSE
Materion
METALS and MINING - Industrial Metals and Minerals
|
$110.25
|
-2.86
-2.53% |
$112.91
|
109,445
86.18% of 50 DAV
50 DAV is 127,000
|
$119.75
-7.93%
|
4/18/2023
|
$114.52
|
PP = $118.30
|
|
MB = $124.22
|
Most Recent Note - 4/20/2023 4:17:25 PM
Y - Still sputtering after highlighted in yellow with pivot point cited based on its 3/03/23 high plus 10 cents in the 4/18/23 mid-day report. Hit a new all-time high with an early gain, but encountered distributional pressure. Subsequent gains and a strong close above the pivot point backed by at least +40% above average volume may trigger a proper technical buy signal. Reported earnings +33% on +9% sales revenues for the Dec '22 quarter versus the year-ago period. Three of the past 4 quarterly comparisons were above the +25% minimum earnings guideline (C criteria). A downturn in its FY '20 annual earnings history (A criteria) has been followed by much stronger '21 and '22 results.
>>> FEATURED STOCK ARTICLE : Encountered Distributional Pressure When Poised for Breakout - 4/18/2023 |
View all notes |
Set NEW NOTE alert |
Company Profile |
SEC
News |
Chart |
Request a new note
C
A
S
I |
|
|
|
THESE ARE NOT BUY RECOMMENDATIONS!
Comments contained in the body of this report are technical
opinions only. The material herein has been obtained
from sources believed to be reliable and accurate, however,
its accuracy and completeness cannot be guaranteed.
This site is not an investment advisor, hence it does
not endorse or recommend any securities or other investments.
Any recommendation contained in this report may not
be suitable for all investors and it is not to be deemed
an offer or solicitation on our part with respect to
the purchase or sale of any securities. All trademarks,
service marks and trade names appearing in this report
are the property of their respective owners, and are
likewise used for identification purposes only.
This report is a service available
only to active Paid Premium Members.
You may opt-out of receiving report notifications
at any time. Questions or comments may be submitted
by writing to Premium Membership Services 665 S.E. 10 Street, Suite 201 Deerfield Beach, FL 33441-5634 or by calling 1-800-965-8307
or 954-785-1121.
|
|
|