You are not logged in.
This means you
CAN ONLY VIEW reports that were published prior to Thursday, April 17, 2025.
You
MUST UPGRADE YOUR MEMBERSHIP if you want to see any current reports.
AFTER MARKET UPDATE - FRIDAY, MARCH 31ST, 2023
Previous After Market Report Next After Market Report >>>
|
|
|
|
DOW |
+415.12 |
33,274.15 |
+1.26% |
|
Volume |
1,186,430,551 |
+48% |
|
Volume |
5,431,406,500 |
+16% |
|
NASDAQ |
+209.70 |
12,223.17 |
+1.75% |
|
Advancers |
2,367 |
82% |
|
Advancers |
3,143 |
71% |
|
S&P 500 |
+58.48 |
4,109.31 |
+1.44% |
|
Decliners |
506 |
18% |
|
Decliners |
1,305 |
29% |
|
Russell 2000 |
+34.10 |
1,802.48 |
+1.93% |
|
52 Wk Highs |
65 |
|
|
52 Wk Highs |
95 |
|
|
S&P 600 |
+22.51 |
1,182.07 |
+1.94% |
|
52 Wk Lows |
19 |
|
|
52 Wk Lows |
142 |
|
|
Wednesday's gains with higher volume and greater leadership marked a follow-through day confirming a new uptrend. New buying efforts may be made based on the (M criteria) of the fact-based investment system. Disciplined investors know to only buy stocks meeting all key criteria.
|
 |
Major Averages Further Confirm Rally With More Convincing Gains
Kenneth J. Gruneisen - Passed the CAN SLIM® Master's Exam
The Dow added 415 points (1.3%) today and climbed 1.9% for the month, while the Nasdaq Composite gained 1.7% today and notched a 6.7% monthly gain. The S&P 500 advanced 1.4% and climbed 3.5% for the month. For the first quarter, all three major averages finished in positive territory. Volume totals reported were higher than the prior session on the NYSE and on the Nasdaq exchange, indicative of increasing buying demand from the institutional crowd. Breadth was positive as advancers led decliners by more than a 4-1 margin on the NYSE and by a 5-2 margin on the Nasdaq exchange. There was a decisive increase in leadership as there were 49 high-ranked companies from the Leaders List that hit a new 52-week high and were listed on the BreakOuts Page, versus the total of 17 on the prior session. There was an increase in new 52-week highs as they outnumbered new 52-week lows on the NYSE, and new highs also increased on the Nasdaq exchange but new 52-week lows still outnumbered them. The major indices are in a new confirmed uptrend (M criteria). Appropriate new buying efforts may be considered under the fact-based investment system.
PICTURED: The Dow Jones Industrial Average posted 3rd consecutive gain backed by higher volume as it closed above its 50-day moving average (DMA) line, a noteworthy technical improvement.
U.S. equities finished higher Friday as investors digested the latest inflation data and what it may mean for the Federal Reserve’s (Fed) monetary policy path. On the data front, the Personal Consumption Expenditures (PCE) Deflator, which is the Fed’s preferred proxy for inflation, rose 0.3% month-over-month and 5.0% year-over-year in February, with both prints easing from January. Meanwhile, the core PCE deflator, which excludes the more volatile food and energy prices, came in at 0.3% month-over-month and 4.6% year-over-year. While the prints remain well above the Fed’s 2%, the data has bolstered hopes that inflation is coming down and the Fed may be able to end its rate hiking cycle.
Treasuries strengthened, with the yield on the 10-year note down seven basis points (0.07%) to 3.48%, while the 30-year bond yield fell eight basis points (0.08%) to 3.66%. The yield on the two-year note shed eight basis points (0.08%) to 4.03%. In commodities, West Texas Intermediate (WTI) crude climbed 1.6% to $75.55/barrel amid tight supply conditions. Despite this week’s rebound in prices, the domestic benchmark ended in negative territory for the month.
|
 Kenneth J. Gruneisen started out as a licensed stockbroker in August 1987, a couple of months prior to the historic stock market crash that took the Dow Jones Industrial Average down -22.6% in a single day. He has published daily fact-based fundamental and technical analysis on high-ranked stocks online for two decades. Through FACTBASEDINVESTING.COM, Kenneth provides educational articles, news, market commentary, and other information regarding proven investment systems that work in good times and bad.
Comments contained in the body of this report are technical opinions only and are not necessarily those of Gruneisen Growth Corp. The material herein has been obtained from sources believed to be reliable and accurate, however, its accuracy and completeness cannot be guaranteed. Our firm, employees, and customers may effect transactions, including transactions contrary to any recommendation herein, or have positions in the securities mentioned herein or options with respect thereto. Any recommendation contained in this report may not be suitable for all investors and it is not to be deemed an offer or solicitation on our part with respect to the purchase or sale of any securities. |
|
 |
Retail, Financial, Tech, and Energy-Linked Groups Rose
Kenneth J. Gruneisen - Passed the CAN SLIM® Master's Exam
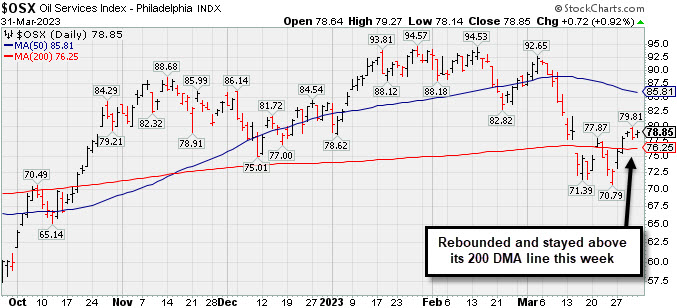
The Retail Index ($RLX +1.97%) posted an influential gain while the Broker/Dealer Index ($XBD +1.31%) and Bank Index ($BKX +0.88%) both rose and gave the major averages a further boost. The tech sector had a positive bias as the Networking Index ($NWX +2.37%) and Biotech Index ($BTK +1.60%) both outpaced the Semiconductor Index ($SOX +0.70%). Commodity-linked groups were mixed as the Oil Services Index ($OSX +0.92%) and Integrated Oil Index ($XOI +0.58%) both posted small gains, meanwhile the Gold & Silver Index ($XAU -0.43%) edged lower.
PICTURED: The Oil Services Index ($OSX +0.92%) rebounded and stayed above its 200-day moving average (DMA) line this week.
| Oil Services |
$OSX |
78.85 |
+0.72 |
+0.92% |
-5.97% |
| Integrated Oil |
$XOI |
1,731.81 |
+10.02 |
+0.58% |
-3.10% |
| Semiconductor |
$SOX |
3,230.86 |
+22.60 |
+0.70% |
+27.60% |
| Networking |
$NWX |
851.62 |
+19.72 |
+2.37% |
+8.72% |
| Broker/Dealer |
$XBD |
461.58 |
+5.95 |
+1.31% |
+2.77% |
| Retail |
$RLX |
2,991.14 |
+57.86 |
+1.97% |
+8.61% |
| Gold & Silver |
$XAU |
131.44 |
-0.57 |
-0.43% |
+8.76% |
| Bank |
$BKX |
82.04 |
+0.72 |
+0.88% |
-18.65% |
| Biotech |
$BTK |
5,307.71 |
+83.56 |
+1.60% |
+0.50% |
|
|
|
 |
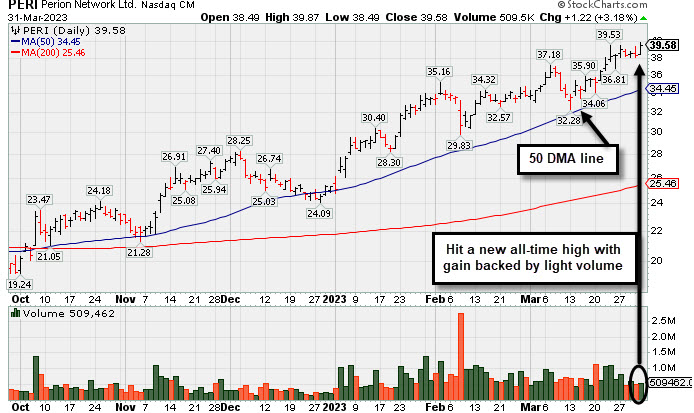
Hit Another New High With Gain Backed by Light Volume
Kenneth J. Gruneisen - Passed the CAN SLIM® Master's Exam
Perion Networks Ltd (PERI +$1.22 or +3.18% to $39.58) quiety hit a new all-time high. It found support when recently consolidating above its 50-day moving average (DMA) line ($34.45). The 50 DMA line and prior high ($33) define important near-term support where violations would raise concerns and trigger technical sell signals.
PERI has a 98 Earnings Per Share Rating. It reported Dec '22 quarterly earnings +45% on +33% sales revenues versus the year ago period and its prior quarterly earnings history has been above the +25% minimum (C criteria). Its annual earnings (A criteria) history has been improving steadily after a downturn from FY '15-18. It hails from the Commercial Services-Advertising group which is currently ranked 61st on the 197 Industry Groups list.
There are 45.8 million shares outstanding which can contribute to greater price volatility in the event of institutional buying or selling. The number of top-rated funds owning its shares rose from 113 in Mar '22 to 143 in Dec '22, a reassuring sign concerning the I criteria. Its current Up/Down Volume Ratio of 1.7 is an unbiased indication its shares have been under accumulation over the past 50 days.
|
|
|
Color Codes Explained :
Y - Better candidates highlighted by our
staff of experts.
G - Previously featured
in past reports as yellow but may no longer be buyable under the
guidelines.
***Last / Change / Volume data in this table is the closing quote data***
Symbol/Exchange
Company Name
Industry Group |
PRICE |
CHANGE
(%Change) |
Day High |
Volume
(% DAV)
(% 50 day avg vol) |
52 Wk Hi
% From Hi |
Featured
Date |
Price
Featured |
Pivot Featured |
|
Max Buy |
 GPK
-
NYSE
GPK
-
NYSE
Graphic Packaging
CONSUMER NON-DURABLES - Packaging and Containers
|
$25.49
|
+0.23
0.91% |
$25.56
|
2,399,029
71.93% of 50 DAV
50 DAV is 3,335,000
|
$25.45
0.16%
|
10/25/2022
|
$22.75
|
PP = $24.17
|
|
MB = $25.38
|
Most Recent Note - 3/30/2023 4:31:20 PM
Y - Posted a 6th consecutive gain today for a new all-time high with lighter volume, wedging up near its "max buy" level with gains lacking great volume conviction. Its 50 DMA line ($23.76) and recent low ($22.99 on 3/16/23) define important near-term support to watch.
>>> FEATURED STOCK ARTICLE : Found Encouraging Support Near 50-Day Moving Average Line - 3/21/2023 |
View all notes |
Set NEW NOTE alert |
Company Profile |
SEC
News |
Chart |
Request a new note
C
A
S
I |
STRL
-
NASDAQ
Sterling Infrastructure
MATERIALS and; CONSTRUCTION - Heavy Construction
|
$37.88
|
+0.30
0.80% |
$38.00
|
301,081
107.15% of 50 DAV
50 DAV is 281,000
|
$42.00
-9.81%
|
12/14/2022
|
$32.41
|
PP = $33.72
|
|
MB = $35.41
|
 Most Recent Note - 3/31/2023 5:13:47 PM
G - Posted a small gain today. Recently testing its 50 DMA line ($37.44) which defines important near-term support to watch above recent lows in the mid-$36 area.
>>> FEATURED STOCK ARTICLE : Posting Quiet Gains Just Above 50-Day Moving Average Line - 3/20/2023 |
View all notes |
Set NEW NOTE alert |
Company Profile |
SEC
News |
Chart |
Request a new note
C
A
S
I |
PERI
-
NASDAQ
Perion Network
Comml Svcs-Advertising
|
$39.58
|
+1.22
3.18% |
$39.87
|
509,462
64.98% of 50 DAV
50 DAV is 784,000
|
$39.54
0.10%
|
1/25/2023
|
$31.79
|
PP = $33.19
|
|
MB = $34.85
|
Most Recent Note - 3/31/2023 5:11:32 PM
G - Posted a quiet gain for another new all-time high. Its 50 DMA line ($34.45) defines important near-term support. See the latest FSU analysis for more details and a new annotated graph.
>>> FEATURED STOCK ARTICLE : Hit Another New High With Gain Backed by Light Volume - 3/31/2023 |
View all notes |
Set NEW NOTE alert |
Company Profile |
SEC
News |
Chart |
Request a new note
C
A
S
I |
ALGM
-
NASDAQ
Allegro MicroSystems
Elec-Semiconductor Mfg
|
$47.99
|
+0.61
1.29% |
$48.15
|
964,620
57.11% of 50 DAV
50 DAV is 1,689,000
|
$48.30
-0.64%
|
1/31/2023
|
$37.80
|
PP = $38.38
|
|
MB = $40.30
|
Most Recent Note - 3/30/2023 4:03:56 PM
G - Challenged the prior high today as it posted a 2nd consecutive gain with below-average volume. It is extended from the previously noted base. Its 50 DMA line ($42.52) and recent low ($41.30 on 3/18/23) define important near-term support to watch on pullbacks.
>>> FEATURED STOCK ARTICLE : Extended From Prior Base and Perched Near All-Time High - 3/22/2023 |
View all notes |
Set NEW NOTE alert |
Company Profile |
SEC
News |
Chart |
Request a new note
C
A
S
I |
FIX
-
NYSE
Comfort Systems USA
MATERIALS and CONSTRUCTION - General Contractors
|
$145.96
|
+3.43
2.41% |
$146.45
|
282,588
109.11% of 50 DAV
50 DAV is 259,000
|
$152.13
-4.06%
|
2/23/2023
|
$136.52
|
PP = $128.78
|
|
MB = $135.22
|
Most Recent Note - 3/30/2023 4:29:07 PM
G - Pulled back today with heavier volume breaking a streak of 3 consecutive small gains. Consolidating well above its 50 DMA line ($132.15) and the prior high in the $128 area defining important support to watch. Fundamentals remain strong.
>>> FEATURED STOCK ARTICLE : Consolidating Above Support at Prior High and 50-Day Moving Average - 3/16/2023 |
View all notes |
Set NEW NOTE alert |
Company Profile |
SEC
News |
Chart |
Request a new note
C
A
S
I |
Symbol/Exchange
Company Name
Industry Group |
PRICE |
CHANGE
(%Change) |
Day High |
Volume
(% DAV)
(% 50 day avg vol) |
52 Wk Hi
% From Hi |
Featured
Date |
Price
Featured |
Pivot Featured |
|
Max Buy |
KOF
-
NYSE
Coca-Cola Femsa ADR
FOOD and BEVERAGE - Beverages - Soft Drinks
|
$80.47
|
+0.44
0.55% |
$81.86
|
292,262
165.12% of 50 DAV
50 DAV is 177,000
|
$81.10
-0.78%
|
3/7/2023
|
$76.63
|
PP = $77.11
|
|
MB = $80.97
|
Most Recent Note - 3/31/2023 12:05:49 PM
Y - Hitting yet another new all-time high and challenging its "max buy" level with today's 4th consecutive gain backed by above-average volume. Gains above the pivot point must be backed by at least +40% above average volume to trigger a proper technical buy signal. It wedged higher with gains missing that volume threshold since highlighted in yellow with pivot point cited based on its 1/24/23 high plus 10 cents.
>>> FEATURED STOCK ARTICLE : Gain for Best-Ever Close With Near Average Volume - 3/24/2023 |
View all notes |
Set NEW NOTE alert |
Company Profile |
SEC
News |
Chart |
Request a new note
C
A
S
I |
ANET
-
NYSE
Arista Networks
Computer-Networking
|
$167.86
|
+5.37
3.30% |
$168.06
|
2,837,253
106.90% of 50 DAV
50 DAV is 2,654,000
|
$171.44
-2.09%
|
3/8/2023
|
$147.59
|
PP = $148.67
|
|
MB = $156.10
|
Most Recent Note - 3/31/2023 5:00:34 PM
G - Posted a solid gain today rebounding near its all-time high. Very extended from any sound base after an impressive spurt of volume-driven gains. Prior highs in the $148-145 area define initial support to watch above its 50 DMA line ($143).
>>> FEATURED STOCK ARTICLE : Pulling Back After Getting Very Extended From Prior Base - 3/28/2023 |
View all notes |
Set NEW NOTE alert |
Company Profile |
SEC
News |
Chart |
Request a new note
C
A
S
I |
CLH
-
NYSE
Clean Harbors
Pollution Control
|
$142.56
|
+3.80
2.74% |
$144.20
|
671,785
162.27% of 50 DAV
50 DAV is 414,000
|
$140.69
1.33%
|
3/10/2023
|
$136.89
|
PP = $136.74
|
|
MB = $143.58
|
Most Recent Note - 3/31/2023 11:56:10 AM
Y - Hitting a new all-time high and challenging its "max buy" level with today's 5th consecutive gain. Its 50 DMA line ($133.24) and recent low ($129.93 on 3/24/23) define near-term support where violations would raise concerns and trigger technical sell signals. Fundamentals remain strong.
>>> FEATURED STOCK ARTICLE : Finding Support Recently at 50-Day Moving Average Line - 3/29/2023 |
View all notes |
Set NEW NOTE alert |
Company Profile |
SEC
News |
Chart |
Request a new note
C
A
S
I |
|
|
|
THESE ARE NOT BUY RECOMMENDATIONS!
Comments contained in the body of this report are technical
opinions only. The material herein has been obtained
from sources believed to be reliable and accurate, however,
its accuracy and completeness cannot be guaranteed.
This site is not an investment advisor, hence it does
not endorse or recommend any securities or other investments.
Any recommendation contained in this report may not
be suitable for all investors and it is not to be deemed
an offer or solicitation on our part with respect to
the purchase or sale of any securities. All trademarks,
service marks and trade names appearing in this report
are the property of their respective owners, and are
likewise used for identification purposes only.
This report is a service available
only to active Paid Premium Members.
You may opt-out of receiving report notifications
at any time. Questions or comments may be submitted
by writing to Premium Membership Services 665 S.E. 10 Street, Suite 201 Deerfield Beach, FL 33441-5634 or by calling 1-800-965-8307
or 954-785-1121.
|
|
|