You are not logged in.
This means you
CAN ONLY VIEW reports that were published prior to Tuesday, April 8, 2025.
You
MUST UPGRADE YOUR MEMBERSHIP if you want to see any current reports.
AFTER MARKET UPDATE - FRIDAY, APRIL 9TH, 2021
Previous After Market Report Next After Market Report >>>
|
|
|
|
DOW |
+297.03 |
33,800.60 |
+0.89% |
|
Volume |
789,309,163 |
-7% |
|
Volume |
3,881,685,800 |
-6% |
|
NASDAQ |
+70.88 |
13,900.19 |
+0.51% |
|
Advancers |
1,792 |
55% |
|
Advancers |
1,872 |
45% |
|
S&P 500 |
+31.63 |
4,128.80 |
+0.77% |
|
Decliners |
1,459 |
45% |
|
Decliners |
2,252 |
55% |
|
Russell 2000 |
+0.88 |
2,243.47 |
+0.04% |
|
52 Wk Highs |
267 |
|
|
52 Wk Highs |
189 |
|
|
S&P 600 |
+2.43 |
1,334.56 |
+0.18% |
|
52 Wk Lows |
15 |
|
|
52 Wk Lows |
42 |
|
|
 |
Major Indices Rallied on Lighter Volume to End the Week Higher
Kenneth J. Gruneisen - Passed the CAN SLIM® Master's Exam
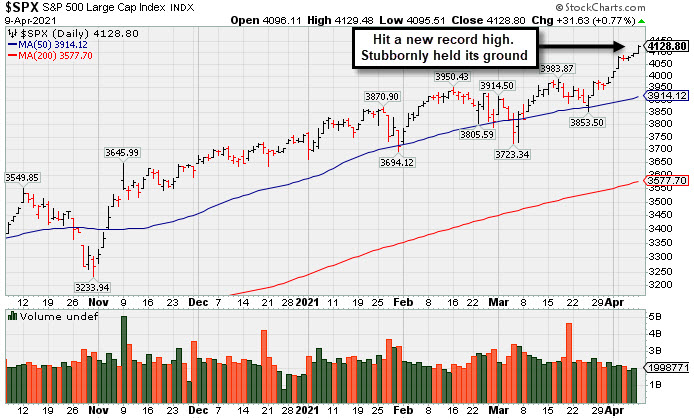
Gains accelerated in the final hour of trading, sending the Dow and S&P 500 to fresh record closing levels. The 30-stock index jumped 297 points, to cap a 2% weekly advance. The S&P 500 climbed 0.8%, clinching its third consecutive weekly gain (+2.7%), it’s longest such winning stretch since October. The Nasdaq Composite reversed early session losses, ending 0.5% higher. The tech-heavy index outperformed this week with a 3.1% rally, as tech and other high growth-oriented stocks extended their recent rebounded. The volume totals were lighter than the prior session on the NYSE and on the Nasdaq exchange. Advancers led decliners by a 6-5 margin on the NYSE but decliners led advancers by an 11-9 margin on the Nasdaq exchange. Leadership improved slightly as there were 34 high-ranked companies from the Leaders List that hit new 52-week highs and were listed on the BreakOuts Page, versus the total of 26 on the prior session. New 52-week highs totals expanded and solidly outnumbered new 52-week lows on the NYSE on the Nasdaq exchange. The major indices (M criteria) are in a confirmed uptrend. Investors are reminded to always make buying and selling decisions on case-by-case basis under the strict criteria and rules of the fact-based investment system.
PICTURED: The S&P 500 Index hit a new record high after stubbornly holding its ground
U.S. stocks finished firmly higher during a slow session on Friday, with trading volume more than 25% below the 30-day average. Notably, the CBOE Volatility Index, commonly referred to as Wall Street's “fear gauge,” closed at the lowest level since February 2020.
Investors assessed a measure of inflation that topped expectations. The producer price index (PPI) jumped 1% in March, doubling consensus estimates. The year-over-year reading surged 4.2%, the largest annual gain since September 2011 and followed a 2.8% uptick in February. Treasuries weakened, with the yield on the benchmark 10-year note rising four basis points to 1.66%, but ending the week six basis points lower.
Eight of 11 S&P 500 sectors finished in positive territory, with Health Care stocks pacing the gains. Energy lagged, as WTI crude extended its weekly decline to 3.4%. In earnings, Levi Strauss (LEVI +2.60%) rose after providing upbeat forward guidance following a top and bottom line beat. Meanwhile, WD-40 (WDFC -9.51%) fell after falling short of Wall Street's earnings and revenue expectations. Elsewhere, Honeywell (HON +3.36%) rose after being the subject of an analyst upgrade. |
 Kenneth J. Gruneisen started out as a licensed stockbroker in August 1987, a couple of months prior to the historic stock market crash that took the Dow Jones Industrial Average down -22.6% in a single day. He has published daily fact-based fundamental and technical analysis on high-ranked stocks online for two decades. Through FACTBASEDINVESTING.COM, Kenneth provides educational articles, news, market commentary, and other information regarding proven investment systems that work in good times and bad.
Comments contained in the body of this report are technical opinions only and are not necessarily those of Gruneisen Growth Corp. The material herein has been obtained from sources believed to be reliable and accurate, however, its accuracy and completeness cannot be guaranteed. Our firm, employees, and customers may effect transactions, including transactions contrary to any recommendation herein, or have positions in the securities mentioned herein or options with respect thereto. Any recommendation contained in this report may not be suitable for all investors and it is not to be deemed an offer or solicitation on our part with respect to the purchase or sale of any securities. |
|
 |
Retail and Financial Indexes Underpinned Market Rally
Kenneth J. Gruneisen - Passed the CAN SLIM® Master's Exam
Strength in the Retail Index ($RLX +1.83%) had a positive influence on the major averages, as did the financials, with the Broker/Dealer Index ($XBD +1.05%) and Bank Index ($BKX +1.08%) each posting solid gains. The tech sector was mixed and less decisive as the Networking Index ($NWX +0.53%) notched a modest gain but the Semiconductor Index ($SOX -0.20%) and Biotech Index ($BTK -0.49%) both edged lower. Commodity-linked groups had a negative bias as the Oil Services Index ($OSX -2.15%) outpaced the Integrated Oil Index ($XOI -0.51%) and Gold & Silver Index ($XAU -0.34%) to the downside. PICTURED: The Semiconductor Index ($SOX -0.20%) is hovering near its record high.
| Oil Services |
$OSX |
51.82 |
-1.14 |
-2.15% |
+16.89% |
| Integrated Oil |
$XOI |
997.11 |
-5.09 |
-0.51% |
+25.82% |
| Semiconductor |
$SOX |
3,294.53 |
-6.73 |
-0.20% |
+17.85% |
| Networking |
$NWX |
812.04 |
+4.30 |
+0.53% |
+13.24% |
| Broker/Dealer |
$XBD |
457.93 |
+4.76 |
+1.05% |
+21.27% |
| Retail |
$RLX |
3,899.87 |
+70.22 |
+1.83% |
+9.45% |
| Gold & Silver |
$XAU |
143.76 |
-0.50 |
-0.34% |
-0.30% |
| Bank |
$BKX |
123.24 |
+1.32 |
+1.08% |
+25.87% |
| Biotech |
$BTK |
5,427.10 |
-26.76 |
-0.49% |
-5.44% |
|
|
|
 |
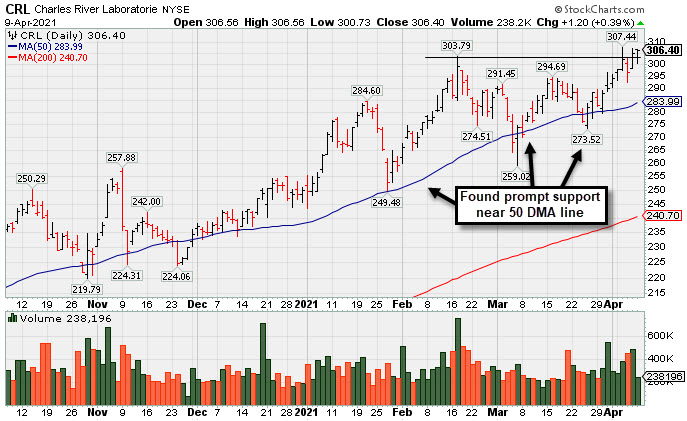
Perched at Record High After Rally From 50-Day Moving Average
Kenneth J. Gruneisen - Passed the CAN SLIM® Master's Exam
Charles River Labs Intl (CRL +$1.20 or +0.39% to $306.40) posted a quiet gain for a best-ever close, its 7th gain in 8 sessions. It hit new all-time highs with recent volume-driven gains. Prompt support was found near the 50-day moving average (DMA) line ($284) throughout its ongoing ascent. Any damaging losses below the 50 DMA line and prior lows would raise concerns and trigger technical sell signals. Its Relative Strength Rating is 77, below the 80+ minimum guideline for buy candidates.
It still has a 92 Earnings Per Share Rating, but reported Dec '20 quarterly earnings +19% on +14% sales revenues versus the year ago period, below the +25% minimum earnings guideline (C criteria), raising fundamental concerns. The Medical - Research Equipment/Services industry group currently has a mediocre C- (35) Group Relative Strength Rating (L criteria). CRL traded up as much as +59.6% since it was highlighted in yellow with pivot point cited based on its 6/03/20 high plus 10 cents in the 7/15/20 mid-day report (read here). It was last shown in this FSU section on 3/16/21 with an annotated graph under the headline, "Made Gradual Progress, Now Extended From Any Sound Base".
The number of top-rated funds owning its shares rose from 681 in Dec '19 to 848 in Dec '20, and its Up/Down Volume Ratio is 1.4 is an unbiased indication its shares have been under accumulation over the past 50 days. There is a small number of only 49.8 million shares (S criteria) outstanding, which can contribute to greater price volatility in the event of institutional buying or selling.
|
|
|
Color Codes Explained :
Y - Better candidates highlighted by our
staff of experts.
G - Previously featured
in past reports as yellow but may no longer be buyable under the
guidelines.
***Last / Change / Volume data in this table is the closing quote data***
Symbol/Exchange
Company Name
Industry Group |
PRICE |
CHANGE
(%Change) |
Day High |
Volume
(% DAV)
(% 50 day avg vol) |
52 Wk Hi
% From Hi |
Featured
Date |
Price
Featured |
Pivot Featured |
|
Max Buy |
 FBC
-
NYSE
FBC
-
NYSE
Flagstar Bancorp Inc
BANKING - Savings and Loans
|
$44.83
|
+0.20
0.45% |
$45.29
|
334,341
54.35% of 50 DAV
50 DAV is 615,200
|
$51.58
-13.09%
|
3/4/2021
|
$47.26
|
PP = $48.02
|
|
MB = $50.42
|
Most Recent Note - 4/5/2021 6:10:47 PM
G - Sputtering near its 50 DMA line ($45.68) with volume totals cooling in recent weeks. Near-term support to watch is prior lows.
>>> FEATURED STOCK ARTICLE : Slumping Into Prior Base Following Breakout - 3/22/2021 |
View all notes |
Set NEW NOTE alert |
Company Profile |
SEC
News |
Chart |
Request a new note
C
A
S
I |
CRL
-
NYSE
Charles River Labs Intl
DRUGS - Biotechnology
|
$306.40
|
+1.20
0.39% |
$306.56
|
238,196
73.29% of 50 DAV
50 DAV is 325,000
|
$307.44
-0.34%
|
12/17/2020
|
$247.06
|
PP = $257.98
|
|
MB = $270.88
|
 Most Recent Note - 4/9/2021 5:35:26 PM
G - Posted a quiet gain today for a best-ever close, its 7th gain in 8 sessions. Its 50 DMA line ($284) acted as support throughout its ongoing ascent. Its Relative Strength Rating is 77, below the 80+ minimum guideline for buy candidates. Dec '20 quarterly earnings rose +19% on +14% sales revenues versus the year ago period, below the +25% minimum earnings guideline (C criteria), raising fundamental concerns. See the latest FSU analysis for more details and a new annotated graph.
>>> FEATURED STOCK ARTICLE : Perched at Record High After Rally From 50-Day Moving Average - 4/9/2021 |
View all notes |
Set NEW NOTE alert |
Company Profile |
SEC
News |
Chart |
Request a new note
C
A
S
I |
BRKS
-
NASDAQ
Brooks Automation
ELECTRONICS - Semiconductor Equipment and Mate
|
$95.70
|
-2.66
-2.70% |
$97.43
|
519,891
73.53% of 50 DAV
50 DAV is 707,000
|
$101.63
-5.83%
|
4/5/2021
|
$99.31
|
PP = $91.88
|
|
MB = $96.47
|
Most Recent Note - 4/9/2021 5:38:09 PM
Y - Color code is changed to yellow after quietly consolidating back below its "max buy" level. Prior highs in the $91 area define initial support to watch above its 50 DMA line ($84)
>>> FEATURED STOCK ARTICLE : High Ranked Semiconductor Equipment Firm Powered Higher - 4/7/2021 |
View all notes |
Set NEW NOTE alert |
Company Profile |
SEC
News |
Chart |
Request a new note
C
A
S
I |
ENTG
-
NASDAQ
Entegris Inc
ELECTRONICS - Semiconductor Equipment and Mate
|
$121.45
|
-0.60
-0.49% |
$121.76
|
798,823
82.10% of 50 DAV
50 DAV is 973,000
|
$126.41
-3.92%
|
4/1/2021
|
$118.42
|
PP = $110.37
|
|
MB = $115.89
|
Most Recent Note - 4/8/2021 1:46:41 PM
G - Hovering near its all-time high and stubbornly holding its ground following a spurt of volume-driven gains. Prior highs in the $114-110 area define near-term support to watch on pullbacks.
>>> FEATURED STOCK ARTICLE : Strong Breakout Action With +67% Above Average Volume - 4/1/2021 |
View all notes |
Set NEW NOTE alert |
Company Profile |
SEC
News |
Chart |
Request a new note
C
A
S
I |
OPY
-
NYSE
Oppenheimer Holdings Inc
FINANCIAL SERVICES - Investment Brokerage - Regiona
|
$42.39
|
+0.52
1.24% |
$42.50
|
56,409
41.48% of 50 DAV
50 DAV is 136,000
|
$44.38
-4.48%
|
2/25/2021
|
$38.95
|
PP = $38.11
|
|
MB = $40.02
|
Most Recent Note - 4/6/2021 1:14:22 PM
G - Color code is changed to green while rising further above its "max buy" level with today's 3rd consecutive gain. Its 50 DMA line ($38.70) and prior low define near-term support to watch.
>>> FEATURED STOCK ARTICLE : Oppenheimer Consolidating Near Max Buy Level - 3/31/2021 |
View all notes |
Set NEW NOTE alert |
Company Profile |
SEC
News |
Chart |
Request a new note
C
A
S
I |
Symbol/Exchange
Company Name
Industry Group |
PRICE |
CHANGE
(%Change) |
Day High |
Volume
(% DAV)
(% 50 day avg vol) |
52 Wk Hi
% From Hi |
Featured
Date |
Price
Featured |
Pivot Featured |
|
Max Buy |
EDUC
-
NASDAQ
Educational Development
WHOLESALE - Basic Materials Wholesale
|
$17.42
|
+0.42
2.47% |
$17.42
|
31,300
94.85% of 50 DAV
50 DAV is 33,000
|
$20.00
-12.90%
|
3/10/2021
|
$17.89
|
PP = $20.10
|
|
MB = $21.11
|
Most Recent Note - 4/9/2021 5:39:46 PM
Y - Still consolidating above its 50 DMA line ($16.57) which defines important near-term support. Met stubborn resistance in the $19-20 area. Subsequent gains above the pivot point backed by at least +40% above average volume are needed to trigger a proper technical buy signal.
>>> FEATURED STOCK ARTICLE : Consolidating Above 50 DMA Line Perched Near High - 3/30/2021 |
View all notes |
Set NEW NOTE alert |
Company Profile |
SEC
News |
Chart |
Request a new note
C
A
S
I |
SMPL
-
NASDAQ
Simply Good Foods Co
Food-Confectionery
|
$31.33
|
-0.43
-1.35% |
$31.75
|
341,661
47.59% of 50 DAV
50 DAV is 717,900
|
$35.25
-11.12%
|
12/28/2020
|
$30.40
|
PP = $31.44
|
|
MB = $33.01
|
Most Recent Note - 4/7/2021 12:42:59 PM
G - Reported Feb '21 quarterly earnings +9% on +2% sales revenues versus the year ago period, below the +25% minimum earnings guideline (C criteria), raising fundamental concerns. Found prompt support near its 50 DMA line ($30.24) but its current Relative Strength Rating is 62, below the 80+ minimum guideline for buy candidates. Faces resistance due to overhead supply up to the $35 level.
>>> FEATURED STOCK ARTICLE : Violation of 50-Day Moving Average Triggered Technical Sell Signal - 3/24/2021 |
View all notes |
Set NEW NOTE alert |
Company Profile |
SEC
News |
Chart |
Request a new note
C
A
S
I |
QRVO
-
NASDAQ
Qorvo Inc
ELECTRONICS - Semiconductor - Integrated Cir
|
$191.86
|
-1.66
-0.86% |
$192.30
|
933,914
61.73% of 50 DAV
50 DAV is 1,513,000
|
$199.94
-4.04%
|
4/1/2021
|
$190.48
|
PP = $191.92
|
|
MB = $201.52
|
Most Recent Note - 4/5/2021 6:04:20 PM
Y - Posted a 3rd consecutive gain today with lighter volume while hitting a new all-time high, wedging up from any orderly 9-week base. Prior highs in the $191-185 area define initial support to watch on pullbacks. See the latest FSU analysis for more details and a new annotated graph.
>>> FEATURED STOCK ARTICLE : Hit Another New High With Even Less Volume Conviction - 4/5/2021 |
View all notes |
Set NEW NOTE alert |
Company Profile |
SEC
News |
Chart |
Request a new note
C
A
S
I |
YETI
-
NYSE
Yeti Holdings Inc
Leisure-Products
|
$79.00
|
+2.08
2.70% |
$79.73
|
1,609,144
123.12% of 50 DAV
50 DAV is 1,307,000
|
$80.89
-2.34%
|
4/6/2021
|
$76.95
|
PP = $79.42
|
|
MB = $83.39
|
Most Recent Note - 4/9/2021 12:49:14 PM
Y - Approaching prior highs with today's 4th consecutive gain. A new pivot point was cited based on its 2/10/21 high while working on a "double bottom" base. Subsequent gains above the pivot point backed by at least +40% above average volume may trigger a new (or add-on) technical buy signal.
>>> FEATURED STOCK ARTICLE : YETI Perched Within Striking Distance of High - 4/7/2021 |
View all notes |
Set NEW NOTE alert |
Company Profile |
SEC
News |
Chart |
Request a new note
C
A
S
I |
DT
-
NYSE
Dynatrace Inc
Computer Sftwr-Enterprse
|
$52.89
|
+0.38
0.72% |
$53.28
|
1,313,520
51.01% of 50 DAV
50 DAV is 2,574,900
|
$56.94
-7.11%
|
2/4/2021
|
$51.39
|
PP = $48.95
|
|
MB = $51.40
|
Most Recent Note - 4/8/2021 1:43:40 PM
G - Gapped up today rebounding further above its 50 DMA line ($50.40). Recent lows in the $45 area define important near-term support to watch on pullbacks. Its Relative Strength Rating is 69, well below the 80+ minimum guideline for buy candidates. Fundamentals remain strong after it reported Dec '20 earnings +70% on +28% sales revenues versus the year ago period.
>>> FEATURED STOCK ARTICLE : Gap Up Rebounding Further Above 50-Day Moving Average - 4/8/2021 |
View all notes |
Set NEW NOTE alert |
Company Profile |
SEC
News |
Chart |
Request a new note
C
A
S
I |
Symbol/Exchange
Company Name
Industry Group |
PRICE |
CHANGE
(%Change) |
Day High |
Volume
(% DAV)
(% 50 day avg vol) |
52 Wk Hi
% From Hi |
Featured
Date |
Price
Featured |
Pivot Featured |
|
Max Buy |
MRBK
-
NASDAQ
Meridian Corp
Banks-Northeast
|
$25.90
|
+0.04
0.15% |
$25.91
|
22,778
63.27% of 50 DAV
50 DAV is 36,000
|
$27.96
-7.37%
|
2/22/2021
|
$25.58
|
PP = $26.10
|
|
MB = $27.41
|
Most Recent Note - 4/7/2021 2:23:29 PM
Y - Volume totals have been cooling while hovering within close striking distance of its all-time high. Its 50 DMA line ($24.51) and prior low ($24.13 on 3/25/21) define important near-term support to watch where violations may trigger technical sell signals. Its Relative Strength Rating is 77, still below the 80+ minimum guideline.
>>> FEATURED STOCK ARTICLE : Prior High Defines Initial Support to Watch - 3/15/2021 |
View all notes |
Set NEW NOTE alert |
Company Profile |
SEC
News |
Chart |
Request a new note
C
A
S
I |
|
|
|
THESE ARE NOT BUY RECOMMENDATIONS!
Comments contained in the body of this report are technical
opinions only. The material herein has been obtained
from sources believed to be reliable and accurate, however,
its accuracy and completeness cannot be guaranteed.
This site is not an investment advisor, hence it does
not endorse or recommend any securities or other investments.
Any recommendation contained in this report may not
be suitable for all investors and it is not to be deemed
an offer or solicitation on our part with respect to
the purchase or sale of any securities. All trademarks,
service marks and trade names appearing in this report
are the property of their respective owners, and are
likewise used for identification purposes only.
This report is a service available
only to active Paid Premium Members.
You may opt-out of receiving report notifications
at any time. Questions or comments may be submitted
by writing to Premium Membership Services 665 S.E. 10 Street, Suite 201 Deerfield Beach, FL 33441-5634 or by calling 1-800-965-8307
or 954-785-1121.
|
|
|