You are not logged in.
This means you
CAN ONLY VIEW reports that were published prior to Thursday, March 20, 2025.
You
MUST UPGRADE YOUR MEMBERSHIP if you want to see any current reports.
AFTER MARKET UPDATE - WEDNESDAY, APRIL 7TH, 2021
Previous After Market Report Next After Market Report >>>
|
|
|
|
DOW |
+16.02 |
33,446.26 |
+0.05% |
|
Volume |
803,120,981 |
-7% |
|
Volume |
4,034,775,700 |
+0% |
|
NASDAQ |
-9.54 |
13,688.84 |
-0.07% |
|
Advancers |
1,433 |
44% |
|
Advancers |
1,297 |
32% |
|
S&P 500 |
+6.01 |
4,079.95 |
+0.15% |
|
Decliners |
1,826 |
56% |
|
Decliners |
2,790 |
68% |
|
Russell 2000 |
-36.10 |
2,223.05 |
-1.60% |
|
52 Wk Highs |
223 |
|
|
52 Wk Highs |
118 |
|
|
S&P 600 |
-18.62 |
1,325.31 |
-1.39% |
|
52 Wk Lows |
10 |
|
|
52 Wk Lows |
29 |
|
|
 |
Leadership Wanes Again With Major Indices Perched at Record Highs
Kenneth J. Gruneisen - Passed the CAN SLIM® Master's Exam
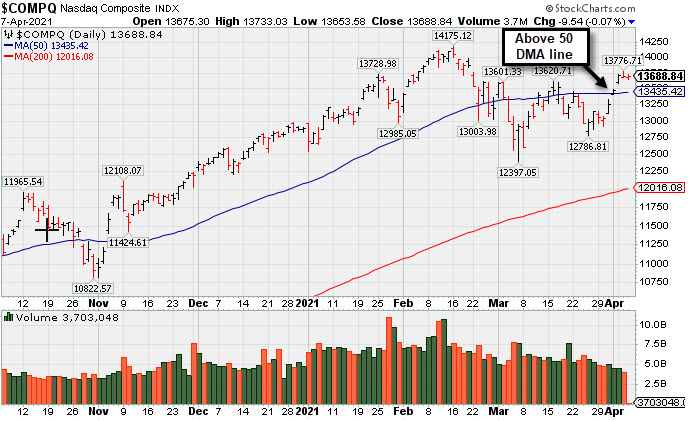
The Dow added 16 points, while the S&P 500 rose 0.2%. Six of 11 S&P 500 sectors closed in negative territory, with Materials leading decliners. The Nasdaq Composite dipped 0.1%. The small-cap Russell 2000 underperformed, shedding 1.7%. The volume totals were lighter than the prior session on the NYSE and near the prior session total on the Nasdaq exchange. Decliners led advancers by a 9-7 margin on the NYSE and by more than 2-1 on the Nasdaq exchange. Leadership contracted as there were 22 high-ranked companies from the Leaders List that hit new 52-week highs and were listed on the BreakOuts Page, versus the total of 56 on the prior session. New 52-week highs totals still outnumbered new 52-week lows on the NYSE on the Nasdaq exchange. The major indices (M criteria) are in a confirmed uptrend. Investors are reminded to always make buying and selling decisions on case-by-case basis under the strict criteria and rules of the fact-based investment system.
PICTURED: The Nasdaq Composite Index recently rebounded above its 50-day moving average (DMA) line.
U.S. stocks finished mixed on Wednesday as Wall Street digested the release of the Federal Reserve's latest meeting minutes. The report reiterated that it would likely take “some time” before the conditions were met to warrant policy tightening. Officials offered an upbeat assessment of the economic recovery and generally agreed that near-term price pressures should be transitory. The central bank’s current asset purchases were viewed as “providing substantial support to the economy.”
Upbeat comments from JPMorgan (JPM +1.57%) CEO Jamie Dimon garnered attention, as he suggested in his widely read annual letter that a confluence of factors could spark a "Goldilocks moment" for the U.S. economy, with a boom potentially extending into 2023. Meanwhile, President Biden conveyed openness to negotiating on the proposed corporate tax increase that would help fund his recently proposed $2.25 trillion infrastructure plan.
Treasuries turned lower, with the yield on the 10-year note up two basis points to 1.67%. On the data front, consumer credit surged a larger-than-expected $27.6 billion in February, the biggest jump since November 2017 as easing pandemic restrictions helped fuel a rise in credit card balances. Separately, the U.S. trade deficit surged to a record $71.1 billion in February. In commodities, WTI crude gained 0.5% to $59.60/barrel as investors weighed a larger-than-expected drawdown in weekly crude stockpiles against a surprise jump in weekly gasoline inventories. |
 Kenneth J. Gruneisen started out as a licensed stockbroker in August 1987, a couple of months prior to the historic stock market crash that took the Dow Jones Industrial Average down -22.6% in a single day. He has published daily fact-based fundamental and technical analysis on high-ranked stocks online for two decades. Through FACTBASEDINVESTING.COM, Kenneth provides educational articles, news, market commentary, and other information regarding proven investment systems that work in good times and bad.
Comments contained in the body of this report are technical opinions only and are not necessarily those of Gruneisen Growth Corp. The material herein has been obtained from sources believed to be reliable and accurate, however, its accuracy and completeness cannot be guaranteed. Our firm, employees, and customers may effect transactions, including transactions contrary to any recommendation herein, or have positions in the securities mentioned herein or options with respect thereto. Any recommendation contained in this report may not be suitable for all investors and it is not to be deemed an offer or solicitation on our part with respect to the purchase or sale of any securities. |
|
 |
Retail Index Rose and Energy Linked Groups Inched Higher
Kenneth J. Gruneisen - Passed the CAN SLIM® Master's Exam
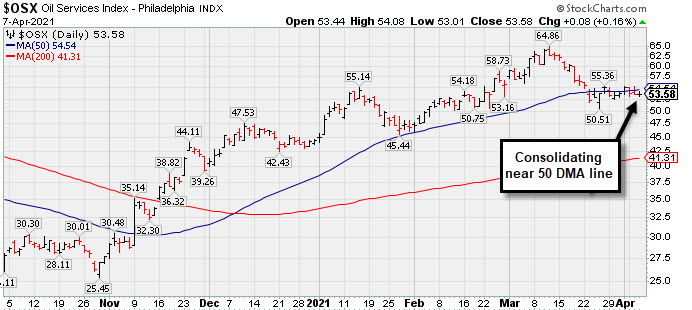
The Retail Index ($RLX +0.84%) had a positive influence on the major indices, meanwhile financials were mixed, as the Bank Index ($BKX +0.47%) edged higher, but the Broker/Dealer Index ($XBD -0.55%) ended slightly lower. The tech sector had a negative bias as the Biotech Index ($BTK -2.54%) and Networking Index ($NWX -0.89%) both lost ground while the Semiconductor Index ($SOX +0.01%) finished flat. The Oil Services Index ($OSX +0.16%) and Integrated Oil Index ($XOI +0.44%) both inched higher, meanwhile the Gold & Silver Index ($XAU -1.66%) fell.PICTURED: The Oil Services Index ($OSX +0.16%) has been consolidating near its 50-day moving average (DMA) line.
| Oil Services |
$OSX |
53.58 |
+0.08 |
+0.16% |
+20.86% |
| Integrated Oil |
$XOI |
1,016.02 |
+4.47 |
+0.44% |
+28.21% |
| Semiconductor |
$SOX |
3,266.46 |
+0.36 |
+0.01% |
+16.85% |
| Networking |
$NWX |
795.87 |
-7.18 |
-0.89% |
+10.98% |
| Broker/Dealer |
$XBD |
453.16 |
-2.49 |
-0.55% |
+20.01% |
| Retail |
$RLX |
3,805.87 |
+31.65 |
+0.84% |
+6.81% |
| Gold & Silver |
$XAU |
140.67 |
-2.37 |
-1.66% |
-2.44% |
| Bank |
$BKX |
122.22 |
+0.57 |
+0.47% |
+24.83% |
| Biotech |
$BTK |
5,445.53 |
-142.11 |
-2.54% |
-5.11% |
|
|
|
 |
High Ranked Semiconductor Equipment Firm Powered Higher
Kenneth J. Gruneisen - Passed the CAN SLIM® Master's Exam
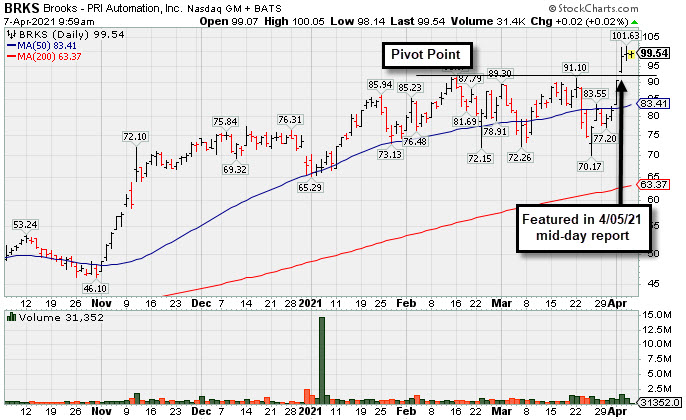
Brooks Automation (BRKS +$1.16 or +1.18% to $99.52) edged higher for a 5th consecutive gain. Its color code was changed to green. It finished strong after highlighted in yellow in the 4/05/21 mid-day report (read here) with pivot point cited based on its 2/12/21 high plus 10 cents. It hit a new all-time high with heavier volume while clearing a 6-week base, but it is quickly getting extended from the latest base. It found support after undercutting its 50 DMA line ($83.10) in recent weeks.
It reported earnings +104% on +19% sales revenues for the Dec '20 quarter versus the year ago period, marking its 6th consecutive quarterly comparison above the +25% minimum earnings guideline (C criteria). Annual earnings history (A criteria) included a downturn in FY '18. Its current Earnings Per Share Rating is 94, well above the 80+ minimum for buy candidates under the fact-based investment system's fundamental guidelines.
The Electronics - Semiconductor Equipment group is ranked 20th on the 197b Industry Groups list (L criteria). Its current Up/Down Volume Ratio of 1.4 is an unbiased indication its shares have been under accumulation over the past 50 days. It has a Timeliness rating of A and Sponsorship Rating of C. Its small supply of 74.2 million shares outstanding (S criteria) can contribute to greater price volatility in the event of institutional buying or selling. Charts courtesy of www.stockcharts.com
 |
|
|
Color Codes Explained :
Y - Better candidates highlighted by our
staff of experts.
G - Previously featured
in past reports as yellow but may no longer be buyable under the
guidelines.
***Last / Change / Volume data in this table is the closing quote data***
Symbol/Exchange
Company Name
Industry Group |
PRICE |
CHANGE
(%Change) |
Day High |
Volume
(% DAV)
(% 50 day avg vol) |
52 Wk Hi
% From Hi |
Featured
Date |
Price
Featured |
Pivot Featured |
|
Max Buy |
 FBC
-
NYSE
FBC
-
NYSE
Flagstar Bancorp Inc
BANKING - Savings and Loans
|
$45.14
|
-0.47
-1.03% |
$46.03
|
386,987
62.02% of 50 DAV
50 DAV is 624,000
|
$51.58
-12.49%
|
3/4/2021
|
$47.26
|
PP = $48.02
|
|
MB = $50.42
|
Most Recent Note - 4/5/2021 6:10:47 PM
G - Sputtering near its 50 DMA line ($45.68) with volume totals cooling in recent weeks. Near-term support to watch is prior lows.
>>> FEATURED STOCK ARTICLE : Slumping Into Prior Base Following Breakout - 3/22/2021 |
View all notes |
Set NEW NOTE alert |
Company Profile |
SEC
News |
Chart |
Request a new note
C
A
S
I |
CRL
-
NYSE
Charles River Labs Intl
DRUGS - Biotechnology
|
$296.53
|
-5.66
-1.87% |
$302.95
|
450,008
142.05% of 50 DAV
50 DAV is 316,800
|
$307.44
-3.55%
|
12/17/2020
|
$247.06
|
PP = $257.98
|
|
MB = $270.88
|
 Most Recent Note - 4/7/2021 2:31:31 PM
G - Pulling back today after touching a new all-time high on the prior session with its 5th consecutive gain. Its 50 DMA line ($282) acted as support throughout its ongoing ascent. Its Relative Strength Rating is 75, below the 80+ minimum guideline for buy candidates. Recently reported Dec '20 quarterly earnings +19% on +14% sales revenues versus the year ago period, below the +25% minimum earnings guideline (C criteria), raising fundamental concerns.
>>> FEATURED STOCK ARTICLE : Made Gradual Progress, Now Extended From Any Sound Base - 3/16/2021 |
View all notes |
Set NEW NOTE alert |
Company Profile |
SEC
News |
Chart |
Request a new note
C
A
S
I |
BRKS
-
NASDAQ
Brooks Automation
ELECTRONICS - Semiconductor Equipment and Mate
|
$96.68
|
-2.84
-2.85% |
$100.18
|
672,291
95.50% of 50 DAV
50 DAV is 704,000
|
$101.63
-4.87%
|
4/5/2021
|
$99.31
|
PP = $91.88
|
|
MB = $96.47
|
Most Recent Note - 4/6/2021 12:18:21 PM
G - Edging higher today and its color code is changed to green. Finished strong on the prior session after highlighted in yellow with pivot point cited based on its 2/12/21 high plus 10 cents. Hit a new all-time high with heavier volume behind its 4th consecutive gain while clearing a 6-week base, but quickly getting extended. Found support after undercutting its 50 DMA line ($83.13) in recent weeks. Reported earnings +104% on +19% sales revenues for the Dec '20 quarter versus the year ago period, its 6th consecutive quarterly comparison above the +25% minimum earnings guideline (C criteria). Annual earnings history (A criteria) included a downturn in FY '18.
>>> FEATURED STOCK ARTICLE : High Ranked Semiconductor Equipment Firm Powered Higher - 4/7/2021 |
View all notes |
Set NEW NOTE alert |
Company Profile |
SEC
News |
Chart |
Request a new note
C
A
S
I |
ENTG
-
NASDAQ
Entegris Inc
ELECTRONICS - Semiconductor Equipment and Mate
|
$118.63
|
-0.52
-0.44% |
$120.13
|
1,098,094
115.59% of 50 DAV
50 DAV is 950,000
|
$126.41
-6.15%
|
4/1/2021
|
$118.42
|
PP = $110.37
|
|
MB = $115.89
|
Most Recent Note - 4/5/2021 6:09:46 PM
G - Hit yet another new high today, quickly getting extended from prior highs and its color code was changed to green. Prior highs define initial support to watch on pullbacks.
>>> FEATURED STOCK ARTICLE : Strong Breakout Action With +67% Above Average Volume - 4/1/2021 |
View all notes |
Set NEW NOTE alert |
Company Profile |
SEC
News |
Chart |
Request a new note
C
A
S
I |
OPY
-
NYSE
Oppenheimer Holdings Inc
FINANCIAL SERVICES - Investment Brokerage - Regiona
|
$42.19
|
-0.10
-0.24% |
$42.78
|
66,758
48.38% of 50 DAV
50 DAV is 138,000
|
$44.38
-4.93%
|
2/25/2021
|
$38.95
|
PP = $38.11
|
|
MB = $40.02
|
Most Recent Note - 4/6/2021 1:14:22 PM
G - Color code is changed to green while rising further above its "max buy" level with today's 3rd consecutive gain. Its 50 DMA line ($38.70) and prior low define near-term support to watch.
>>> FEATURED STOCK ARTICLE : Oppenheimer Consolidating Near Max Buy Level - 3/31/2021 |
View all notes |
Set NEW NOTE alert |
Company Profile |
SEC
News |
Chart |
Request a new note
C
A
S
I |
Symbol/Exchange
Company Name
Industry Group |
PRICE |
CHANGE
(%Change) |
Day High |
Volume
(% DAV)
(% 50 day avg vol) |
52 Wk Hi
% From Hi |
Featured
Date |
Price
Featured |
Pivot Featured |
|
Max Buy |
EDUC
-
NASDAQ
Educational Development
WHOLESALE - Basic Materials Wholesale
|
$16.94
|
-0.93
-5.20% |
$17.92
|
33,698
99.11% of 50 DAV
50 DAV is 34,000
|
$20.00
-15.30%
|
3/10/2021
|
$17.89
|
PP = $20.10
|
|
MB = $21.11
|
Most Recent Note - 4/7/2021 2:49:08 PM
Y - Today's loss on higher volume has it slumping toward its 50 DMA line ($16.45) which defines important near-term support. Met stubborn resistance in the $19-20 area. Subsequent gains above the pivot point backed by at least +40% above average volume are needed to trigger a proper technical buy signal. This thinly traded Media - Books firm's annual earnings (A criteria) history has strong.
>>> FEATURED STOCK ARTICLE : Consolidating Above 50 DMA Line Perched Near High - 3/30/2021 |
View all notes |
Set NEW NOTE alert |
Company Profile |
SEC
News |
Chart |
Request a new note
C
A
S
I |
SMPL
-
NASDAQ
Simply Good Foods Co
Food-Confectionery
|
$31.48
|
+0.32
1.01% |
$32.67
|
971,205
136.64% of 50 DAV
50 DAV is 710,800
|
$35.25
-10.70%
|
12/28/2020
|
$30.40
|
PP = $31.44
|
|
MB = $33.01
|
Most Recent Note - 4/7/2021 12:42:59 PM
G - Reported Feb '21 quarterly earnings +9% on +2% sales revenues versus the year ago period, below the +25% minimum earnings guideline (C criteria), raising fundamental concerns. Found prompt support near its 50 DMA line ($30.24) but its current Relative Strength Rating is 62, below the 80+ minimum guideline for buy candidates. Faces resistance due to overhead supply up to the $35 level.
>>> FEATURED STOCK ARTICLE : Violation of 50-Day Moving Average Triggered Technical Sell Signal - 3/24/2021 |
View all notes |
Set NEW NOTE alert |
Company Profile |
SEC
News |
Chart |
Request a new note
C
A
S
I |
QRVO
-
NASDAQ
Qorvo Inc
ELECTRONICS - Semiconductor - Integrated Cir
|
$193.69
|
-1.29
-0.66% |
$195.83
|
833,394
55.16% of 50 DAV
50 DAV is 1,511,000
|
$199.94
-3.13%
|
4/1/2021
|
$190.48
|
PP = $191.92
|
|
MB = $201.52
|
Most Recent Note - 4/5/2021 6:04:20 PM
Y - Posted a 3rd consecutive gain today with lighter volume while hitting a new all-time high, wedging up from any orderly 9-week base. Prior highs in the $191-185 area define initial support to watch on pullbacks. See the latest FSU analysis for more details and a new annotated graph.
>>> FEATURED STOCK ARTICLE : Hit Another New High With Even Less Volume Conviction - 4/5/2021 |
View all notes |
Set NEW NOTE alert |
Company Profile |
SEC
News |
Chart |
Request a new note
C
A
S
I |
YETI
-
NYSE
Yeti Holdings Inc
Leisure-Products
|
$75.28
|
+0.22
0.29% |
$77.14
|
1,066,637
81.61% of 50 DAV
50 DAV is 1,307,000
|
$80.89
-6.94%
|
4/6/2021
|
$76.95
|
PP = $79.42
|
|
MB = $83.39
|
Most Recent Note - 4/7/2021 5:19:24 PM
Y - Posted a quiet gain today. A new pivot point was cited based on its 2/10/21 high while working on a "double bottom" base. Subsequent gains above the pivot point backed by at least +40% above average volume may trigger a new (or add-on) technical buy signal. Stayed well above its 200 DMA line after dropped from the Featured Stocks list on 3/04/21. See the latest FSU analysis for more details and a new annotated graph.
>>> FEATURED STOCK ARTICLE : YETI Perched Within Striking Distance of High - 4/7/2021 |
View all notes |
Set NEW NOTE alert |
Company Profile |
SEC
News |
Chart |
Request a new note
C
A
S
I |
UI
-
NYSE
Ubiquity Inc
Telecom-Infrastructure
|
$277.90
|
-11.16
-3.86% |
$290.07
|
142,073
102.21% of 50 DAV
50 DAV is 139,000
|
$401.81
-30.84%
|
3/26/2021
|
$383.00
|
PP = $362.99
|
|
MB = $381.14
|
Most Recent Note - 4/7/2021 2:26:44 PM
Sinking further below the prior low ($297) and it will be dropped from the Featured Stocks list tonight. Relative Strength has fallen to 70, below the 80+ minimum guideline for buy candidates. Quickly negated the prior breakout raising immediate concerns. A rebound above the 50 DMA line is needed for its outlook to improve.
>>> FEATURED STOCK ARTICLE : Volume +231% Above Average With Breakout Gain - 3/26/2021 |
View all notes |
Set NEW NOTE alert |
Company Profile |
SEC
News |
Chart |
Request a new note
C
A
S
I |
Symbol/Exchange
Company Name
Industry Group |
PRICE |
CHANGE
(%Change) |
Day High |
Volume
(% DAV)
(% 50 day avg vol) |
52 Wk Hi
% From Hi |
Featured
Date |
Price
Featured |
Pivot Featured |
|
Max Buy |
DT
-
NYSE
Dynatrace Inc
Computer Sftwr-Enterprse
|
$49.85
|
-0.78
-1.54% |
$50.74
|
1,426,306
54.75% of 50 DAV
50 DAV is 2,604,900
|
$56.94
-12.45%
|
2/4/2021
|
$51.39
|
PP = $48.95
|
|
MB = $51.40
|
Most Recent Note - 4/7/2021 2:33:14 PM
G - Consolidating near its 50 DMA line ($50.22). Recent lows in the $45 area define important near-term support to watch on pullbacks. Its Relative Strength Rating is 69, well below the 80+ minimum guideline for buy candidates. Fundamentals remain strong after it reported Dec '20 earnings +70% on +28% sales revenues versus the year ago period.
>>> FEATURED STOCK ARTICLE : 50-Day Moving Average Line Tested Again - 3/19/2021 |
View all notes |
Set NEW NOTE alert |
Company Profile |
SEC
News |
Chart |
Request a new note
C
A
S
I |
MRBK
-
NASDAQ
Meridian Corp
Banks-Northeast
|
$25.36
|
-0.56
-2.16% |
$25.90
|
11,659
32.39% of 50 DAV
50 DAV is 36,000
|
$27.96
-9.30%
|
2/22/2021
|
$25.58
|
PP = $26.10
|
|
MB = $27.41
|
Most Recent Note - 4/7/2021 2:23:29 PM
Y - Volume totals have been cooling while hovering within close striking distance of its all-time high. Its 50 DMA line ($24.51) and prior low ($24.13 on 3/25/21) define important near-term support to watch where violations may trigger technical sell signals. Its Relative Strength Rating is 77, still below the 80+ minimum guideline.
>>> FEATURED STOCK ARTICLE : Prior High Defines Initial Support to Watch - 3/15/2021 |
View all notes |
Set NEW NOTE alert |
Company Profile |
SEC
News |
Chart |
Request a new note
C
A
S
I |
|
|
|
THESE ARE NOT BUY RECOMMENDATIONS!
Comments contained in the body of this report are technical
opinions only. The material herein has been obtained
from sources believed to be reliable and accurate, however,
its accuracy and completeness cannot be guaranteed.
This site is not an investment advisor, hence it does
not endorse or recommend any securities or other investments.
Any recommendation contained in this report may not
be suitable for all investors and it is not to be deemed
an offer or solicitation on our part with respect to
the purchase or sale of any securities. All trademarks,
service marks and trade names appearing in this report
are the property of their respective owners, and are
likewise used for identification purposes only.
This report is a service available
only to active Paid Premium Members.
You may opt-out of receiving report notifications
at any time. Questions or comments may be submitted
by writing to Premium Membership Services 665 S.E. 10 Street, Suite 201 Deerfield Beach, FL 33441-5634 or by calling 1-800-965-8307
or 954-785-1121.
|
|
|