You are not logged in.
This means you
CAN ONLY VIEW reports that were published prior to Sunday, April 20, 2025.
You
MUST UPGRADE YOUR MEMBERSHIP if you want to see any current reports.
AFTER MARKET UPDATE - TUESDAY, MARCH 21ST, 2023
Previous After Market Report Next After Market Report >>>
|
|
|
|
DOW |
+316.02 |
32,560.60 |
+0.98% |
|
Volume |
1,146,346,109 |
-7% |
|
Volume |
4,747,428,500 |
-4% |
|
NASDAQ |
+184.57 |
11,860.11 |
+1.58% |
|
Advancers |
2,258 |
77% |
|
Advancers |
3,239 |
72% |
|
S&P 500 |
+51.30 |
4,002.87 |
+1.30% |
|
Decliners |
669 |
23% |
|
Decliners |
1,241 |
28% |
|
Russell 2000 |
+32.75 |
1,777.74 |
+1.88% |
|
52 Wk Highs |
25 |
|
|
52 Wk Highs |
60 |
|
|
S&P 600 |
+19.11 |
1,168.10 |
+1.66% |
|
52 Wk Lows |
44 |
|
|
52 Wk Lows |
127 |
|
|
Recent commentaries have noted an ongoing "market correction". No new buying efforts are to be made based on the (M criteria) of the fact-based investment system. Disciplined investors know to reduce market exposure by selling any weakening stocks on a case-by-case basis.
|
 |
Major Indices Rose But Volume Left Questions About Rally
Kenneth J. Gruneisen - Passed the CAN SLIM® Master's Exam
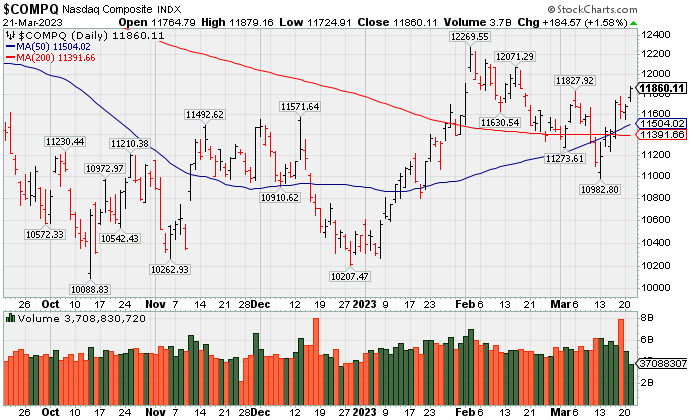
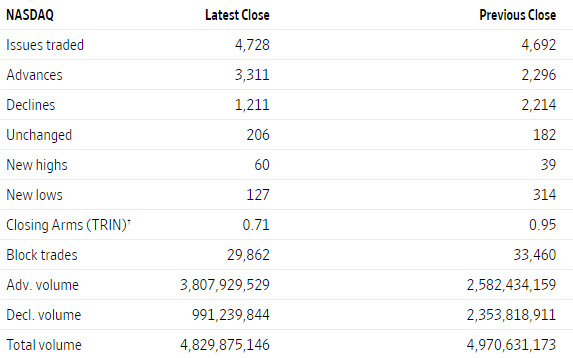
The Dow added 316 points (1%), while the Nasdaq Composite climbed 1.6%. The S&P 500 advanced 1.3%. Volume totals reported were lighter than the prior session on the NYSE and on the Nasdaq exchange. Advancers led decliners by more than a 3-1 margin on the NYSE and by 5-2 on the Nasdaq exchange. There were 16 high-ranked companies from theLeaders Listthat hit a new 52-week high and were listed on the BreakOuts Page, up from the total of 7 on the prior session. New 52-week lows totals contracted yet still outnumbered new 52-week highs totals on the NYSE and on the Nasdaq exchange. The major indices are in a market correction (M criteria). Disciplined investors know that in a market correction it is best to avoid new buying efforts and raise safe cash.
PICTURED: The Nasdaq Composite Index posted a solid gain on Day 7 of the rally attempt, but the reported volume total was lighter than the prior session. Disciplined investors are watching for a solid follow-through day to confirm a new uptrend. A closer look at the volume statistics versus the prior session showed a great increase in volume behind advancing issues and much lighter volume behind declining issues, a reassuring sign overall, despite the lower total.
Eight of 11 sectors finished in positive territory as U.S. equities rose on Tuesday. Investors continued to shake off the impacts of the recent turmoil in the banking sector. This morning, Treasury Secretary Janet Yellen indicated the government is equipped to provide further deposit guarantees if the crisis worsens. Stocks jumped on the news, led higher by regional bank shares.
On the data front, existing home sales surged 14.5% month-over-month in February - its biggest jump since mid-2020 - as the selling price of previously owned homes fell for the first time in 11 years. In the central bank space, the Federal Reserve’s (Fed) March monetary policy meeting began, and analysts anticipate they will announce a 25-basis point (0.25%) interest rate hike tomorrow. Investors will parse through the release and Fed Chair Jerome Powell’s post-meeting comments for any clues as to the future course of monetary policy.
Treasuries weakened, with the yield on the benchmark 10-year note up ten basis points (0.10%) to 3.59%, while the 30-year bond yield climbed five basis points (0.05%) to 3.72%. The yield on the two-year note, which is more sensitive to changes in monetary policy, advanced 22 basis points (0.22%) to 4.17%. In commodities, West Texas Intermediate (WTI) crude added 2.5% to $69.33/barrel amid easing concerns about the global banking sector. |
 Kenneth J. Gruneisen started out as a licensed stockbroker in August 1987, a couple of months prior to the historic stock market crash that took the Dow Jones Industrial Average down -22.6% in a single day. He has published daily fact-based fundamental and technical analysis on high-ranked stocks online for two decades. Through FACTBASEDINVESTING.COM, Kenneth provides educational articles, news, market commentary, and other information regarding proven investment systems that work in good times and bad.
Comments contained in the body of this report are technical opinions only and are not necessarily those of Gruneisen Growth Corp. The material herein has been obtained from sources believed to be reliable and accurate, however, its accuracy and completeness cannot be guaranteed. Our firm, employees, and customers may effect transactions, including transactions contrary to any recommendation herein, or have positions in the securities mentioned herein or options with respect thereto. Any recommendation contained in this report may not be suitable for all investors and it is not to be deemed an offer or solicitation on our part with respect to the purchase or sale of any securities. |
|
 |
Financial, Retail, Tech, and Energy-Linked Groups Rose
Kenneth J. Gruneisen - Passed the CAN SLIM® Master's Exam
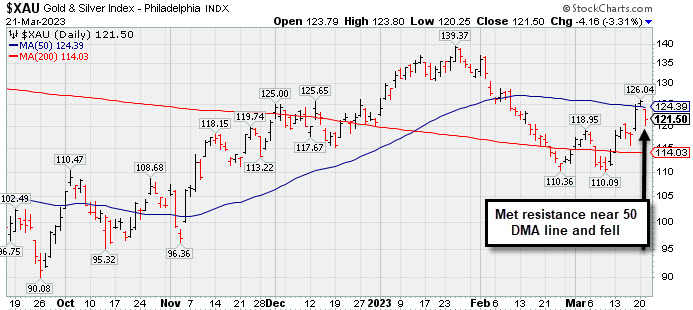
The Bank Index ($BKX +4.96%) and Broker/Dealer Index ($XBD +2.88%) both posted influential gains and the Retail Index ($RLX +1.83%) also gave the major averages a boost. The Networking Index ($NWX +1.22%) led the tech sector while the Biotech Index ($BTK +0.42%) edged higher but the Semiconductor Index ($SOX +0.07%) finished flat. Commodity-linked groups were mixed as the Oil Services Index ($OSX +3.46%) and Integrated Oil Index ($XOI +2.98%) bothb posted solid gains while the Gold & Silver Index ($XAU -3.31%) slumped.
PICTURED: The Gold & Silver Index ($XAU -3.31%) met resistance near its 50-day moving average (DMA) line and fell.
| Oil Services |
$OSX |
77.14 |
+2.58 |
+3.46% |
-8.01% |
| Integrated Oil |
$XOI |
1,673.79 |
+48.42 |
+2.98% |
-6.35% |
| Semiconductor |
$SOX |
3,116.89 |
+2.17 |
+0.07% |
+23.09% |
| Networking |
$NWX |
835.16 |
+10.07 |
+1.22% |
+6.62% |
| Broker/Dealer |
$XBD |
460.03 |
+12.86 |
+2.88% |
+2.43% |
| Retail |
$RLX |
2,921.42 |
+52.45 |
+1.83% |
+6.08% |
| Gold & Silver |
$XAU |
121.50 |
-4.16 |
-3.31% |
+0.53% |
| Bank |
$BKX |
83.35 |
+3.94 |
+4.96% |
-17.35% |
| Biotech |
$BTK |
5,186.40 |
+21.90 |
+0.42% |
-1.79% |
|
|
|
 |
Found Encouraging Support Near 50-Day Moving Average Line
Kenneth J. Gruneisen - Passed the CAN SLIM® Master's Exam
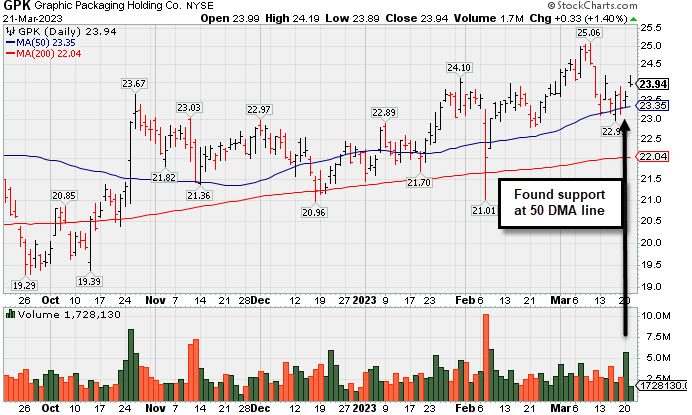
Graphic Packaging Hldg (GPK +$0.33 or +1.40% to $23.94) has recently been sputtering below the noted pivot point and testing support at its 50-day moving average (DMA) line ($23.38). More damaging losses would raise greater concerns and trigger a technical sell signal. Broader market weakness (M criteria) has been noted as a "correction" that has raised concerns.
Subsequent gains above the pivot point and for new highs backed by at least +40% above average volume may help provide a confirming technical buy signal. It was last shown in this FSU section on 2/27/23 with an annotated graph under the headline, "Quietly Lingering Near High With Strong Fundamentals".
GPK was highlighted in yellow with pivot point cited based on its 9/12/22 high plus 10 cents in the 10/25/22 mid-day report (read here). GPK has a 98 Earnings Per Share Rating. It reported Dec '22 quarterly earnings +74% on +20% sales revenues versus the year ago period. The past 4 quarterly comparisons were well above the +25% minimum earnings guideline (C criteria). Its annual earnings history has been good, meeting the fact-based investment system's fundamental guidelines (A criteria).
The Paper & Paper Products group is ranked 122nd on the 197 Industry Groups list and it has a C- (39) Group Relative Strength Rating (L criteria). The number of top-rated funds owning its shares rose from 596 in Sep '21 to 754 in Dec '22, a reassuring sign concerning the I criteria. Its current Up/Down Volume Ratio of 1.2 is an unbiased indication its shares have been under accumulation over the past 50 days.
|
|
|
Color Codes Explained :
Y - Better candidates highlighted by our
staff of experts.
G - Previously featured
in past reports as yellow but may no longer be buyable under the
guidelines.
***Last / Change / Volume data in this table is the closing quote data***
Symbol/Exchange
Company Name
Industry Group |
PRICE |
CHANGE
(%Change) |
Day High |
Volume
(% DAV)
(% 50 day avg vol) |
52 Wk Hi
% From Hi |
Featured
Date |
Price
Featured |
Pivot Featured |
|
Max Buy |
 GPK
-
NYSE
GPK
-
NYSE
Graphic Packaging
CONSUMER NON-DURABLES - Packaging and Containers
|
$23.94
|
+0.33
1.40% |
$24.19
|
1,728,126
52.59% of 50 DAV
50 DAV is 3,286,000
|
$25.17
-4.89%
|
10/25/2022
|
$22.75
|
PP = $24.17
|
|
MB = $25.38
|
 Most Recent Note - 3/21/2023 6:40:39 PM
Y - Recently sputtering below the noted pivot point and finding support at its 50 DMA line ($23.43). More damaging losses would raise greater concerns and trigger a technical sell signal. See the latest FSU analysis for more details and a new annotated graph.
>>> FEATURED STOCK ARTICLE : Found Encouraging Support Near 50-Day Moving Average Line - 3/21/2023 |
View all notes |
Set NEW NOTE alert |
Company Profile |
SEC
News |
Chart |
Request a new note
C
A
S
I |
STRL
-
NASDAQ
Sterling Infrastructure
MATERIALS and; CONSTRUCTION - Heavy Construction
|
$38.78
|
+0.90
2.38% |
$39.29
|
175,641
60.99% of 50 DAV
50 DAV is 288,000
|
$42.00
-7.67%
|
12/14/2022
|
$32.41
|
PP = $33.72
|
|
MB = $35.41
|
Most Recent Note - 3/21/2023 6:28:32 PM
G - Posted a 2nd consecutive gain today with below-average volume. Volume was higher as it abruptly slumped last week from near its all-time high toward its 50 DMA line ($36.57) which defines important near-term support to watch.
>>> FEATURED STOCK ARTICLE : Posting Quiet Gains Just Above 50-Day Moving Average Line - 3/20/2023 |
View all notes |
Set NEW NOTE alert |
Company Profile |
SEC
News |
Chart |
Request a new note
C
A
S
I |
PERI
-
NASDAQ
Perion Network
Comml Svcs-Advertising
|
$36.39
|
+1.20
3.41% |
$36.54
|
630,518
81.99% of 50 DAV
50 DAV is 769,000
|
$37.18
-2.12%
|
1/25/2023
|
$31.79
|
PP = $33.19
|
|
MB = $34.85
|
Most Recent Note - 3/21/2023 6:26:59 PM
G - Volume was below average behind today's gain for a best-ever close. Consolidating above its 50 DMA line ($32.96) and the prior high ($33) which define important near-term support.
>>> FEATURED STOCK ARTICLE : Consolidating in an Orderly Manner Above Old High and 50 DMA Line - 3/15/2023 |
View all notes |
Set NEW NOTE alert |
Company Profile |
SEC
News |
Chart |
Request a new note
C
A
S
I |
ALGM
-
NASDAQ
Allegro MicroSystems
Elec-Semiconductor Mfg
|
$46.55
|
-0.01
-0.02% |
$47.68
|
1,573,324
95.70% of 50 DAV
50 DAV is 1,644,000
|
$47.67
-2.35%
|
1/31/2023
|
$37.80
|
PP = $38.38
|
|
MB = $40.30
|
Most Recent Note - 3/20/2023 5:30:42 PM
G - Posted a solid gain today with average volume for a best-ever close. It is extended from the previously noted base. Its 50 DMA line ($40.31) and prior high in the $38 area define important support to watch on pullbacks.
>>> FEATURED STOCK ARTICLE : Holding its Ground After Rallying From Previously Noted Base - 3/1/2023 |
View all notes |
Set NEW NOTE alert |
Company Profile |
SEC
News |
Chart |
Request a new note
C
A
S
I |
FIX
-
NYSE
Comfort Systems USA
MATERIALS and CONSTRUCTION - General Contractors
|
$141.22
|
+2.07
1.49% |
$142.20
|
293,401
116.43% of 50 DAV
50 DAV is 252,000
|
$152.13
-7.17%
|
2/23/2023
|
$136.52
|
PP = $128.78
|
|
MB = $135.22
|
Most Recent Note - 3/20/2023 5:34:21 PM
G - Posted a solid gain today. The prior high in the $128 area and its 50 DMA line ($128.59) coincide defining important support to watch. Fundamentals remain strong.
>>> FEATURED STOCK ARTICLE : Consolidating Above Support at Prior High and 50-Day Moving Average - 3/16/2023 |
View all notes |
Set NEW NOTE alert |
Company Profile |
SEC
News |
Chart |
Request a new note
C
A
S
I |
Symbol/Exchange
Company Name
Industry Group |
PRICE |
CHANGE
(%Change) |
Day High |
Volume
(% DAV)
(% 50 day avg vol) |
52 Wk Hi
% From Hi |
Featured
Date |
Price
Featured |
Pivot Featured |
|
Max Buy |
KOF
-
NYSE
Coca-Cola Femsa ADR
FOOD and BEVERAGE - Beverages - Soft Drinks
|
$77.13
|
+1.41
1.86% |
$77.92
|
194,168
115.58% of 50 DAV
50 DAV is 168,000
|
$79.16
-2.56%
|
3/7/2023
|
$76.63
|
PP = $77.11
|
|
MB = $80.97
|
Most Recent Note - 3/20/2023 5:36:02 PM
Y - Posted another gain today with very light volume. Highlighted in yellow with pivot point cited based on its 1/24/23 high plus 10 cents in the 3/07/23 mid-day report. Gains above the pivot point must be backed by at least +40% above average volume to trigger a proper technical buy signal.
>>> FEATURED STOCK ARTICLE : Mexican Coke Bottler Hits New Multi-Year High - 3/7/2023 |
View all notes |
Set NEW NOTE alert |
Company Profile |
SEC
News |
Chart |
Request a new note
C
A
S
I |
ANET
-
NYSE
Arista Networks
Computer-Networking
|
$168.08
|
+3.88
2.36% |
$169.17
|
3,584,719
144.37% of 50 DAV
50 DAV is 2,483,000
|
$165.25
1.71%
|
3/8/2023
|
$147.59
|
PP = $148.67
|
|
MB = $156.10
|
Most Recent Note - 3/21/2023 12:06:32 PM
G - Rising further above its "max buy" level and hitting another new all-time high with today's 7th consecutive volume-driven gain. Broader market weakness (M criteria) has been noted as a "correction" that has raised concerns.
>>> FEATURED STOCK ARTICLE : Arista Challenging All-Time High - 3/8/2023 |
View all notes |
Set NEW NOTE alert |
Company Profile |
SEC
News |
Chart |
Request a new note
C
A
S
I |
CLH
-
NYSE
Clean Harbors
Pollution Control
|
$137.89
|
+2.87
2.13% |
$139.45
|
400,645
101.43% of 50 DAV
50 DAV is 395,000
|
$140.69
-1.99%
|
3/10/2023
|
$136.89
|
PP = $136.74
|
|
MB = $143.58
|
Most Recent Note - 3/21/2023 6:29:23 PM
Y - Posted a gain today with average volume after a noted spurt of volume-driven losses. Fundamentals remain strong. Its 50 DMA line ($130.83) defines important near-term support to watch.
>>> FEATURED STOCK ARTICLE : Pullback to Support Marked Secondary Buy Point; Market Concerns Rose - 3/10/2023 |
View all notes |
Set NEW NOTE alert |
Company Profile |
SEC
News |
Chart |
Request a new note
C
A
S
I |
|
|
|
THESE ARE NOT BUY RECOMMENDATIONS!
Comments contained in the body of this report are technical
opinions only. The material herein has been obtained
from sources believed to be reliable and accurate, however,
its accuracy and completeness cannot be guaranteed.
This site is not an investment advisor, hence it does
not endorse or recommend any securities or other investments.
Any recommendation contained in this report may not
be suitable for all investors and it is not to be deemed
an offer or solicitation on our part with respect to
the purchase or sale of any securities. All trademarks,
service marks and trade names appearing in this report
are the property of their respective owners, and are
likewise used for identification purposes only.
This report is a service available
only to active Paid Premium Members.
You may opt-out of receiving report notifications
at any time. Questions or comments may be submitted
by writing to Premium Membership Services 665 S.E. 10 Street, Suite 201 Deerfield Beach, FL 33441-5634 or by calling 1-800-965-8307
or 954-785-1121.
|
|
|