You are not logged in.
This means you
CAN ONLY VIEW reports that were published prior to Sunday, April 20, 2025.
You
MUST UPGRADE YOUR MEMBERSHIP if you want to see any current reports.
AFTER MARKET UPDATE - WEDNESDAY, MARCH 22ND, 2023
Previous After Market Report Next After Market Report >>>
|
|
|
|
DOW |
-530.49 |
32,030.11 |
-1.63% |
|
Volume |
1,008,894,493 |
-12% |
|
Volume |
4,948,415,600 |
+4% |
|
NASDAQ |
-190.15 |
11,669.96 |
-1.60% |
|
Advancers |
720 |
25% |
|
Advancers |
1,249 |
28% |
|
S&P 500 |
-65.90 |
3,936.97 |
-1.65% |
|
Decliners |
2,170 |
75% |
|
Decliners |
3,196 |
72% |
|
Russell 2000 |
-50.38 |
1,727.36 |
-2.83% |
|
52 Wk Highs |
28 |
|
|
52 Wk Highs |
49 |
|
|
S&P 600 |
-30.21 |
1,137.89 |
-2.59% |
|
52 Wk Lows |
102 |
|
|
52 Wk Lows |
189 |
|
|
Recent commentaries have noted an ongoing "market correction". No new buying efforts are to be made based on the (M criteria) of the fact-based investment system. Disciplined investors know to reduce market exposure by selling any weakening stocks on a case-by-case basis.
|
 |
Major Averages Lost More Ground Following Fed Decision
Kenneth J. Gruneisen - Passed the CAN SLIM® Master's Exam
The Dow lost 530 points (1.6%), while the technology heavy Nasdaq Composite declined 1.6%. The S&P 500 fell by 1.7%. Volume totals reported were mixed, lighter than the prior session on the NYSE and higher on the Nasdaq exchange. Breadth was negative as decliners led advancers by more than a 3-1 margin on the NYSE and by 5-2 on the Nasdaq exchange. There were 16 high-ranked companies from theLeaders Listthat hit a new 52-week high and were listed on the BreakOuts Page, matching the total of 16 on the prior session. New 52-week lows totals rose and outnumbered new 52-week highs totals on the NYSE and on the Nasdaq exchange. The major indices are in a market correction (M criteria). Disciplined investors know that in a market correction it is best to avoid new buying efforts and raise safe cash.
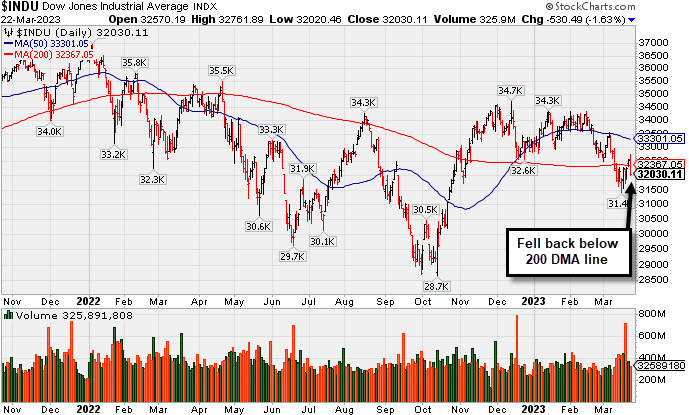
PICTURED: The Dow Jones Industrial Average slumped back below its 200-day moving average (DMA) line for a damaging loss on what was Day 5 of its latest rally attempt. Disciplined investors are watching for a solid follow-through day to confirm a new uptrend.
All eleven sectors finished in negative territory as U.S. equities closed lower Wednesday. The Federal Open Market Committee (FOMC) announced the widely expected quarter-point interest rate increase, notching the central bank’s ninth straight rate hike since March 2022. Following the meeting, the FOMC hinted the central bank would likely only raise rates one more time this year, keeping their terminal rate unchanged from December’s 5.1% estimate. Meanwhile, they project rates will fall in 2024 to 4.25%, a notch higher from December’s estimates. However, during Federal Reserve (Fed) Chair Jerome Powell press conference, Powell stipulated the fight to combat high inflation is far from over, but still believes a soft landing is possible.
On the data front, Mortgage Banker Association (MBA) mortgage applications for the week ended March 17 increased 3%, down from the prior week’s 6.5% gain. This week’s reading notched its third-straight week of advances as U.S. mortgage rates fell to a five-week low last week.
Treasuries strengthened with the yield on the benchmark 10-year note decreasing 16 basis points (0.16%) to 3.43% while the 30-year bond yield declined seven basis points (0.07%) to 3.65%. The yield on the two-year, which is more sensitive to changes in monetary policy, note lost 25 basis points (0.25%) to 3.92%. In commodities, West Texas Intermediate (WTI) crude increased 0.7% to $70.12/barrel amid a surprise build in U.S. crude oil inventories. Early this morning, the U.S. Energy Information Administration (EIA) reported crude stockpiles topped expectation by adding 1.1 million barrels during the week ended Market 17, versus the expected 1.6-million-barrel decline.
|
 Kenneth J. Gruneisen started out as a licensed stockbroker in August 1987, a couple of months prior to the historic stock market crash that took the Dow Jones Industrial Average down -22.6% in a single day. He has published daily fact-based fundamental and technical analysis on high-ranked stocks online for two decades. Through FACTBASEDINVESTING.COM, Kenneth provides educational articles, news, market commentary, and other information regarding proven investment systems that work in good times and bad.
Comments contained in the body of this report are technical opinions only and are not necessarily those of Gruneisen Growth Corp. The material herein has been obtained from sources believed to be reliable and accurate, however, its accuracy and completeness cannot be guaranteed. Our firm, employees, and customers may effect transactions, including transactions contrary to any recommendation herein, or have positions in the securities mentioned herein or options with respect thereto. Any recommendation contained in this report may not be suitable for all investors and it is not to be deemed an offer or solicitation on our part with respect to the purchase or sale of any securities. |
|
 |
Financial, Retail, Tech, and Energy-Linked Groups Fell
Kenneth J. Gruneisen - Passed the CAN SLIM® Master's Exam
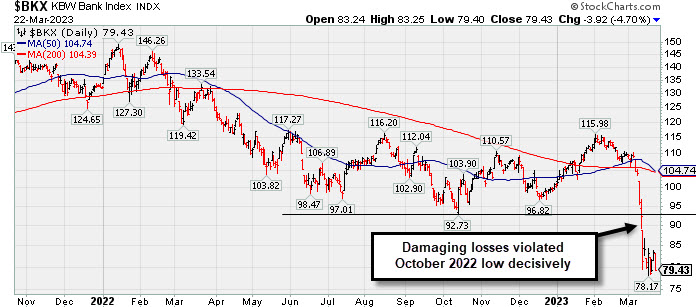
Financial stocks had a negative influence on the major averages as the Bank Index ($BKX -4.70%) outpaced the Broker/Dealer Index ($XBD -2.47%) to the downside. The Retail Index ($RLX -2.02%) fell and the tech sector had a negative bias as the Networking Index ($NWX -2.50%), Biotech Index ($BTK -2.12%), and Semiconductor Index ($SOX -0.81%) each lost ground. Commodity-linked groups were mixed as the Oil Services Index ($OSX -2.96%) and Integrated Oil Index ($XOI -1.67%) both fell while the Gold & Silver Index ($XAU +1.44%) posted a standout gain.
PICTURED: The Bank Index ($BKX -4.70%) violated its October 2022 low decisively with recent losses. Long time readers know that the financial indexes have been reliable leading indicators, so the recent damage bodes poorly for the broader market outlook.
| Oil Services |
$OSX |
74.85 |
-2.29 |
-2.96% |
-10.74% |
| Integrated Oil |
$XOI |
1,645.77 |
-28.02 |
-1.67% |
-7.92% |
| Semiconductor |
$SOX |
3,091.71 |
-25.18 |
-0.81% |
+22.10% |
| Networking |
$NWX |
814.30 |
-20.86 |
-2.50% |
+3.96% |
| Broker/Dealer |
$XBD |
448.65 |
-11.38 |
-2.47% |
-0.11% |
| Retail |
$RLX |
2,862.28 |
-59.14 |
-2.02% |
+3.93% |
| Gold & Silver |
$XAU |
123.26 |
+1.75 |
+1.44% |
+1.98% |
| Bank |
$BKX |
79.43 |
-3.92 |
-4.70% |
-21.24% |
| Biotech |
$BTK |
5,076.20 |
-110.21 |
-2.12% |
-3.88% |
|
|
|
 |
Extended From Prior Base and Perched Near All-Time High
Kenneth J. Gruneisen - Passed the CAN SLIM® Master's Exam
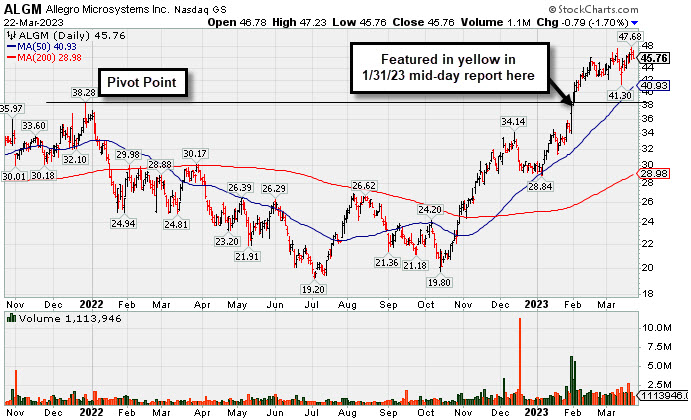
Allegro Microsystems Inc (ALGM ) ended at the session low today with a loss on below average volume. It is extended from the previously noted base. Its 50-day moving average (DMA) line ($40.95) defines initial support to watch above the prior high in the $38 area.
The company hails from the Elec-Semiconductor Mfg group which is currently ranked 26th on the 197 Industry Groups list. It has a highest possible 99 Earnings Per Share Rating. Quarterly comparisons through Dec '22 have been above the +25% minimum earnings guideline (C criteria). Annual earnings history has been strong since its $14 IPO in Oct '20. ALGM has a new CEO as of Jun '22.
The number of top-rated funds owning its shares rose from 341 in Mar '22 to 463 in Dec '22, a reassuringn sign concerning the I criteria. The current Up/Down Volume Ratio of 1.6 is an unbiased indication its shares have been under accumulation over the past 50 days.
|
|
|
Color Codes Explained :
Y - Better candidates highlighted by our
staff of experts.
G - Previously featured
in past reports as yellow but may no longer be buyable under the
guidelines.
***Last / Change / Volume data in this table is the closing quote data***
Symbol/Exchange
Company Name
Industry Group |
PRICE |
CHANGE
(%Change) |
Day High |
Volume
(% DAV)
(% 50 day avg vol) |
52 Wk Hi
% From Hi |
Featured
Date |
Price
Featured |
Pivot Featured |
|
Max Buy |
 GPK
-
NYSE
GPK
-
NYSE
Graphic Packaging
CONSUMER NON-DURABLES - Packaging and Containers
|
$23.78
|
-0.16
-0.67% |
$24.21
|
2,304,069
70.37% of 50 DAV
50 DAV is 3,274,000
|
$25.17
-5.52%
|
10/25/2022
|
$22.75
|
PP = $24.17
|
|
MB = $25.38
|
Most Recent Note - 3/21/2023 6:40:39 PM
Y - Recently sputtering below the noted pivot point and finding support at its 50 DMA line ($23.43). More damaging losses would raise greater concerns and trigger a technical sell signal. See the latest FSU analysis for more details and a new annotated graph.
>>> FEATURED STOCK ARTICLE : Found Encouraging Support Near 50-Day Moving Average Line - 3/21/2023 |
View all notes |
Set NEW NOTE alert |
Company Profile |
SEC
News |
Chart |
Request a new note
C
A
S
I |
STRL
-
NASDAQ
Sterling Infrastructure
MATERIALS and; CONSTRUCTION - Heavy Construction
|
$38.07
|
-0.71
-1.83% |
$39.05
|
284,670
98.84% of 50 DAV
50 DAV is 288,000
|
$42.00
-9.36%
|
12/14/2022
|
$32.41
|
PP = $33.72
|
|
MB = $35.41
|
Most Recent Note - 3/21/2023 6:28:32 PM
G - Posted a 2nd consecutive gain today with below-average volume. Volume was higher as it abruptly slumped last week from near its all-time high toward its 50 DMA line ($36.57) which defines important near-term support to watch.
>>> FEATURED STOCK ARTICLE : Posting Quiet Gains Just Above 50-Day Moving Average Line - 3/20/2023 |
View all notes |
Set NEW NOTE alert |
Company Profile |
SEC
News |
Chart |
Request a new note
C
A
S
I |
PERI
-
NASDAQ
Perion Network
Comml Svcs-Advertising
|
$37.25
|
+0.86
2.36% |
$38.10
|
1,076,257
141.80% of 50 DAV
50 DAV is 759,000
|
$37.18
0.19%
|
1/25/2023
|
$31.79
|
PP = $33.19
|
|
MB = $34.85
|
 Most Recent Note - 3/22/2023 12:21:56 PM
G - Hit a new all-time high with today's early gain. Found support when recently consolidating above its 50 DMA line ($33.12) and the prior high ($33) which define important near-term support.
>>> FEATURED STOCK ARTICLE : Consolidating in an Orderly Manner Above Old High and 50 DMA Line - 3/15/2023 |
View all notes |
Set NEW NOTE alert |
Company Profile |
SEC
News |
Chart |
Request a new note
C
A
S
I |
ALGM
-
NASDAQ
Allegro MicroSystems
Elec-Semiconductor Mfg
|
$45.76
|
-0.79
-1.70% |
$47.23
|
1,113,982
66.91% of 50 DAV
50 DAV is 1,665,000
|
$47.68
-4.03%
|
1/31/2023
|
$37.80
|
PP = $38.38
|
|
MB = $40.30
|
Most Recent Note - 3/22/2023 5:00:07 PM
G - It is extended from the previously noted base. Its 50 DMA line ($40.95) defines initial support above the prior high in the $38 area. See the latest FSU analysis for more details and a new annotated graph.
>>> FEATURED STOCK ARTICLE : Extended From Prior Base and Perched Near All-Time High - 3/22/2023 |
View all notes |
Set NEW NOTE alert |
Company Profile |
SEC
News |
Chart |
Request a new note
C
A
S
I |
FIX
-
NYSE
Comfort Systems USA
MATERIALS and CONSTRUCTION - General Contractors
|
$139.97
|
-1.25
-0.89% |
$141.50
|
327,200
129.84% of 50 DAV
50 DAV is 252,000
|
$152.13
-7.99%
|
2/23/2023
|
$136.52
|
PP = $128.78
|
|
MB = $135.22
|
Most Recent Note - 3/22/2023 5:03:20 PM
G - Consolidating well above its 50 DMA line ($129.66) and the prior high in the $128 area defining important support to watch. Fundamentals remain strong.
>>> FEATURED STOCK ARTICLE : Consolidating Above Support at Prior High and 50-Day Moving Average - 3/16/2023 |
View all notes |
Set NEW NOTE alert |
Company Profile |
SEC
News |
Chart |
Request a new note
C
A
S
I |
Symbol/Exchange
Company Name
Industry Group |
PRICE |
CHANGE
(%Change) |
Day High |
Volume
(% DAV)
(% 50 day avg vol) |
52 Wk Hi
% From Hi |
Featured
Date |
Price
Featured |
Pivot Featured |
|
Max Buy |
KOF
-
NYSE
Coca-Cola Femsa ADR
FOOD and BEVERAGE - Beverages - Soft Drinks
|
$77.26
|
+0.13
0.17% |
$78.06
|
150,775
88.69% of 50 DAV
50 DAV is 170,000
|
$79.16
-2.40%
|
3/7/2023
|
$76.63
|
PP = $77.11
|
|
MB = $80.97
|
Most Recent Note - 3/22/2023 5:04:56 PM
Y - Posted a small gain today with very light volume for its second-best-ever close. Highlighted in yellow with pivot point cited based on its 1/24/23 high plus 10 cents in the 3/07/23 mid-day report. Gains above the pivot point must be backed by at least +40% above average volume to trigger a proper technical buy signal.
>>> FEATURED STOCK ARTICLE : Mexican Coke Bottler Hits New Multi-Year High - 3/7/2023 |
View all notes |
Set NEW NOTE alert |
Company Profile |
SEC
News |
Chart |
Request a new note
C
A
S
I |
ANET
-
NYSE
Arista Networks
Computer-Networking
|
$166.06
|
-2.02
-1.20% |
$170.14
|
2,967,029
118.30% of 50 DAV
50 DAV is 2,508,000
|
$169.17
-1.84%
|
3/8/2023
|
$147.59
|
PP = $148.67
|
|
MB = $156.10
|
Most Recent Note - 3/22/2023 12:08:45 PM
G - Perched at its all-time high today, very extended from any sound base after an impressive spurt of volume-driven gains. Prior highs in the $148-145 area define initial support to watch above its 50 DMA line ($136). Broader market weakness (M criteria) has been noted as a "correction" that has raised concerns.
>>> FEATURED STOCK ARTICLE : Arista Challenging All-Time High - 3/8/2023 |
View all notes |
Set NEW NOTE alert |
Company Profile |
SEC
News |
Chart |
Request a new note
C
A
S
I |
CLH
-
NYSE
Clean Harbors
Pollution Control
|
$133.63
|
-4.26
-3.09% |
$137.99
|
477,441
119.66% of 50 DAV
50 DAV is 399,000
|
$140.69
-5.02%
|
3/10/2023
|
$136.89
|
PP = $136.74
|
|
MB = $143.58
|
Most Recent Note - 3/22/2023 5:02:06 PM
Y - Pulled back today for a loss with +20% above average volume. Fundamentals remain strong. Its 50 DMA line ($131.18) defines important near-term support to watch.
>>> FEATURED STOCK ARTICLE : Pullback to Support Marked Secondary Buy Point; Market Concerns Rose - 3/10/2023 |
View all notes |
Set NEW NOTE alert |
Company Profile |
SEC
News |
Chart |
Request a new note
C
A
S
I |
|
|
|
THESE ARE NOT BUY RECOMMENDATIONS!
Comments contained in the body of this report are technical
opinions only. The material herein has been obtained
from sources believed to be reliable and accurate, however,
its accuracy and completeness cannot be guaranteed.
This site is not an investment advisor, hence it does
not endorse or recommend any securities or other investments.
Any recommendation contained in this report may not
be suitable for all investors and it is not to be deemed
an offer or solicitation on our part with respect to
the purchase or sale of any securities. All trademarks,
service marks and trade names appearing in this report
are the property of their respective owners, and are
likewise used for identification purposes only.
This report is a service available
only to active Paid Premium Members.
You may opt-out of receiving report notifications
at any time. Questions or comments may be submitted
by writing to Premium Membership Services 665 S.E. 10 Street, Suite 201 Deerfield Beach, FL 33441-5634 or by calling 1-800-965-8307
or 954-785-1121.
|
|
|