You are not logged in.
This means you
CAN ONLY VIEW reports that were published prior to Thursday, April 10, 2025.
You
MUST UPGRADE YOUR MEMBERSHIP if you want to see any current reports.
AFTER MARKET UPDATE - MONDAY, MARCH 6TH, 2023
Previous After Market Report Next After Market Report >>>
|
|
|
|
DOW |
+40.47 |
33,431.44 |
+0.12% |
|
Volume |
944,503,111 |
+6% |
|
Volume |
4,957,943,600 |
-2% |
|
NASDAQ |
-13.27 |
11,675.74 |
-0.11% |
|
Advancers |
1,043 |
35% |
|
Advancers |
1,569 |
35% |
|
S&P 500 |
+2.78 |
4,048.42 |
+0.07% |
|
Decliners |
1,924 |
65% |
|
Decliners |
2,964 |
65% |
|
Russell 2000 |
-28.51 |
1,899.76 |
-1.48% |
|
52 Wk Highs |
87 |
|
|
52 Wk Highs |
94 |
|
|
S&P 600 |
-28.64 |
1,241.11 |
-2.26% |
|
52 Wk Lows |
23 |
|
|
52 Wk Lows |
93 |
|
|
 |
Breadth Negative as Major Averages Sputtered After Early Gains
Kenneth J. Gruneisen - Passed the CAN SLIM® Master's Exam
The Dow added 40 points, while the technology-heavy Nasdaq Composite declined 0.1%. The S&P 500 gained 0.1%. Volume totals were mixed, higher than the prior session on the NYSE and lighter on the Nasdaq exchange. Breadth was negative as decliners led advancers by almost a 2-1 margin on the NYSE and on the Nasdaq exchange. There were 42 high-ranked companies from the Leaders List that hit new 52-week highs and were listed on the BreakOuts Page, versus 54 on the prior session. New 52-week highs outnumbered new 52-week lows on the NYSE while the totals were near even on the Nasdaq exchange. The major indices are in an uptrend under pressure (M criteria). For any rally to be sustained there must be healthy leadership. It will be important to watch for the new highs totals to remain strong or improve in the immediate days ahead. Stay tuned!
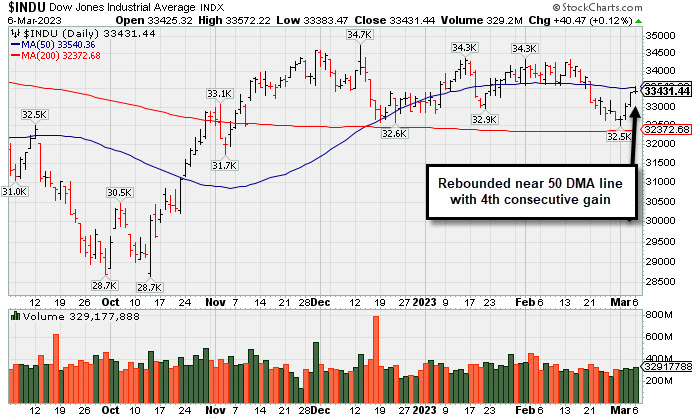
PICTURED: The Dow Jones Industrial Average posted a 4th consecutive gain on Monday and rebounded near its 50-day moving average (DMA) after finding support above its 200-day moving average (DMA) line.
U.S. equities closed mixed Monday after last week’s rally snapped a four-week losing streak. Six of the eleven sectors finished in negative territory with Materials leading laggards. Market participants continue to assess last week’s better-than-expected ISM services and manufacturing data as they prepare for Federal Reserve (Fed) Chair Jerome Powell’s testimony before Congress on Tuesday and Wednesday. Powell is slated to speak before Congress to discuss the current state of inflation and the future route of the central bank’s monetary policy.
On the data front, January’s factory orders came in slightly better-than-expected at a 1.6% decline versus the 1.8% seen in December. Meanwhile, January’s finalized durable goods orders remained unchanged at a 4.5% decline.
U.S. Treasuries weakened, with the yield on the benchmark 10-year note up one basis point (0.01%) to 3.97% while the 30-year bond yield added four basis points (0.04%) to 3.91%. The yield on the two-year note, which is more sensitive to changes in Fed policy, increased two basis points (0.02%) to 4.88%. In commodities, West Texas Intermediate (WTI) crude increased 1.1% to $80.58/barrel amid discussions on supply tightness at the oil conference in Houston, Texas. Elsewhere, oil executives discussed the potential of increased crude prices in the latter half of the year as China’s demand for oil returns. In the metals complex, gold declined 0.1% from its two and a half week high as investors prepare for a busy week of economic data. |
 Kenneth J. Gruneisen started out as a licensed stockbroker in August 1987, a couple of months prior to the historic stock market crash that took the Dow Jones Industrial Average down -22.6% in a single day. He has published daily fact-based fundamental and technical analysis on high-ranked stocks online for two decades. Through FACTBASEDINVESTING.COM, Kenneth provides educational articles, news, market commentary, and other information regarding proven investment systems that work in good times and bad.
Comments contained in the body of this report are technical opinions only and are not necessarily those of Gruneisen Growth Corp. The material herein has been obtained from sources believed to be reliable and accurate, however, its accuracy and completeness cannot be guaranteed. Our firm, employees, and customers may effect transactions, including transactions contrary to any recommendation herein, or have positions in the securities mentioned herein or options with respect thereto. Any recommendation contained in this report may not be suitable for all investors and it is not to be deemed an offer or solicitation on our part with respect to the purchase or sale of any securities. |
|
 |
Retail, Financial,Commodity-Linked Groups and Most Tech Fell
Kenneth J. Gruneisen - Passed the CAN SLIM® Master's Exam
The Bank Index ($BKX -0.41%), Broker/Dealer Index ($XBD -0.88%), and Retail Index ($RLX -0.62%) each lost ground. The Semiconductor Index ($SOX -1.11%) and Biotech Index ($BTK -1.12%) both lost ground while the Networking Index ($NWX +0.34%) eked out a small gain. Commidity-linked groups rounded out the mostly negative session with unanimous losses from the Gold & Silver Index ($XAU -1.78%), Oil Services Index ($OSX -0.79%), and Integrated Oil Index ($XOI -0.34%).
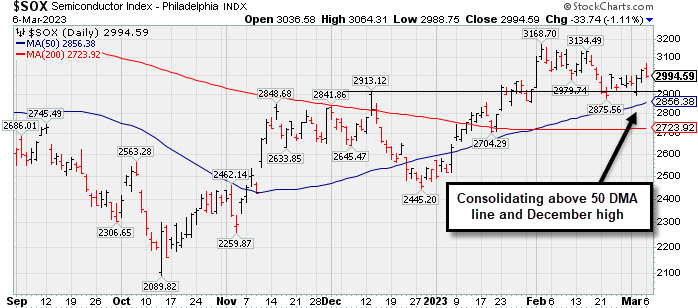
PICTURED: The Semiconductor Index ($SOX -1.11%) has recently been consolidating above its 50-day moving average (DMA) line and above its December high.
| Oil Services |
$OSX |
91.58 |
-0.73 |
-0.79% |
+9.21% |
| Integrated Oil |
$XOI |
1,815.73 |
-6.28 |
-0.34% |
+1.59% |
| Semiconductor |
$SOX |
2,994.59 |
-33.75 |
-1.11% |
+18.26% |
| Networking |
$NWX |
828.80 |
+2.85 |
+0.34% |
+5.81% |
| Broker/Dealer |
$XBD |
494.21 |
-4.40 |
-0.88% |
+10.04% |
| Retail |
$RLX |
2,876.24 |
-17.87 |
-0.62% |
+4.44% |
| Gold & Silver |
$XAU |
116.79 |
-2.11 |
-1.78% |
-3.37% |
| Bank |
$BKX |
108.99 |
-0.45 |
-0.41% |
+8.07% |
| Biotech |
$BTK |
5,347.44 |
-60.81 |
-1.12% |
+1.26% |
|
|
|
 |
Sputtering Below 50-Day Moving Average Line Again
Kenneth J. Gruneisen - Passed the CAN SLIM® Master's Exam
Commercial Metals Co (CMC -$2.13 or -3.92% to $52.16) pulled back today after 3 consecutive volume-driven gains, slumping back below its 50-day moving average (DMA) line ($53.23) and hurting its outlook again. The recent low ($50.90 on 2/24/23) defines the next important near-term support where any more damaging losses would raise greater concerns.
Fundamentals remain strong. CMC has a highest possible 99 Earnings Per Share Rating. It reported Nov '22 quarterly earnings +38% on +12% sales revenues versus the year ago period and prior quarterly comparisons were well above the +25% minimum earnings guideline (C criteria) of the fact-based investment system. Annual earnings growth has been strong. It hails from the Metal Proc & Fabrication group which is currently ranked 23rd on the 197 Industry Groups list (L criteria).
CMC was highlighted in yellow with pivot point cited based on its 8/11/22 high plus 10 cents in the 10/14/22 mid-day report (read here). It was last shown in this FSU section on 2/06/23 with an annotated graph under the headline, "Metals Firm Extended From Base and Perched Near High".
The company has 117.1 million shares outstanding (S criteria). The number of top-rated funds owning its shares rose from 586 in Dec '21 to 670 in Dec '22, a reassuring sign concerning the I criteria. Its current Up/Down Volume Ratio of 1.2 is an unbiased indication its shares have been under accumulation over the past 50 days. It has a Timeliness Rating of A and a Sponsorship Rating of A.
|
|
|
Color Codes Explained :
Y - Better candidates highlighted by our
staff of experts.
G - Previously featured
in past reports as yellow but may no longer be buyable under the
guidelines.
***Last / Change / Volume data in this table is the closing quote data***
Symbol/Exchange
Company Name
Industry Group |
PRICE |
CHANGE
(%Change) |
Day High |
Volume
(% DAV)
(% 50 day avg vol) |
52 Wk Hi
% From Hi |
Featured
Date |
Price
Featured |
Pivot Featured |
|
Max Buy |
 CMC
-
NYSE
CMC
-
NYSE
Commercial Metals Co
METALS and MINING - Steel and Iron
|
$52.16
|
-2.13
-3.92% |
$53.95
|
1,224,143
113.14% of 50 DAV
50 DAV is 1,082,000
|
$58.09
-10.21%
|
10/14/2022
|
$41.61
|
PP = $44.45
|
|
MB = $46.67
|
 Most Recent Note - 3/6/2023 6:27:51 PM
G - Color code is changed to green after slumping back below its 50 DMA line ($53.15) with today's loss following 3 consecutive volume-driven gains. The recent low ($50.90 on 2/24/23) defines important near term support where any more damaging losses would raise greater concerns. Fundamentals remain strong. See the latest FSU analysis for more details and a new annotated grsph.
>>> FEATURED STOCK ARTICLE : Sputtering Below 50-Day Moving Average Line Again - 3/6/2023 |
View all notes |
Set NEW NOTE alert |
Company Profile |
SEC
News |
Chart |
Request a new note
C
A
S
I |
GPK
-
NYSE
Graphic Packaging Hldg
CONSUMER NON-DURABLES - Packaging and Containers
|
$24.19
|
-0.39
-1.59% |
$24.72
|
2,872,926
89.64% of 50 DAV
50 DAV is 3,205,000
|
$24.73
-2.18%
|
10/25/2022
|
$22.75
|
PP = $24.17
|
|
MB = $25.38
|
Most Recent Note - 3/6/2023 6:29:18 PM
Y - Pulled back today breaking a streak of 7 consecutive small gains. Wedged into new all-time high territory with gains lacking great volume conviction. Showed resilience after briefly violating its 50 DMA line on 2/07/23. Members were reminded - "Disciplined investors know that gains above a stock's pivot point must be backed by at least +40% above average volume to trigger a proper technical buy signal."
>>> FEATURED STOCK ARTICLE : Quietly Lingering Near High With Strong Fundamentals - 2/27/2023 |
View all notes |
Set NEW NOTE alert |
Company Profile |
SEC
News |
Chart |
Request a new note
C
A
S
I |
GFF
-
NYSE
Griffon Corporation
MATERIALS and CONSTRUCTION - General Building Materials
|
$36.00
|
-2.01
-5.29% |
$37.98
|
839,880
171.75% of 50 DAV
50 DAV is 489,000
|
$43.74
-17.70%
|
11/10/2022
|
$34.13
|
PP = $35.02
|
|
MB = $36.77
|
Most Recent Note - 3/6/2023 6:35:51 PM
Pulled back today with heavy volume for another damaging loss after meeting resistance at its 50 DMA line. It will be dropped from the Featured Stocks list tonight. A rebound above the 50 DMA line ($38.26) is needed for its outlook to improve. More damaging losses below the recent low ($35.62 on 3/02/23) would raise greater concerns.
>>> FEATURED STOCK ARTICLE : Rose Near 50-Day Moving Average Which May Act as Resistance - 3/3/2023 |
View all notes |
Set NEW NOTE alert |
Company Profile |
SEC
News |
Chart |
Request a new note
C
A
S
I |
TITN
-
NASDAQ
Titan Machinery Inc
SPECIALTY RETAIL
|
$46.38
|
-0.79
-1.67% |
$47.50
|
211,311
99.21% of 50 DAV
50 DAV is 213,000
|
$47.79
-2.95%
|
1/13/2023
|
$40.10
|
PP = $44.45
|
|
MB = $46.67
|
Most Recent Note - 3/3/2023 5:54:50 PM
G - Color code is changed to green after posting a 3rd consecutive gain rising above its "max buy" level for a best-ever close near its all-time high. Its 50 DMA line ($42.63) definies important near-term support to watch on pullbacks.
>>> FEATURED STOCK ARTICLE : Pulled Back from New All-Time High - 2/28/2023 |
View all notes |
Set NEW NOTE alert |
Company Profile |
SEC
News |
Chart |
Request a new note
C
A
S
I |
MYE
-
NYSE
Myers Industries Inc
Containers/Packaging
|
$20.71
|
-0.54
-2.54% |
$21.17
|
493,516
320.26% of 50 DAV
50 DAV is 154,100
|
$26.49
-21.82%
|
12/8/2022
|
$23.94
|
PP = $25.65
|
|
MB = $26.93
|
Most Recent Note - 3/6/2023 6:33:12 PM
Suffered another damaging volume-driven loss today and it will be dropped from the Featured Stocks list tonight. A rebound above the 50 DMA line is needed for its outlook to improve. Bearish action came after it reported Dec '22 quarterly earnings +39% on +7% sales revenues versus the year ago period. See the latest FSU analysis for more details and an annotated graph.
>>> FEATURED STOCK ARTICLE : Damaging Losses Triggered Technical Sell Signals - 3/2/2023 |
View all notes |
Set NEW NOTE alert |
Company Profile |
SEC
News |
Chart |
Request a new note
C
A
S
I |
Symbol/Exchange
Company Name
Industry Group |
PRICE |
CHANGE
(%Change) |
Day High |
Volume
(% DAV)
(% 50 day avg vol) |
52 Wk Hi
% From Hi |
Featured
Date |
Price
Featured |
Pivot Featured |
|
Max Buy |
STRL
-
NASDAQ
Sterling Infrastructure
MATERIALS and; CONSTRUCTION - Heavy Construction
|
$40.46
|
-0.26
-0.64% |
$40.86
|
297,243
108.48% of 50 DAV
50 DAV is 274,000
|
$41.31
-2.06%
|
12/14/2022
|
$32.41
|
PP = $33.72
|
|
MB = $35.41
|
Most Recent Note - 3/6/2023 6:31:09 PM
G - Hovering near its all-time high, extended from the previously noted base. Its 50 DMA line ($35.13) and prior highs in the $34-33 area define important near-term support to watch.
>>> FEATURED STOCK ARTICLE : Sterling Perched Near High, Extended From Prior Base - 2/24/2023 |
View all notes |
Set NEW NOTE alert |
Company Profile |
SEC
News |
Chart |
Request a new note
C
A
S
I |
PERI
-
NASDAQ
Perion Networks Ltd
Comml Svcs-Advertising
|
$35.76
|
+0.98
2.82% |
$36.32
|
962,754
140.34% of 50 DAV
50 DAV is 686,000
|
$35.16
1.71%
|
1/25/2023
|
$31.79
|
PP = $33.19
|
|
MB = $34.85
|
Most Recent Note - 3/6/2023 12:15:10 PM
G - Posting a 4th consecutive gain today without very heavy volume, its color code is changed to green after rising above its "max buy" level and hitting a new 52-week high. Stubbornly held ground and showed resilience. Important suppport to watch is its 50 DMA line ($30.89) and recent low ($29.83 on 2/08/23).
>>> FEATURED STOCK ARTICLE : Perion Stubbornly Holding Ground Near High After Spurt of Gains - 2/22/2023 |
View all notes |
Set NEW NOTE alert |
Company Profile |
SEC
News |
Chart |
Request a new note
C
A
S
I |
ALGM
-
NASDAQ
Allegro Microsystems Inc
Elec-Semiconductor Mfg
|
$45.35
|
-0.05
-0.11% |
$46.90
|
1,643,431
115.65% of 50 DAV
50 DAV is 1,421,000
|
$45.99
-1.39%
|
1/31/2023
|
$37.80
|
PP = $38.38
|
|
MB = $40.30
|
Most Recent Note - 3/6/2023 6:27:41 PM
G - There was a "negative reversal" today while churning higher volume after hitting a new all-time high. It is extended from the previously noted base. Prior high in the $38 area defines initial support to watch on pullbacks.
>>> FEATURED STOCK ARTICLE : Holding its Ground After Rallying From Previously Noted Base - 3/1/2023 |
View all notes |
Set NEW NOTE alert |
Company Profile |
SEC
News |
Chart |
Request a new note
C
A
S
I |
WCC
-
NYSE
Wesco International Inc
WHOLESALE - Electronics Wholesale
|
$171.28
|
-1.41
-0.82% |
$175.00
|
401,860
88.13% of 50 DAV
50 DAV is 456,000
|
$173.00
-0.99%
|
2/10/2023
|
$148.50
|
PP = $147.15
|
|
MB = $154.51
|
Most Recent Note - 3/3/2023 5:55:59 PM
G - Posted a 3rd consecutive gain with below average volume and hit a new all-time high, getting more extended from the previously noted base. Prior highs in the $144-147 area define initial support to watch above its 50 DMA line ($144.88). Reported Dec '22 quarterly earnings +40% on +15% sales revenues versus the year ago period.
>>> FEATURED STOCK ARTICLE : Powered Higher After Recently Highlighted in Feb 10th Report - 2/21/2023 |
View all notes |
Set NEW NOTE alert |
Company Profile |
SEC
News |
Chart |
Request a new note
C
A
S
I |
FIX
-
NYSE
Comfort Systems U S A
MATERIALS and CONSTRUCTION - General Contractors
|
$150.83
|
-0.21
-0.14% |
$151.53
|
269,931
123.26% of 50 DAV
50 DAV is 219,000
|
$152.13
-0.85%
|
2/23/2023
|
$136.52
|
PP = $128.78
|
|
MB = $135.22
|
Most Recent Note - 3/3/2023 5:45:34 PM
G - Hit yet another new high with today's gain adding to an impressive spurt higher, getting more extended from the previously noted base. Prior highs in the $128 area define initial support to watch on pullbacks.
>>> FEATURED STOCK ARTICLE : Powerful Technical Breakout After Earnings Report - 2/23/2023 |
View all notes |
Set NEW NOTE alert |
Company Profile |
SEC
News |
Chart |
Request a new note
C
A
S
I |
Symbol/Exchange
Company Name
Industry Group |
PRICE |
CHANGE
(%Change) |
Day High |
Volume
(% DAV)
(% 50 day avg vol) |
52 Wk Hi
% From Hi |
Featured
Date |
Price
Featured |
Pivot Featured |
|
Max Buy |
|
|
|
THESE ARE NOT BUY RECOMMENDATIONS!
Comments contained in the body of this report are technical
opinions only. The material herein has been obtained
from sources believed to be reliable and accurate, however,
its accuracy and completeness cannot be guaranteed.
This site is not an investment advisor, hence it does
not endorse or recommend any securities or other investments.
Any recommendation contained in this report may not
be suitable for all investors and it is not to be deemed
an offer or solicitation on our part with respect to
the purchase or sale of any securities. All trademarks,
service marks and trade names appearing in this report
are the property of their respective owners, and are
likewise used for identification purposes only.
This report is a service available
only to active Paid Premium Members.
You may opt-out of receiving report notifications
at any time. Questions or comments may be submitted
by writing to Premium Membership Services 665 S.E. 10 Street, Suite 201 Deerfield Beach, FL 33441-5634 or by calling 1-800-965-8307
or 954-785-1121.
|
|
|