You are not logged in.
This means you
CAN ONLY VIEW reports that were published prior to Sunday, April 13, 2025.
You
MUST UPGRADE YOUR MEMBERSHIP if you want to see any current reports.
AFTER MARKET UPDATE - MONDAY, JANUARY 23RD, 2023
Previous After Market Report Next After Market Report >>>
|
|
|
|
DOW |
+254.07 |
33,629.56 |
+0.76% |
|
Volume |
816,048,367 |
-18% |
|
Volume |
5,998,837,700 |
-0% |
|
NASDAQ |
+223.98 |
11,364.41 |
+2.01% |
|
Advancers |
2,179 |
73% |
|
Advancers |
2,917 |
63% |
|
S&P 500 |
+47.20 |
4,019.81 |
+1.19% |
|
Decliners |
814 |
27% |
|
Decliners |
1,691 |
37% |
|
Russell 2000 |
+23.43 |
1,890.77 |
+1.25% |
|
52 Wk Highs |
86 |
|
|
52 Wk Highs |
119 |
|
|
S&P 600 |
+13.49 |
1,236.88 |
+1.10% |
|
52 Wk Lows |
8 |
|
|
52 Wk Lows |
35 |
|
|
 |
Breadth Positive and Leadership Improved as Indices Rose
Kenneth J. Gruneisen - Passed the CAN SLIM® Master's Exam
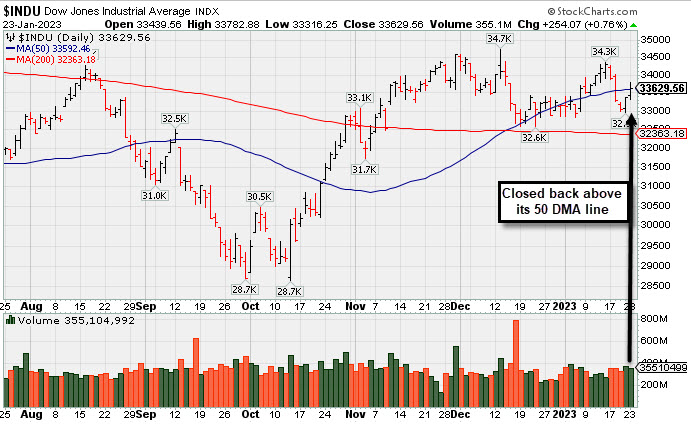
The Nasdaq Composite advanced 2% amid hopes that China’s reopening could benefit some of the beaten-up technology companies. The Dow climbed 254 points, while the S&P 500 added 1.2%, with ten of the eleven sectors finishing in positive territory. Volume totals were lighter than the prior session on the NYSE and on the Nasdaq exchange, a sign of less institutional buying demand. Breadth was positive as advancers led decliners by an 11-4 margin on the NYSE and almost a 2-1 on the Nasdaq exchange. Leadership improved as there were 31 high-ranked companies from the Leaders List that hit new 52-week highs and were listed on the BreakOuts Page versus the total of 8 on the prior session. New 52-week highs totals expanded and outnumbered new 52-week lows on both the NYSE and the Nasdaq exchange. The major indices are in a confirmed uptrend (M criteria). Disciplined investors have a green light for making new buys only in stocks matching all key criteria of the fact-based investment system.
PICTURED: The Dow Jones Industrial Average rose back above its 50-day moving average line with Monday's big gain backed by higher volume.
UU.S. equities finished higher on Monday as the market heads into a busy week of corporate earnings and economic data releases. Meanwhile, investors are currently betting the Federal Reserve (Fed) will slow down the pace of its rate hikes at its next meeting as multiple data releases hint at a weakening economy.
On the data front, Conference Board Leading Economic Index, which is an index comprised of 10 leading economic indicators, fell lower than expected in December to -1% versus -0.7%, marking its tenth consecutive decline since reaching its peak in February. The leading indicators saw a widespread deterioration in labor markets, manufacturing, housing construction, and financial markets, signaling a potential slowdown in growth.
Treasuries continued to weaken as market participants continue to assess the central bank’s monetary policy ahead of their meeting later this month. The yield on the benchmark 10-year note up four basis points (0.04%) to 3.52%, while the 30-year bond yield climbed four basis points (0.04%) to 3.69%. The two-year note, which is more sensitive to changes in Fed policy, advanced six basis points (0.06%) to 4.23%. In commodities, West Texas Intermediate Crude Oil (WTI) is little changed at $81.65/barrel as it holds steady around its seven-week high amid a stronger economic outlook on the world’s top oil importer, China, as the country continues to reopen its borders.
|
 Kenneth J. Gruneisen started out as a licensed stockbroker in August 1987, a couple of months prior to the historic stock market crash that took the Dow Jones Industrial Average down -22.6% in a single day. He has published daily fact-based fundamental and technical analysis on high-ranked stocks online for two decades. Through FACTBASEDINVESTING.COM, Kenneth provides educational articles, news, market commentary, and other information regarding proven investment systems that work in good times and bad.
Comments contained in the body of this report are technical opinions only and are not necessarily those of Gruneisen Growth Corp. The material herein has been obtained from sources believed to be reliable and accurate, however, its accuracy and completeness cannot be guaranteed. Our firm, employees, and customers may effect transactions, including transactions contrary to any recommendation herein, or have positions in the securities mentioned herein or options with respect thereto. Any recommendation contained in this report may not be suitable for all investors and it is not to be deemed an offer or solicitation on our part with respect to the purchase or sale of any securities. |
|
 |
Tech and Financial Indexes Led Group Gainers
Kenneth J. Gruneisen - Passed the CAN SLIM® Master's Exam
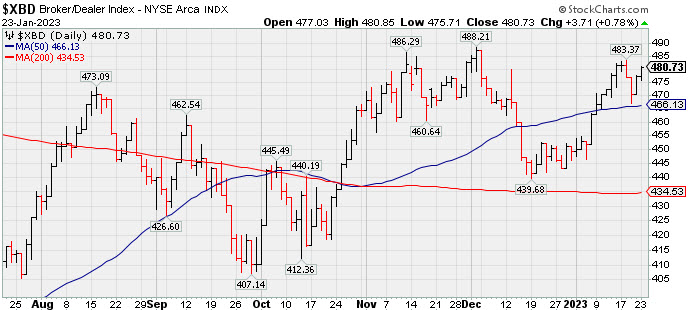
The Bank Index ($BKX +2.10%) and Broker/Dealer Index ($XBD +0.78%) both posted influential gains and the Retail Index ($RLX +0.45%) also edged higher. The Semiconductor Index ($SOX +5.01%) led the tech sector higher and the Networking Index ($NWX +2.06%) notched a solid gain while the Biotech Index ($BTK +0.48%) also edged higher. The Gold & Silver Index ($XAU -0.12%) and Oil Services Index ($OSX -0.04%) were little changed and the Integrated Oil Index ($XOI +0.27%) inched higher.
PICTURED: The Broker/Dealer Index ($XBD +0.78%) is consolidating above its 50-day moving average (DMA) line and has recently been rising near the prior high. Longtime members know that the financial indexes have served as reliable and very important leading indicators. Subsequent gains above the prior high would be a very reassuring sign for the broader market outlook.
| Oil Services |
$OSX |
91.03 |
-0.03 |
-0.04% |
+8.55% |
| Integrated Oil |
$XOI |
1,882.95 |
+5.15 |
+0.27% |
+5.35% |
| Semiconductor |
$SOX |
2,934.83 |
+140.14 |
+5.01% |
+15.90% |
| Networking |
$NWX |
823.40 |
+16.61 |
+2.06% |
+5.12% |
| Broker/Dealer |
$XBD |
480.73 |
+3.71 |
+0.78% |
+7.04% |
| Retail |
$RLX |
2,962.62 |
+13.16 |
+0.45% |
+7.58% |
| Gold & Silver |
$XAU |
135.50 |
-0.17 |
-0.12% |
+12.11% |
| Bank |
$BKX |
109.32 |
+2.25 |
+2.10% |
+8.40% |
| Biotech |
$BTK |
5,554.95 |
+26.54 |
+0.48% |
+5.19% |
|
|
|
 |
Decisive Sell Signal Triggered by Considerable Loss on Heavy Volume
Kenneth J. Gruneisen - Passed the CAN SLIM® Master's Exam
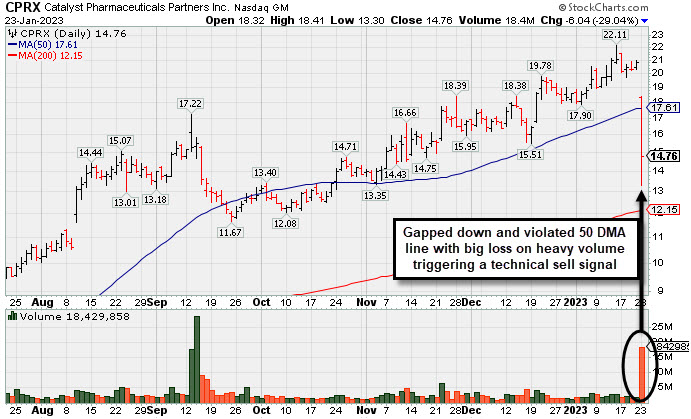
Catalyst Pharma Inc (CPRX -$6.04 or -29.04% to $14.76) gapped down today and violated its 50-day moving average (DMA) line ($17.61) with a considerable loss backed by +642% above average volume triggering a decisive technical sell signal. When any stock suffers its largest loss ever backed by the heaviest volume it is considered a technical sell signal. Only a prompt rebound above the 50 DMA line would help its outlook improve.
CPRX finished strong after highlighted in yellow with new pivot point cited based on its 11/11/22 high in the 11/22/22 mid-day report (read here). It was shown in this FSU section on 1/11/23 with an annotated graph under the headline, "Making Gradual Progress Hitting Another New High".
It has an Earnings Per Share rating of 99. Recently it reported Sep '22 quarterly earnings +86% on +59% sales revenues versus the year ago period, its 4th consecutive quarterly comparison above the +25% minimum earnings guideline (C criteria). Annual earnings (A criteria) growth has been strong since turning profitable in FY '19.
The Medical-Biomed/Biotech industry group is currently ranked 17th on the 197 Industry Groups list, a reassuring sign concerning the L criteria. It has only 88.5 million shares in the public float. The number of top-rated funds owning its shares rose from 311 in Sep '21 to 412 in Dec '22, a reassuring sign concerning the I criteria. Its current Up/Down Volume Ratio of 1.3 is an unbiased indication its shares have been under accumulation over the past 50 days.
|
|
|
Color Codes Explained :
Y - Better candidates highlighted by our
staff of experts.
G - Previously featured
in past reports as yellow but may no longer be buyable under the
guidelines.
***Last / Change / Volume data in this table is the closing quote data***
Symbol/Exchange
Company Name
Industry Group |
PRICE |
CHANGE
(%Change) |
Day High |
Volume
(% DAV)
(% 50 day avg vol) |
52 Wk Hi
% From Hi |
Featured
Date |
Price
Featured |
Pivot Featured |
|
Max Buy |
 CMC
-
NYSE
CMC
-
NYSE
Commercial Metals Co
METALS and MINING - Steel and Iron
|
$51.87
|
-0.28
-0.54% |
$52.61
|
1,141,805
109.89% of 50 DAV
50 DAV is 1,039,000
|
$56.88
-8.81%
|
10/14/2022
|
$41.61
|
PP = $44.45
|
|
MB = $46.67
|
 Most Recent Note - 1/23/2023 6:38:38 PM
G - Held its ground again today after pulling back from its 52-week high last week. Its 50 DMA line ($49.40) defines important near-term support to watch on pullbacks. Fundamentals remain strong.
>>> FEATURED STOCK ARTICLE : Pulling Back After Rallying From 50-Day Moving Average Line - 1/18/2023 |
View all notes |
Set NEW NOTE alert |
Company Profile |
SEC
News |
Chart |
Request a new note
C
A
S
I |
GPK
-
NYSE
Graphic Packaging Hldg
CONSUMER NON-DURABLES - Packaging and Containers
|
$22.70
|
+0.14
0.62% |
$22.99
|
2,751,533
93.86% of 50 DAV
50 DAV is 2,931,600
|
$24.07
-5.69%
|
10/25/2022
|
$22.75
|
PP = $24.17
|
|
MB = $25.38
|
Most Recent Note - 1/23/2023 6:45:11 PM
Y - Showed resilience and it is consolidating above its 50 and 200 DMA lines. Losses back below them would raise concerns and trigger technical sell signals . Faces some resistance due to overhead supply up to the $24 level. Fundamentals remain strong.
>>> FEATURED STOCK ARTICLE : Found Support at 200-Day Moving Average and Still Faces Resistance - 1/10/2023 |
View all notes |
Set NEW NOTE alert |
Company Profile |
SEC
News |
Chart |
Request a new note
C
A
S
I |
GFF
-
NYSE
Griffon Corporation
MATERIALS and CONSTRUCTION - General Building Materials
|
$38.75
|
+0.75
1.97% |
$38.98
|
309,376
63.14% of 50 DAV
50 DAV is 490,000
|
$40.74
-4.88%
|
11/10/2022
|
$34.13
|
PP = $35.02
|
|
MB = $36.77
|
Most Recent Note - 1/23/2023 6:46:59 PM
G - Showed resilience and volume totals have cooled following a "negative reversal" at its 52-week high on 1/18/23. Its 50 DMA line ($35.88) defines near-term support above recent lows in the $33.82 area. Reported Sep '22 quarterly earnings +230% on +24% sales revenues versus the year ago period.
>>> FEATURED STOCK ARTICLE : Showed Resilience Following Negative Reversal at 52-Week High - 1/19/2023 |
View all notes |
Set NEW NOTE alert |
Company Profile |
SEC
News |
Chart |
Request a new note
C
A
S
I |
CPRX
-
NASDAQ
Catalyst Pharma Inc
Medical-Biomed/Biotech
|
$14.76
|
-6.04
-29.04% |
$18.41
|
18,428,773
746.10% of 50 DAV
50 DAV is 2,470,000
|
$22.11
-33.24%
|
11/22/2022
|
$17.38
|
PP = $16.66
|
|
MB = $17.49
|
Most Recent Note - 1/23/2023 6:40:32 PM
G - Abruptly retreated from its 52-week high with today's gap down and considerable volume-driven loss violating its 50 DMA line ($17.61) triggering a technical sell signal. See the latest FSU analysis for more details and a new annotated graph.
>>> FEATURED STOCK ARTICLE : Decisive Sell Signal Triggered by Considerable Loss on Heavy Volume - 1/23/2023 |
View all notes |
Set NEW NOTE alert |
Company Profile |
SEC
News |
Chart |
Request a new note
C
A
S
I |
TITN
-
NASDAQ
Titan Machinery Inc
SPECIALTY RETAIL
|
$40.89
|
+0.29
0.71% |
$41.64
|
156,677
65.56% of 50 DAV
50 DAV is 239,000
|
$44.35
-7.80%
|
1/13/2023
|
$40.10
|
PP = $44.45
|
|
MB = $46.67
|
Most Recent Note - 1/20/2023 10:34:35 PM
Y - Posted a gain today with lighter volume. The prior high in the $38 area defines important support to watch along with its 50 DMA line ($38.69)..A new pivot point was recently cited based on its 12/01/22 high plus 10 cents.
>>> FEATURED STOCK ARTICLE : Forming New Base for Past 7 Weeks - 1/13/2023 |
View all notes |
Set NEW NOTE alert |
Company Profile |
SEC
News |
Chart |
Request a new note
C
A
S
I |
Symbol/Exchange
Company Name
Industry Group |
PRICE |
CHANGE
(%Change) |
Day High |
Volume
(% DAV)
(% 50 day avg vol) |
52 Wk Hi
% From Hi |
Featured
Date |
Price
Featured |
Pivot Featured |
|
Max Buy |
MYE
-
NYSE
Myers Industries Inc
Containers/Packaging
|
$23.70
|
-0.18
-0.75% |
$23.75
|
116,960
70.46% of 50 DAV
50 DAV is 166,000
|
$25.55
-7.24%
|
12/8/2022
|
$23.94
|
PP = $25.65
|
|
MB = $26.93
|
Most Recent Note - 1/20/2023 10:32:54 PM
Y - Posted a quiet gain today after a "positive reversal" on the prior session. Its 50 DMA line ($22.82) defines near-term support to watch. Faces little resistance due to overhead supply up to the $25.50 level. See the latest FSU analysis for more details and a new annotated graph.
>>> FEATURED STOCK ARTICLE : Myers Quietly Consolidating Within Striking Distance of Prior High - 1/20/2023 |
View all notes |
Set NEW NOTE alert |
Company Profile |
SEC
News |
Chart |
Request a new note
C
A
S
I |
BOX
-
NYSE
Box Inc Cl A
Computer Sftwr-Database
|
$31.53
|
+0.54
1.74% |
$31.64
|
895,435
66.97% of 50 DAV
50 DAV is 1,337,000
|
$33.04
-4.57%
|
12/12/2022
|
$29.83
|
PP = $29.57
|
|
MB = $31.05
|
Most Recent Note - 1/23/2023 6:37:39 PM
Y - Posted a gain with light volume challenging recent highs in the $31-32 area. Its 50 DMA line ($29.59) defines important near-term support to watch. Faces very little resistance due to overhead supply up to the $32 level. Quarterly and annual earnings increases have been strong and steady.
>>> FEATURED STOCK ARTICLE : Pulled Back After Perched Near All-Time High - 1/6/2023 |
View all notes |
Set NEW NOTE alert |
Company Profile |
SEC
News |
Chart |
Request a new note
C
A
S
I |
STRL
-
NASDAQ
Sterling Infrastructure
MATERIALS and; CONSTRUCTION - Heavy Construction
|
$32.72
|
+0.68
2.12% |
$33.02
|
424,443
204.06% of 50 DAV
50 DAV is 208,000
|
$34.86
-6.14%
|
12/14/2022
|
$32.41
|
PP = $33.72
|
|
MB = $35.41
|
Most Recent Note - 1/23/2023 1:21:13 PM
Y - Rebounding back above its 50 DMA line ($32.12) with today's 2nd consecutive volume-driven gain. Faces some resistance up to the $34.86 level after its recent failed breakout attempt. Highlighted in yellow with pivot point cited based on its 11/08/22 high plus 10 cents in the 12/14/22 mid-day report. Confirming volume-driven gains for a new high would be a reassuring sign of fresh institutional buying demand.
>>> FEATURED STOCK ARTICLE : Finding Support Near 50-Day Moving Average After Failed Breakout Attempt - 1/9/2023 |
View all notes |
Set NEW NOTE alert |
Company Profile |
SEC
News |
Chart |
Request a new note
C
A
S
I |
|
|
|
THESE ARE NOT BUY RECOMMENDATIONS!
Comments contained in the body of this report are technical
opinions only. The material herein has been obtained
from sources believed to be reliable and accurate, however,
its accuracy and completeness cannot be guaranteed.
This site is not an investment advisor, hence it does
not endorse or recommend any securities or other investments.
Any recommendation contained in this report may not
be suitable for all investors and it is not to be deemed
an offer or solicitation on our part with respect to
the purchase or sale of any securities. All trademarks,
service marks and trade names appearing in this report
are the property of their respective owners, and are
likewise used for identification purposes only.
This report is a service available
only to active Paid Premium Members.
You may opt-out of receiving report notifications
at any time. Questions or comments may be submitted
by writing to Premium Membership Services 665 S.E. 10 Street, Suite 201 Deerfield Beach, FL 33441-5634 or by calling 1-800-965-8307
or 954-785-1121.
|
|
|