You are not logged in.
This means you
CAN ONLY VIEW reports that were published prior to Thursday, March 20, 2025.
You
MUST UPGRADE YOUR MEMBERSHIP if you want to see any current reports.
AFTER MARKET UPDATE - FRIDAY, DECEMBER 1ST, 2023
Previous After Market Report Next After Market Report >>>
|
|
|
|
DOW |
+294.61 |
36,245.50 |
+0.82% |
|
Volume |
1,027,599,964 |
-47% |
|
Volume |
5,761,230,600 |
-0% |
|
NASDAQ |
+78.81 |
14,305.03 |
+0.55% |
|
Advancers |
2,398 |
85% |
|
Advancers |
3,269 |
75% |
|
S&P 500 |
+26.83 |
4,594.63 |
+0.59% |
|
Decliners |
412 |
15% |
|
Decliners |
1,067 |
25% |
|
Russell 2000 |
+53.62 |
1,862.64 |
+2.96% |
|
52 Wk Highs |
175 |
|
|
52 Wk Highs |
165 |
|
|
S&P 600 |
+33.86 |
1,204.52 |
+2.89% |
|
52 Wk Lows |
14 |
|
|
52 Wk Lows |
101 |
|
|
 |
Breadth Positive as Indices Rally Without Great Volume Conviction
Kenneth J. Gruneisen - Passed the CAN SLIM® Master's Exam
23 of the 30 Dow components posted gains on Friday. The Invesco S&P 500 Equal Weight ETF (RSP) jumped 1.5% versus a 0.6% gain in the market-cap weighted S&P 500. The S&P 500 Index closed at its best level since March 2022. The Nasdaq Composite and Dow Jones Industrial Average registered gains of 0.6% and 0.8%, respectively, while the Russell 2000 jumped 3.0%. Volume totals were lighter than the prior session on the NYSE and nearly even with the prior session total on the Nasdaq exchange. Breadth was clearly positive as advancers led decliners by almost a 6-1 margin on the NYSE and by a 3-1 margin on the Nasdaq exchange. There were 110 high-ranked companies from the Leaders List that hit new 52-week highs and were listed on the BreakOuts Page, up considerably from the total of 57 on the prior session. New 52-week highs outnumbered shrinking new 52-week lows on the NYSE and on the Nasdaq exchange. The major indices are in a confirmed uptrend (M criteria). New buying efforts should be only made in stocks fitting all key criteria of the fact-based investment system.
PICTURED: The S&P 500 Index posted a gain on Friday for its best-ever close for 2023. The action may be considered an encouraging sign. However, the 2.5 year graph illustrates the longer-term period over which the market's benchmark index has consolidated since its January 2022 all-time high. The communication services (-0.2%) and information technology (+0.2%) sectors underperformed as ten of the 11 S&P 500 sectors closed higher. The rate-sensitive real estate sector (+2.1%) saw the largest gain. The 2-yr note yield sank 14 basis points to 4.56% and the 10-yr note yield settled 13 basis points lower at 4.23%.
Mr. Powell said "It would be premature to conclude with confidence that we have achieved a sufficiently restrictive stance, or to speculate on when policy might ease." Meanwhile, S&P Global U.S. Manufacturing PMI was unchanged from the flash November reading, the Manufacturing PMI from the ISM Institute reflected contracting activity at a pace that was unchanged from October, and the Construction Spending report for October was stronger than expected.
|
 Kenneth J. Gruneisen started out as a licensed stockbroker in August 1987, a couple of months prior to the historic stock market crash that took the Dow Jones Industrial Average down -22.6% in a single day. He has published daily fact-based fundamental and technical analysis on high-ranked stocks online for two decades. Through FACTBASEDINVESTING.COM, Kenneth provides educational articles, news, market commentary, and other information regarding proven investment systems that work in good times and bad.
Comments contained in the body of this report are technical opinions only and are not necessarily those of Gruneisen Growth Corp. The material herein has been obtained from sources believed to be reliable and accurate, however, its accuracy and completeness cannot be guaranteed. Our firm, employees, and customers may effect transactions, including transactions contrary to any recommendation herein, or have positions in the securities mentioned herein or options with respect thereto. Any recommendation contained in this report may not be suitable for all investors and it is not to be deemed an offer or solicitation on our part with respect to the purchase or sale of any securities. |
|
 |
Retail, Financial, Tech, and Commodity-Linked Groups Rose
Kenneth J. Gruneisen - Passed the CAN SLIM® Master's Exam
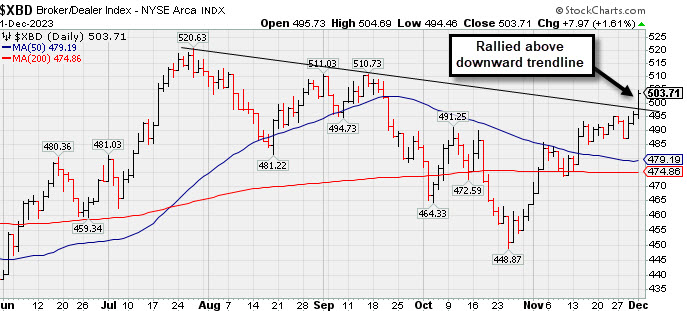
The Bank Index ($BKX +2.74%) and the Broker/Dealer Index ($XBD +1.22%) posted influential gains that helped the major indices rise. The Retail Index ($RLX +1.22%) and the tech sector had a positive bias as the Biotech Index ($BTK +1.47%) and Networking Index ($NWX +2.77%) each outpaced the Semiconductor Index ($SOX +0.37%) lost ground. Commodity-linked groups rounded out the positiev session as the Gold & Silver Index ($XAU +1.98%) outpaced the Integrated Oil Index ($XOI +0.34%) and the Oil Servicesd Indedx ($OSX +0.98%).
PICTURED: The Broker/Dealer Index ($XBD +1.22%) rallied above a multi-month downward trendline with Friday's solid 3rd consecutive gain. Longterm readers may note that the technical improvement bodes well for the broader market outlook because the financial indexes have a history of being reliable leading indicators.
| Oil Services |
$OSX |
82.73 |
+0.80 |
+0.98% |
-1.35% |
| Integrated Oil |
$XOI |
1,858.27 |
+6.39 |
+0.34% |
+3.97% |
| Semiconductor |
$SOX |
3,738.27 |
+13.68 |
+0.37% |
+47.63% |
| Networking |
$NWX |
747.16 |
+20.12 |
+2.77% |
-4.61% |
| Broker/Dealer |
$XBD |
503.71 |
+7.97 |
+1.61% |
+12.15% |
| Retail |
$RLX |
3,723.52 |
+44.74 |
+1.22% |
+35.20% |
| Gold & Silver |
$XAU |
125.80 |
+2.45 |
+1.98% |
+4.08% |
| Bank |
$BKX |
87.26 |
+2.32 |
+2.74% |
-13.48% |
| Biotech |
$BTK |
4,923.58 |
+71.19 |
+1.47% |
-6.77% |
|
|
|
 |
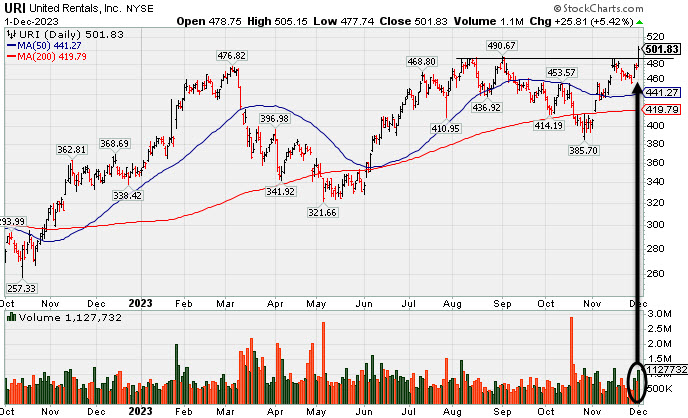
New Breakout For United Rentals
Kenneth J. Gruneisen - Passed the CAN SLIM® Master's Exam
United Rentals Inc (URI +$25.81 or +5.42% to $501.83) finished strong after highlighted in yellow in the earlier mid-day report (read here) with new pivot point cited based on its 11/15/23 high after a cup-with-handle base. It hit a new 52-week high with today's big gain clearing prior resistance in the $488-492 area. The gain above the pivot point backed by +51% above average volume triggered a proper technical buy signal.
URI has a 96 Earnings Per Share Rating. Through Sep '23 its quarterly earnings increases versus the year ago periods have been above the +25% minimum guideline (C criteria). Annual earnings (A criteria) history had a downturn in FY '20 like many companies during the pandemic. Consensus estimates for FY '23 and '24 have been increasing, an encouraging sign.
The number of top-rated funds owning its shares reportedly fell from 2,266 in Mar '23 to 2,188 in Sep '23, not a reassuring sign concerning the I criteria. Its current Up/Down Volume Ratio of 0.8 is also an unbiased indication its shares have been under distributional pressure over the past 50 days. Follow-through gains would be a rerassuring sign of fresh institutional buying demand that could lead to a meaningful advance in price.
|
|
|
Color Codes Explained :
Y - Better candidates highlighted by our
staff of experts.
G - Previously featured
in past reports as yellow but may no longer be buyable under the
guidelines.
***Last / Change / Volume data in this table is the closing quote data***
Symbol/Exchange
Company Name
Industry Group |
PRICE |
CHANGE
(%Change) |
Day High |
Volume
(% DAV)
(% 50 day avg vol) |
52 Wk Hi
% From Hi |
Featured
Date |
Price
Featured |
Pivot Featured |
|
Max Buy |
 ANET
-
NYSE
ANET
-
NYSE
Arista Networks
Computer-Networking
|
$216.64
|
-3.07
-1.40% |
$219.01
|
1,645,038
75.81% of 50 DAV
50 DAV is 2,170,000
|
$223.52
-3.08%
|
10/31/2023
|
$188.84
|
PP = $198.80
|
|
MB = $208.74
|
Most Recent Note - 11/30/2023 5:11:31 PM
G - Posted a gain today with average volume for another best-ever close. Prior highs in the $198 area define near-term support above its 50 DMA line ($198.41). Fundamentals remain strong.
>>> FEATURED STOCK ARTICLE : Powerful Gain Following Earnings Report for Arista Networks - 10/31/2023 |
View all notes |
Set NEW NOTE alert |
Company Profile |
SEC
News |
Chart |
Request a new note
C
A
S
I |
NVO
-
NYSE
Novo Nordisk ADR
Medical-Ethical Drugs
|
$100.39
|
-1.45
-1.42% |
$101.76
|
4,567,522
95.49% of 50 DAV
50 DAV is 4,783,000
|
$105.69
-5.01%
|
11/2/2023
|
$100.97
|
PP = $104.10
|
|
MB = $109.31
|
 Most Recent Note - 12/1/2023 10:07:59 PM
Y - Pulled back from its 52-week high with losses this week. Its 50 DMA line ($97.61) defines near-term support to watch. It has been repeatedly noted - "Subsequent gains for new highs backed by at least +40% above average volume are needed to trigger a technical buy signal."
>>> FEATURED STOCK ARTICLE : Approaching Prior High With Strong Fundamentals - 11/2/2023 |
View all notes |
Set NEW NOTE alert |
Company Profile |
SEC
News |
Chart |
Request a new note
C
A
S
I |
QLYS
-
NASDAQ
Qualys
Computer Sftwr-Security
|
$188.01
|
+3.17
1.71% |
$188.37
|
371,724
106.51% of 50 DAV
50 DAV is 349,000
|
$185.09
1.58%
|
11/3/2023
|
$167.50
|
PP = $165.03
|
|
MB = $173.28
|
Most Recent Note - 11/30/2023 5:18:07 PM
G - Posted a small gain today and closed near the session high with above-average volume for a new all-time high. Prior high ($165) defines initial support to watch on pullbacks.
>>> FEATURED STOCK ARTICLE : Powerful Breakout for Qualys - 11/3/2023 |
View all notes |
Set NEW NOTE alert |
Company Profile |
SEC
News |
Chart |
Request a new note
C
A
S
I |
AXON
-
NASDAQ
Axon Enterprise
Security/Sfty
|
$231.45
|
+1.58
0.69% |
$233.80
|
850,416
187.73% of 50 DAV
50 DAV is 453,000
|
$231.71
-0.11%
|
11/8/2023
|
$127.84
|
PP = $223.30
|
|
MB = $234.47
|
Most Recent Note - 11/30/2023 5:16:17 PM
Y - Posted a gain today with above-average volume and closed near the session high for a best-ever close. The recent low ($212.89 on 11/09/23) defines near-term support above its 50 DMA line ($212).
>>> FEATURED STOCK ARTICLE : Breakout for Axon as it Returns to Featured Stocks List - 11/8/2023 |
View all notes |
Set NEW NOTE alert |
Company Profile |
SEC
News |
Chart |
Request a new note
C
A
S
I |
TDG
-
NYSE
TransDigm Group
Aerospace/Defense
|
$970.27
|
+7.40
0.77% |
$974.75
|
162,098
65.63% of 50 DAV
50 DAV is 247,000
|
$1,013.08
-4.23%
|
11/9/2023
|
$982.68
|
PP = $940.10
|
|
MB = $987.11
|
Most Recent Note - 11/30/2023 5:19:06 PM
G - Posted a gain today with average volume. Consolidating after briefly trading above the $1,000 threshold. Fundamentals remain strong. Prior high ($940) defines initial support to watch on pullbacks.
>>> FEATURED STOCK ARTICLE : TransDigm's Big Gap Up Gain Triggered Technical Buy Signal - 11/9/2023 |
View all notes |
Set NEW NOTE alert |
Company Profile |
SEC
News |
Chart |
Request a new note
C
A
S
I |
Symbol/Exchange
Company Name
Industry Group |
PRICE |
CHANGE
(%Change) |
Day High |
Volume
(% DAV)
(% 50 day avg vol) |
52 Wk Hi
% From Hi |
Featured
Date |
Price
Featured |
Pivot Featured |
|
Max Buy |
PANW
-
NASDAQ
Palo Alto Networks
Computer Sftwr-Security
|
$296.16
|
+1.07
0.36% |
$296.85
|
6,156,816
157.06% of 50 DAV
50 DAV is 3,920,000
|
$296.16
0.00%
|
11/13/2023
|
$255.90
|
PP = $266.00
|
|
MB = $279.30
|
Most Recent Note - 12/1/2023 12:48:21 PM
G - Today's 6th consecutive gain with ever-increasing volume has it reaching yet another new all-time high. Prior highs in the $265 area define initial support to watch above its 50 DMA line ($250.80). Fundamentals remain strong after it reported Oct '23 quarterly earnings +66% on +20% sales revenues versus the year-ago period.
>>> FEATURED STOCK ARTICLE : Earnings New Due While Perched Near Prior High - 11/13/2023 |
View all notes |
Set NEW NOTE alert |
Company Profile |
SEC
News |
Chart |
Request a new note
C
A
S
I |
URI
-
NYSE
United Rentals
Comml Svcs-Leasing
|
$501.83
|
+25.81
5.42% |
$505.16
|
1,127,732
151.99% of 50 DAV
50 DAV is 742,000
|
$492.33
1.93%
|
12/1/2023
|
$499.51
|
PP = $488.73
|
|
MB = $513.17
|
Most Recent Note - 12/1/2023 10:05:29 PM
Y - Finished strong today after highlighted in yellow with new pivot point cited based on its 11/15/23 high after a cup-with-handle base. Gain above the pivot point backed by +51% above average volume triggered a proper technical buy signal. Through Sep '23 its quarterly earnings increases versus the year-ago periods have been above the +25% minimum guideline (C criteria). Annual earnings (A criteria) history had a downturn in FY '20 like many companies during the pandemic. See the latest FSU analysis for more details and a new annotated graph.
>>> FEATURED STOCK ARTICLE : New Breakout For United Rentals - 12/1/2023 |
View all notes |
Set NEW NOTE alert |
Company Profile |
SEC
News |
Chart |
Request a new note
C
A
S
I |
|
|
|
THESE ARE NOT BUY RECOMMENDATIONS!
Comments contained in the body of this report are technical
opinions only. The material herein has been obtained
from sources believed to be reliable and accurate, however,
its accuracy and completeness cannot be guaranteed.
This site is not an investment advisor, hence it does
not endorse or recommend any securities or other investments.
Any recommendation contained in this report may not
be suitable for all investors and it is not to be deemed
an offer or solicitation on our part with respect to
the purchase or sale of any securities. All trademarks,
service marks and trade names appearing in this report
are the property of their respective owners, and are
likewise used for identification purposes only.
This report is a service available
only to active Paid Premium Members.
You may opt-out of receiving report notifications
at any time. Questions or comments may be submitted
by writing to Premium Membership Services 665 S.E. 10 Street, Suite 201 Deerfield Beach, FL 33441-5634 or by calling 1-800-965-8307
or 954-785-1121.
|
|
|