You are not logged in.
This means you
CAN ONLY VIEW reports that were published prior to Saturday, April 5, 2025.
You
MUST UPGRADE YOUR MEMBERSHIP if you want to see any current reports.
AFTER MARKET UPDATE - THURSDAY, NOVEMBER 9TH, 2023
Previous After Market Report Next After Market Report >>>
|
|
|
|
DOW |
-220.33 |
33,891.94 |
-0.65% |
|
Volume |
899,295,463 |
+1% |
|
Volume |
5,339,576,300 |
+13% |
|
NASDAQ |
-128.97 |
13,521.45 |
-0.94% |
|
Advancers |
709 |
25% |
|
Advancers |
1,123 |
26% |
|
S&P 500 |
-35.43 |
4,347.35 |
-0.81% |
|
Decliners |
2,088 |
75% |
|
Decliners |
3,142 |
74% |
|
Russell 2000 |
-26.83 |
1,687.24 |
-1.57% |
|
52 Wk Highs |
44 |
|
|
52 Wk Highs |
48 |
|
|
S&P 600 |
-14.89 |
1,103.24 |
-1.33% |
|
52 Wk Lows |
86 |
|
|
52 Wk Lows |
329 |
|
|
 |
Major Indices Fell as Breadth Turned Negative
Kenneth J. Gruneisen - Passed the CAN SLIM® Master's Exam
The Dow Jones Industrial Average logged the smallest decline among the major indices thanks to a big gain in Disney (DIS +6.91%) after reporting earnings. The volume totals were higher than the prior session on the NYSE and on the Nasdaq exchange. Decliners led advancers by a 3-1 margin on the NYSE and by nearly 3-1 on the Nasdaq exchange. There were 35 high-ranked companies from the Leaders List that hit new 52-week highs and were listed on the BreakOuts Page, versus the total of 30 on the prior session. New 52-week lows totals expanded and solidly outnumbered shrinking new 52-week highs on the NYSE and on the Nasdaq exchange. The major indices recently signaled a new confirmed uptrend for the market (M criteria). New buying efforts should be only made in stocks fitting all key criteria of the fact-based investment system.
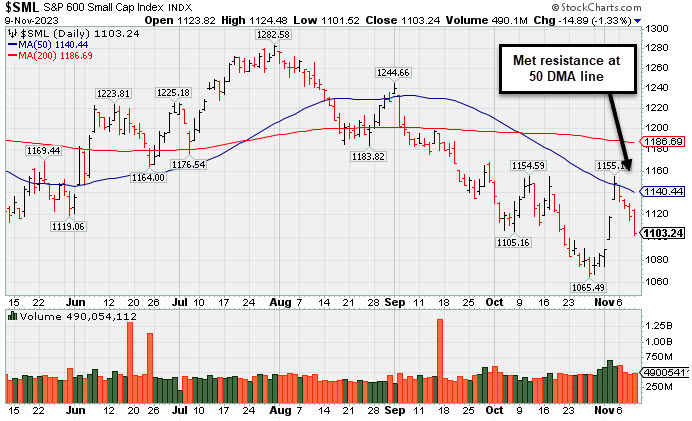
PICTURED: The S&P 600 Small Cap Index met resistance at its 50-day moving average (DMA) line and has slumped toward the prior low.
The 10-yr note yield settled at 4.63%, and the 30-yr bond yield settled at 4.78% as the latest $24 billion 30-yr bond auction showed weak demand. Including Thursday's losses, the S&P 500 and Nasdaq Composite are still up 3.7% and 5.2%, respectively, so far in November.
|
 Kenneth J. Gruneisen started out as a licensed stockbroker in August 1987, a couple of months prior to the historic stock market crash that took the Dow Jones Industrial Average down -22.6% in a single day. He has published daily fact-based fundamental and technical analysis on high-ranked stocks online for two decades. Through FACTBASEDINVESTING.COM, Kenneth provides educational articles, news, market commentary, and other information regarding proven investment systems that work in good times and bad.
Comments contained in the body of this report are technical opinions only and are not necessarily those of Gruneisen Growth Corp. The material herein has been obtained from sources believed to be reliable and accurate, however, its accuracy and completeness cannot be guaranteed. Our firm, employees, and customers may effect transactions, including transactions contrary to any recommendation herein, or have positions in the securities mentioned herein or options with respect thereto. Any recommendation contained in this report may not be suitable for all investors and it is not to be deemed an offer or solicitation on our part with respect to the purchase or sale of any securities. |
|
 |
Retail, Financial, and Biotech Indexes Led Group Decliners
Kenneth J. Gruneisen - Passed the CAN SLIM® Master's Exam
The Retail Index ($RLX -1.16%), Bank Index ($BKX -1.46%), and the Broker/Dealer Index ($XBD -0.51%) each lost ground. The tech sector had a negative bias as the Biotech Index ($BTK -2.40%) outpaced the Semiconductor Index ($SOX -0.59%) to the dowside while the Networking Index ($NWX +0.63%) edged higher. Commodity-linked groups had a slightly negative bias as the Gold & Silver Index ($XAU -0.25%), Integrated Oil Index ($XOI -0.19%), and the Oil Services Index ($OSX -0.22%) each ended slightly lower.
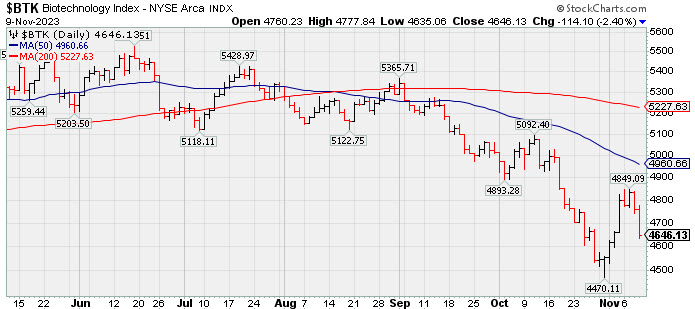
PICTURED: The Biotech Index ($BTK -2.40%) has slumped after its rebound fell short of its 50-day moving average (DMA) line.
| Oil Services |
$OSX |
83.43 |
-0.19 |
-0.22% |
-0.51% |
| Integrated Oil |
$XOI |
1,796.17 |
-3.38 |
-0.19% |
+0.50% |
| Semiconductor |
$SOX |
3,452.34 |
-20.34 |
-0.59% |
+36.34% |
| Networking |
$NWX |
687.19 |
+4.31 |
+0.63% |
-12.27% |
| Broker/Dealer |
$XBD |
473.97 |
-2.44 |
-0.51% |
+5.53% |
| Retail |
$RLX |
3,531.56 |
-41.43 |
-1.16% |
+28.23% |
| Gold & Silver |
$XAU |
108.89 |
-0.27 |
-0.25% |
-9.90% |
| Bank |
$BKX |
77.16 |
-1.14 |
-1.46% |
-23.49% |
| Biotech |
$BTK |
4,646.13 |
-114.10 |
-2.40% |
-12.02% |
|
|
|
 |
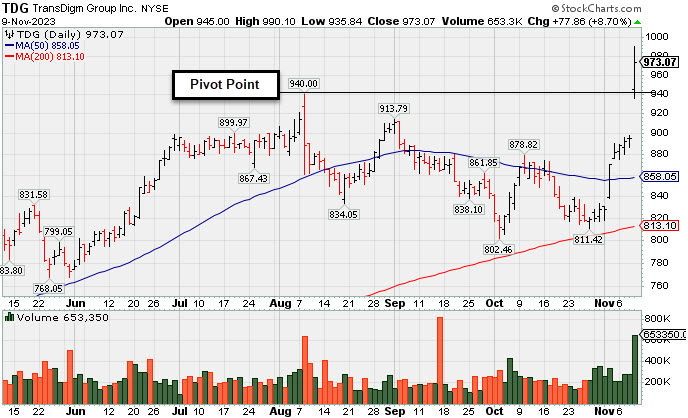
TransDigm's Big Gap Up Gain Triggered Technical Buy Signal
Kenneth J. Gruneisen - Passed the CAN SLIM® Master's Exam
Transdigm Group Inc's (TDG +$77.86 or +8.70% to $973.07) finshed strong after highlighted in yellow in the earlier mid-day report (read here) with pivot point cited based on its 8/08/23 high plus 10 cents. It hit a new all-time high (N criteria) triggering a technical buy signal with today's "breakaway gap" and 10th consecutive volume-driven gain. Bullish action came after it reported Sep '23 quarterly earnings +46% on +23% sales revenues versus the year-ago period, its 10th consecutive comparison above the +25% minimum earnings guideline (C criteria). Growth has been very strong after a downturn in FY '20 and '21 (A criteria) hurt its earnings track record. It has an 87 Earnings Per Share Rating.
The number of top-rated funds owning its shares rose from 1,332 in Dec '22 to 1,486 in Sep '23, a reassuring trend concerning the I criteria. Its small supply of 53 million shares (S criteria) in the public float can contribute to greater price volatility in the event of institutional buying or selling. It has a Timeliness Rating of A and an Accumulation/Distribution rating of B-.
|
|
|
Color Codes Explained :
Y - Better candidates highlighted by our
staff of experts.
G - Previously featured
in past reports as yellow but may no longer be buyable under the
guidelines.
***Last / Change / Volume data in this table is the closing quote data***
Symbol/Exchange
Company Name
Industry Group |
PRICE |
CHANGE
(%Change) |
Day High |
Volume
(% DAV)
(% 50 day avg vol) |
52 Wk Hi
% From Hi |
Featured
Date |
Price
Featured |
Pivot Featured |
|
Max Buy |
 ANET
-
NYSE
ANET
-
NYSE
Arista Networks
Computer-Networking
|
$211.64
|
+2.04
0.97% |
$213.34
|
1,978,927
90.94% of 50 DAV
50 DAV is 2,176,000
|
$216.29
-2.15%
|
10/31/2023
|
$188.84
|
PP = $198.80
|
|
MB = $208.74
|
Most Recent Note - 11/7/2023 7:03:15 PM
G - On pullbacks the prior highs in the $198 area define near-term support above its 50 DMA line ($190.64). Paused today after 5 consecutive gains to new all-time highs. Bullish action came after it reported Sep '23 quarterly earnings +46% on +28% sales revenues versus the year-ago period.
>>> FEATURED STOCK ARTICLE : Powerful Gain Following Earnings Report for Arista Networks - 10/31/2023 |
View all notes |
Set NEW NOTE alert |
Company Profile |
SEC
News |
Chart |
Request a new note
C
A
S
I |
NVO
-
NYSE
Novo Nordisk ADR
Medical-Ethical Drugs
|
$100.03
|
-1.73
-1.70% |
$101.65
|
4,471,776
94.16% of 50 DAV
50 DAV is 4,749,000
|
$104.00
-3.82%
|
11/2/2023
|
$100.97
|
PP = $104.10
|
|
MB = $109.31
|
Most Recent Note - 11/8/2023 1:09:22 PM
Y - Churning above average volume today after recently wedging higher with gains lacking great volume conviction. Its 50 DMA line ($95.65) defines important near-term support to watch on pullbacks. Subsequent gains for new highs backed by at least +40% above average volume are needed to trigger a technical buy signal. This Denmark-based Medical - Ethical Drugs firm's shares split 2-1 on 9/20/23. Reported Sep '23 quarterly earnings +69% on +39% sales revenues versus the year-ago period, its 3rd strong quarter, well above the +25% minimum earnings guideline (C criteria). Annual earnings growth has been slow and steady.
>>> FEATURED STOCK ARTICLE : Approaching Prior High With Strong Fundamentals - 11/2/2023 |
View all notes |
Set NEW NOTE alert |
Company Profile |
SEC
News |
Chart |
Request a new note
C
A
S
I |
QLYS
-
NASDAQ
Qualys
Computer Sftwr-Security
|
$167.98
|
+0.55
0.33% |
$169.66
|
291,002
84.59% of 50 DAV
50 DAV is 344,000
|
$172.83
-2.81%
|
11/3/2023
|
$167.50
|
PP = $165.03
|
|
MB = $173.28
|
Most Recent Note - 11/7/2023 7:00:07 PM
Y - Hit another new all-time high with average volume today's 4th consecutive gain. Featured in yellow in the 11/03/23 mid-day report with pivot point cited based on its 10/11/23 high after a cup-with-handle base. Reported Sep '23 quarterly earnings +61% on +13% sales revenues versus the year-ago period, its 2nd strong quarterly comparison well above the +25% minimum earnings guideline (C criteria).
>>> FEATURED STOCK ARTICLE : Powerful Breakout for Qualys - 11/3/2023 |
View all notes |
Set NEW NOTE alert |
Company Profile |
SEC
News |
Chart |
Request a new note
C
A
S
I |
AXON
-
NASDAQ
Axon Enterprise
Security/Sfty
|
$215.70
|
-13.88
-6.05% |
$230.66
|
810,876
172.53% of 50 DAV
50 DAV is 470,000
|
$231.71
-6.91%
|
11/8/2023
|
$127.84
|
PP = $223.30
|
|
MB = $234.47
|
 Most Recent Note - 11/9/2023 5:16:32 PM
Y - Degated the prior session's gain with today's big volume-driven loss raising concerns while undercutting the new pivot point cited. Found support near its 200 DMA line in recent months. Reported Sep '23 quarterly earnings +70% on +33% sales revenues versus the year-ago period, its 4th strong quarter well above the +25% minimum earnings guideline (C criteria). Annual earnings had a slight downturn in FY '22 after years of strong growth. See the latest FSU analysis for more details and an annotated graph.
>>> FEATURED STOCK ARTICLE : Breakout for Axon as it Returns to Featured Stocks List - 11/8/2023 |
View all notes |
Set NEW NOTE alert |
Company Profile |
SEC
News |
Chart |
Request a new note
C
A
S
I |
TDG
-
NYSE
TransDigm Group
Aerospace/Defense
|
$973.07
|
+77.86
8.70% |
$990.10
|
653,333
279.20% of 50 DAV
50 DAV is 234,000
|
$940.00
3.52%
|
11/9/2023
|
$982.68
|
PP = $940.10
|
|
MB = $987.11
|
Most Recent Note - 11/9/2023 5:14:39 PM
Y - Finished strong after highlighted in yellow in the earlier mid-day report with pivot point cited based on its 8/08/23 high plus 10 cents. Hit a new all-time high triggering a technical buy signal with a "breakaway gap" and 10th consecutive volume-driven gain. Reported Sep '23 quarterly earnings +46% on +23% sales revenues versus the year-ago period, its 10th consecutive comparison above the +25% minimum earnings guideline (C criteria). Growth has been very strong after a downturn in FY '20 and '21 (A criteria) hurt its earnings track record. See the latest FSU analysis for more details and a new annotated graph.
>>> FEATURED STOCK ARTICLE : TransDigm's Big Gap Up Gain Triggered Technical Buy Signal - 11/9/2023 |
View all notes |
Set NEW NOTE alert |
Company Profile |
SEC
News |
Chart |
Request a new note
C
A
S
I |
Symbol/Exchange
Company Name
Industry Group |
PRICE |
CHANGE
(%Change) |
Day High |
Volume
(% DAV)
(% 50 day avg vol) |
52 Wk Hi
% From Hi |
Featured
Date |
Price
Featured |
Pivot Featured |
|
Max Buy |
|
|
|
THESE ARE NOT BUY RECOMMENDATIONS!
Comments contained in the body of this report are technical
opinions only. The material herein has been obtained
from sources believed to be reliable and accurate, however,
its accuracy and completeness cannot be guaranteed.
This site is not an investment advisor, hence it does
not endorse or recommend any securities or other investments.
Any recommendation contained in this report may not
be suitable for all investors and it is not to be deemed
an offer or solicitation on our part with respect to
the purchase or sale of any securities. All trademarks,
service marks and trade names appearing in this report
are the property of their respective owners, and are
likewise used for identification purposes only.
This report is a service available
only to active Paid Premium Members.
You may opt-out of receiving report notifications
at any time. Questions or comments may be submitted
by writing to Premium Membership Services 665 S.E. 10 Street, Suite 201 Deerfield Beach, FL 33441-5634 or by calling 1-800-965-8307
or 954-785-1121.
|
|
|