You are not logged in.
This means you
CAN ONLY VIEW reports that were published prior to Saturday, April 5, 2025.
You
MUST UPGRADE YOUR MEMBERSHIP if you want to see any current reports.
AFTER MARKET UPDATE - THURSDAY, NOVEMBER 2ND, 2023
Previous After Market Report Next After Market Report >>>
|
|
|
|
DOW |
+564.50 |
33,839.08 |
+1.70% |
|
Volume |
1,057,075,669 |
+2% |
|
Volume |
4,996,081,500 |
+9% |
|
NASDAQ |
+232.72 |
13,294.19 |
+1.78% |
|
Advancers |
2,533 |
88% |
|
Advancers |
3,305 |
76% |
|
S&P 500 |
+79.92 |
4,317.78 |
+1.89% |
|
Decliners |
347 |
12% |
|
Decliners |
1,034 |
24% |
|
Russell 2000 |
+44.51 |
1,714.21 |
+2.67% |
|
52 Wk Highs |
66 |
|
|
52 Wk Highs |
45 |
|
|
S&P 600 |
+28.95 |
1,117.89 |
+2.66% |
|
52 Wk Lows |
49 |
|
|
52 Wk Lows |
161 |
|
|
Solid gains with higher volume marked another follow-through day. Gains have signaled a new confirmed uptrend for the market (M criteria).
|
 |
Major Averages Rallied for Additional Follow-Through Gains
Kenneth J. Gruneisen - Passed the CAN SLIM® Master's Exam
The Russell 2000 registered a +2.5% gain while the three main indices closed with gains ranging from +1.7% to +1.9%. The S&P 500 closed back above its 200-day moving average line. The volume totals were higher than the prior session on the NYSE and on the Nasdaq exchange, action indicative of greater institutional buying demand. Breadth was positive as advancers led decliners by a 7-1 margin on the NYSE and by more than a 3-1 margin on the Nasdaq exchange. There were 32 high-ranked companies from the Leaders List that hit new 52-week highs and were listed on the BreakOuts Page, a solid improvement versus the total of 18 on the prior session. New 52-week highs outnumbered new 52-week lows on the NYSE but new lows still outnumbered new highs on the Nasdaq exchange. The 3 major indices posted solid gains with higher volume and an expansion in new highs totals marking another follow-through day. Gains have signaled a new confirmed uptrend for the market (M criteria). New buying efforts should be only made in stocks fitting all key criteria of the fact-based investment system.
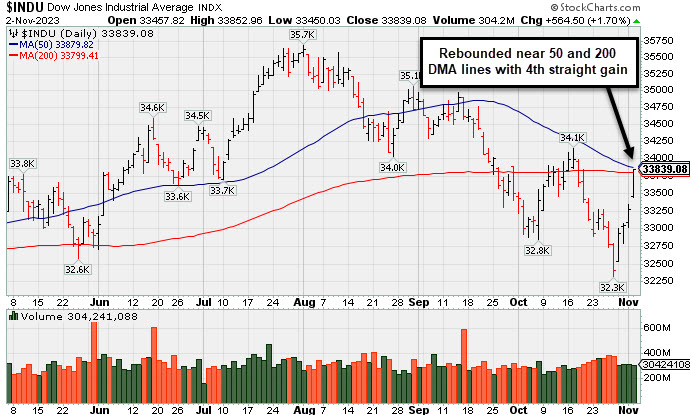
PICTURED: The Dow Jones Industrial Average rose near its 50-day and 200-day moving average (DMA) lines with a 4th consecutive gain.
The market was in rally-mode as 29 of the 30 Dow components settled with a gain and all 11 S&P 500 sectors closed in the green. The energy (+3.1%) and real estate (+3.1%) sectors jumped more than 3.0% while the communication services sector (+0.9%) saw the slimmest gain.
Optimism rose with the notion that the Fed could be done raising rates. The 10-yr note yield fell another 12 basis points today to 4.67% while the 2-yr note yield rose one basis point to 4.98%.
Reactions to earnings news was generally positive. Qualcomm (QCOM +5.83%), Eli Lilly (LLY +4.68%), and Starbucks (SBUX +9.48%) were winning standouts. Meanwhile, Airbnb (ABNB -3.32%) and Moderna (MRNA -6.52%) traded down after reporting earnings. November, on average, has historically been the strongest month for the S&P 500 and marks the start of the best six month return period for the S&P 500.
|
 Kenneth J. Gruneisen started out as a licensed stockbroker in August 1987, a couple of months prior to the historic stock market crash that took the Dow Jones Industrial Average down -22.6% in a single day. He has published daily fact-based fundamental and technical analysis on high-ranked stocks online for two decades. Through FACTBASEDINVESTING.COM, Kenneth provides educational articles, news, market commentary, and other information regarding proven investment systems that work in good times and bad.
Comments contained in the body of this report are technical opinions only and are not necessarily those of Gruneisen Growth Corp. The material herein has been obtained from sources believed to be reliable and accurate, however, its accuracy and completeness cannot be guaranteed. Our firm, employees, and customers may effect transactions, including transactions contrary to any recommendation herein, or have positions in the securities mentioned herein or options with respect thereto. Any recommendation contained in this report may not be suitable for all investors and it is not to be deemed an offer or solicitation on our part with respect to the purchase or sale of any securities. |
|
 |
Financial, Retail, Tech, and Energy-Linked Groups Led Gainers
Kenneth J. Gruneisen - Passed the CAN SLIM® Master's Exam
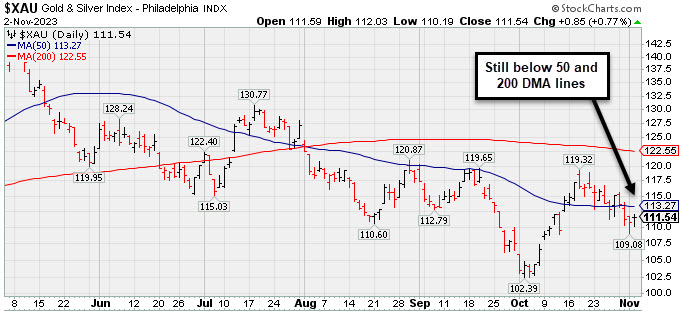
The Bank Index ($BKX +4.46%) outpaced the Broker/Dealer Index ($XBD +1.78%), and the Retail Index ($RLX +1.27%) also finished higher. The tech sector was led by the Networking Index ($NWX +2.57%) and the Semiconductor Index ($SOX +2.36%) while the Biotech Index ($BTK +0.84%) posted a smaller gain. Commodity-linked groups also had a positive bias as the Oil Services Index ($OSX +3.36%) and the Integrated Oil Index ($XOI +2.87%) both outpaced the Gold & Silver Index ($XAU +0.77%).
PICTURED: The Gold & Silver Index ($XAU +0.77%) is still consolidating below its 50-day and 200-day moving average (DMA) lines.
| Oil Services |
$OSX |
89.52 |
+2.91 |
+3.36% |
+6.75% |
| Integrated Oil |
$XOI |
1,914.53 |
+53.34 |
+2.87% |
+7.12% |
| Semiconductor |
$SOX |
3,368.54 |
+77.59 |
+2.36% |
+33.03% |
| Networking |
$NWX |
687.34 |
+17.25 |
+2.57% |
-12.25% |
| Broker/Dealer |
$XBD |
475.98 |
+8.30 |
+1.78% |
+5.98% |
| Retail |
$RLX |
3,493.99 |
+43.91 |
+1.27% |
+26.87% |
| Gold & Silver |
$XAU |
111.54 |
+0.85 |
+0.77% |
-7.71% |
| Bank |
$BKX |
77.29 |
+3.30 |
+4.46% |
-23.36% |
| Biotech |
$BTK |
4,658.43 |
+38.96 |
+0.84% |
-11.79% |
|
|
|
 |
Approaching Prior High With Strong Fundamentals
Kenneth J. Gruneisen - Passed the CAN SLIM® Master's Exam
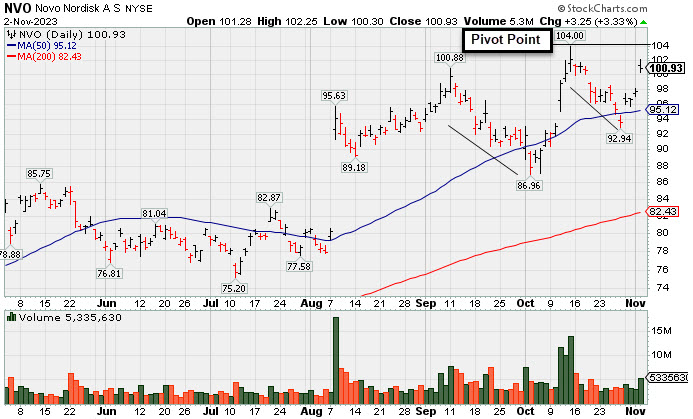
Novo Nordisk (NVO +$3.25 or +3.33% to $100.93) was highlighted in yellow in the earlier mid-day report (read here) with pivot point cited based on its 10/13/23 high plus 10 cents while building on an advanced ascending base. Subsequent gains for new highs backed by at least +40% above averqage volume are needed to trigger a technical buy signal.
This Denmark-based Medical - Ethical Drugs firm gapped up today challenging its all-time high. It found support after briefly undercutting its 50-day moving average (DMA) line in recent weeks. Shares split 2-1 on 9/20/23.
NVO reported Sep '23 quarterly earnings +69% on +39% sales revenues versus the year-ago period, its 3rd strong quarter well above the +25% minimum earnings guideline (C criteria). Annual earnings growth has been slow and steady. It has a 96 Earnings Per Share Rating, well above the 80+ minimum for buy candidates.
The number of top-rated funds owning its shares rose from 372 in Dec '22 to 455 in Sep '23, a reassuring sign concerning the I criteria. Its current Up/Down Volume Ratio of 1.5 is an unbiased indication its shares have been under accumulation over the past 50 days. It has a Timeliness Rating of A and an Accumulation/Distribution Rating of B+. |
|
|
Color Codes Explained :
Y - Better candidates highlighted by our
staff of experts.
G - Previously featured
in past reports as yellow but may no longer be buyable under the
guidelines.
***Last / Change / Volume data in this table is the closing quote data***
|
|
|
THESE ARE NOT BUY RECOMMENDATIONS!
Comments contained in the body of this report are technical
opinions only. The material herein has been obtained
from sources believed to be reliable and accurate, however,
its accuracy and completeness cannot be guaranteed.
This site is not an investment advisor, hence it does
not endorse or recommend any securities or other investments.
Any recommendation contained in this report may not
be suitable for all investors and it is not to be deemed
an offer or solicitation on our part with respect to
the purchase or sale of any securities. All trademarks,
service marks and trade names appearing in this report
are the property of their respective owners, and are
likewise used for identification purposes only.
This report is a service available
only to active Paid Premium Members.
You may opt-out of receiving report notifications
at any time. Questions or comments may be submitted
by writing to Premium Membership Services 665 S.E. 10 Street, Suite 201 Deerfield Beach, FL 33441-5634 or by calling 1-800-965-8307
or 954-785-1121.
|
|
|