You are not logged in.
This means you
CAN ONLY VIEW reports that were published prior to Thursday, March 20, 2025.
You
MUST UPGRADE YOUR MEMBERSHIP if you want to see any current reports.
AFTER MARKET UPDATE - TUESDAY, OCTOBER 31ST, 2023
Previous After Market Report Next After Market Report >>>
|
|
|
|
DOW |
+123.91 |
33,052.87 |
+0.38% |
|
Volume |
1,115,878,303 |
+23% |
|
Volume |
4,346,908,500 |
+4% |
|
NASDAQ |
+61.76 |
12,851.24 |
+0.48% |
|
Advancers |
2,010 |
71% |
|
Advancers |
2,596 |
60% |
|
S&P 500 |
+26.98 |
4,193.80 |
+0.65% |
|
Decliners |
830 |
29% |
|
Decliners |
1,704 |
40% |
|
Russell 2000 |
+14.99 |
1,662.28 |
+0.91% |
|
52 Wk Highs |
14 |
|
|
52 Wk Highs |
20 |
|
|
S&P 600 |
+8.54 |
1,084.10 |
+0.79% |
|
52 Wk Lows |
116 |
|
|
52 Wk Lows |
305 |
|
|
The market averages are in a correction (M criteria). New buying efforts should be avoided until a solid follow-through day signals a new confirmed rally.
|
 |
Breadth Positive as Major Indices Rose
Kenneth J. Gruneisen - Passed the CAN SLIM® Master's Exam
The market-cap weighted S&P 500 closed with a +0.65% gain. The volume totals were higher than the prior session on the NYSE and on the Nasdaq exchange, revealing anm increase in buying demand from the institutional crowd. Breadth was positive as advancers led decliners by almost a 5-2 margin on the NYSE and 3-2 on the Nasdaq exchange. There were 7 high-ranked companies from the Leaders List that hit new 52-week highs and were listed on the BreakOuts Page, versus the total of 4 on the prior session. New 52-week lows totals contracted yet still solidly outnumbered thin new 52-week highs on the NYSE and on the Nasdaq exchange. The market averages are in a correction (M criteria). New buying efforts should be avoided until a solid follow-through day signals a new confirmed rally.
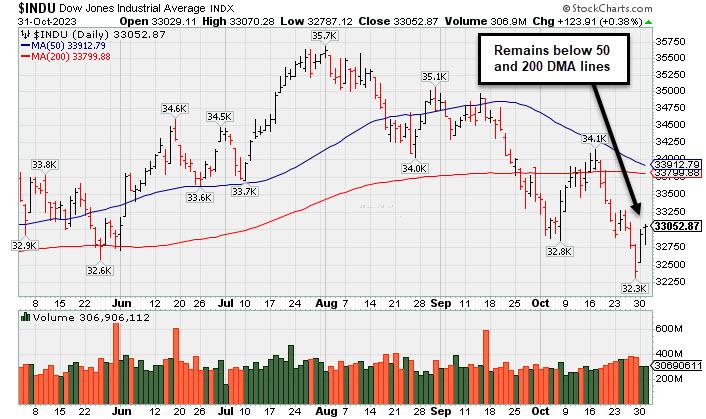
PICTURED: The Dow Jones Industrial Average is quietly sputtering below its 50-day and 200-day moving average (DMA) lines after damaging losses on higher volume.
All 11 S&P 500 sectors closed with a gain led by real estate (+2.0%) and financials (+1.1%). The communication services sector (+0.2%) saw the slimmest gain.
A big batch of earnings news included Dow components Caterpillar (CAT -6.65%) and Amgen (AMGN -2.89%) as losing standouts. Pinterest (PINS +19.04%) and Arista Networks (ANET +14.03%) registered outsized gains after their quarterly results. Apple (AAPL +0.28%) ,which is due to report earnings on Thursday, ended higher after trading down as much as -1.4%. Microsoft (MSFT +0.24%) also recovered from a loss, having been down as much as -0.8%.
Market participants are looking ahead to the FOMC decision Wednesday, and the Bank of England's policy decision on Thursday. The 2-yr note yield settled three basis points higher at 5.08% and the 10-yr note yield was unchanged from yesterday at 4.88%. The USD/JPY was at 151.62, up 1.7%, in response to the BOJ announcement that the upper bound of 1.0% for 10-yr JGB yields will be viewed now as a "reference point" rather than a strict cap. That announcement helped temper concerns about a more aggressive unwinding of carry trades, which have been supportive for some time for the Treasury market and the stock market.
|
 Kenneth J. Gruneisen started out as a licensed stockbroker in August 1987, a couple of months prior to the historic stock market crash that took the Dow Jones Industrial Average down -22.6% in a single day. He has published daily fact-based fundamental and technical analysis on high-ranked stocks online for two decades. Through FACTBASEDINVESTING.COM, Kenneth provides educational articles, news, market commentary, and other information regarding proven investment systems that work in good times and bad.
Comments contained in the body of this report are technical opinions only and are not necessarily those of Gruneisen Growth Corp. The material herein has been obtained from sources believed to be reliable and accurate, however, its accuracy and completeness cannot be guaranteed. Our firm, employees, and customers may effect transactions, including transactions contrary to any recommendation herein, or have positions in the securities mentioned herein or options with respect thereto. Any recommendation contained in this report may not be suitable for all investors and it is not to be deemed an offer or solicitation on our part with respect to the purchase or sale of any securities. |
|
 |
Financial, Retail, and Tech Indexes Rose
Kenneth J. Gruneisen - Passed the CAN SLIM® Master's Exam
The Broker/Dealer Index ($XBD +0.88%) and the Bank Index ($BKX +1.12%) both outpaced the Retail Index ($RLX +0.52%). The tech sector had a positive bias as the Networking Index ($NWX +2.70%) outpaced the Semiconductor Index ($SOX +0.96%) and the Biotech Index ($BTK +0.19%) also inched higher. The Gold & Silver Index ($XAU -2.16%) lost ground and the Oil Services Index ($OSX -0.30%) edged lower while the Integrated Oil Index ($XOI +0.53%) edged higher.
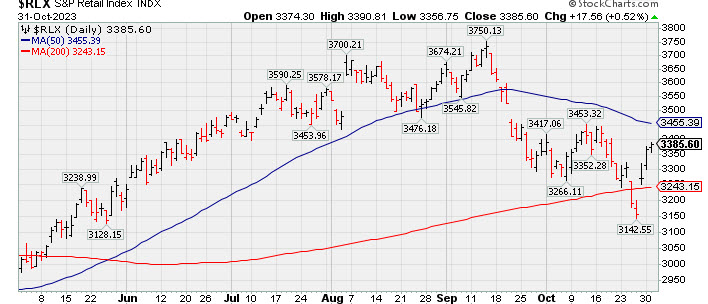
PICTURED: The Retail Index ($RLX +0.52%) posed a 3rd conseccutive gain. It rebounded after undercutting its 200-day moving average (DMA) line but remains below its 50 DMA line.
| Oil Services |
$OSX |
86.99 |
-0.26 |
-0.30% |
+3.74% |
| Integrated Oil |
$XOI |
1,863.13 |
+9.87 |
+0.53% |
+4.25% |
| Semiconductor |
$SOX |
3,215.89 |
+30.71 |
+0.96% |
+27.00% |
| Networking |
$NWX |
680.97 |
+17.93 |
+2.70% |
-13.07% |
| Broker/Dealer |
$XBD |
463.64 |
+4.02 |
+0.88% |
+3.23% |
| Retail |
$RLX |
3,385.60 |
+17.56 |
+0.52% |
+22.93% |
| Gold & Silver |
$XAU |
111.25 |
-2.45 |
-2.16% |
-7.95% |
| Bank |
$BKX |
73.90 |
+0.82 |
+1.12% |
-26.73% |
| Biotech |
$BTK |
4,556.42 |
+8.66 |
+0.19% |
-13.72% |
|
|
|
 |
Powerful Gain Following Earnings Report for Arista Networks
Kenneth J. Gruneisen - Passed the CAN SLIM® Master's Exam
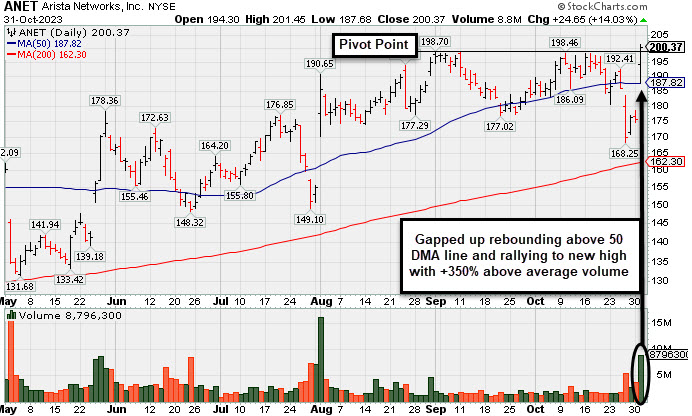
Arista Networks Inc (ANET +$24.65 or +14.03% to $200.37) finished strong after it was highlighted in yellow and new pivot point cited is based on its prior high plus 10 cents in the earlier mid-day report (read here). Bullish action came after it reported Sep '23 quarterly earnings +46% on +28% sales revenues versus the year-ago period, continuing its strong earnings track record. It gapped up today rebounding above its 50-day moving average (DMA) line ($187.77) and then rallied to a new high. Members have been reminded that for now, "the market averages are in a correction (M criteria). New buying efforts should be avoided until a solid follow-through day signals a new confirmed rally."
ANET currently has a 98 Earnings Per Share Rating. It has shown 8 consecutive quarterly comparisons with strong and steady above the +25% minimum earnings guideline (C criteria). Annual earnings (A criteria) had a downturn in FY '20 like many companies during the pandemic.
The number of top-rated funds owning its shares rose from 1,758 in Dec '21 to 2,331 in Sep '23, a reassuring sign concerning the I criteria. Its current Up/Down Volume Ratio of 1.1 is an unbiased indication its shares have been under slight accumulation over the past 50 days. The high-ranked Computer - Networking firm has a Timeliness Rating of A and a Sponsorship Rating of C. Its small supply of 250.8 million shares (S criteria) in the public float may contribute to greater volatility in the event of institutional buying or selling.
|
|
|
Color Codes Explained :
Y - Better candidates highlighted by our
staff of experts.
G - Previously featured
in past reports as yellow but may no longer be buyable under the
guidelines.
***Last / Change / Volume data in this table is the closing quote data***
|
|
|
THESE ARE NOT BUY RECOMMENDATIONS!
Comments contained in the body of this report are technical
opinions only. The material herein has been obtained
from sources believed to be reliable and accurate, however,
its accuracy and completeness cannot be guaranteed.
This site is not an investment advisor, hence it does
not endorse or recommend any securities or other investments.
Any recommendation contained in this report may not
be suitable for all investors and it is not to be deemed
an offer or solicitation on our part with respect to
the purchase or sale of any securities. All trademarks,
service marks and trade names appearing in this report
are the property of their respective owners, and are
likewise used for identification purposes only.
This report is a service available
only to active Paid Premium Members.
You may opt-out of receiving report notifications
at any time. Questions or comments may be submitted
by writing to Premium Membership Services 665 S.E. 10 Street, Suite 201 Deerfield Beach, FL 33441-5634 or by calling 1-800-965-8307
or 954-785-1121.
|
|
|