You are not logged in.
This means you
CAN ONLY VIEW reports that were published prior to Thursday, March 20, 2025.
You
MUST UPGRADE YOUR MEMBERSHIP if you want to see any current reports.
AFTER MARKET UPDATE - MONDAY, SEPTEMBER 11TH, 2023
Previous After Market Report Next After Market Report >>>
|
|
|
|
DOW |
+87.13 |
34,663.72 |
+0.25% |
|
Volume |
776,840,487 |
+5% |
|
Volume |
4,629,032,000 |
+10% |
|
NASDAQ |
+156.37 |
13,917.89 |
+1.14% |
|
Advancers |
1,532 |
54% |
|
Advancers |
2,241 |
52% |
|
S&P 500 |
+29.97 |
4,487.46 |
+0.67% |
|
Decliners |
1,315 |
46% |
|
Decliners |
2,089 |
48% |
|
Russell 2000 |
+3.60 |
1,855.14 |
+0.19% |
|
52 Wk Highs |
58 |
|
|
52 Wk Highs |
58 |
|
|
S&P 600 |
+0.84 |
1,186.34 |
+0.07% |
|
52 Wk Lows |
70 |
|
|
52 Wk Lows |
206 |
|
|
 |
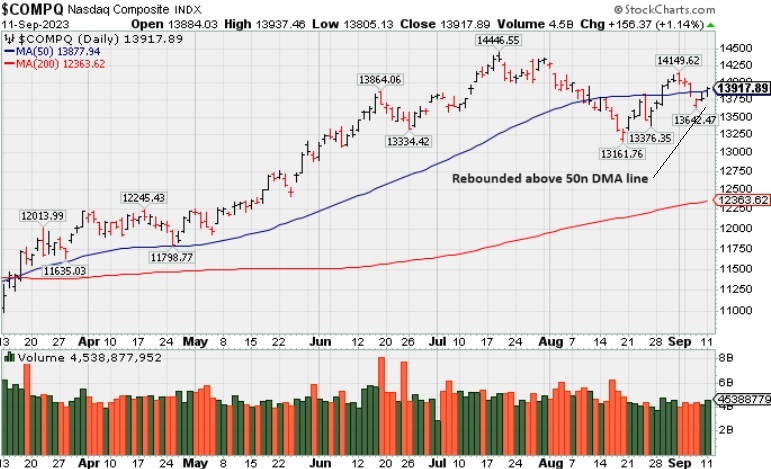
Major Indices Rose with Slightly Higher Volume Totals
Kenneth J. Gruneisen - Passed the CAN SLIM® Master's Exam
The Nasdaq climbed 1.1% and the market-cap weighted S&P 500 rose 0.7%, both closing near their best levels of the day and above their respective 50-day moving averages. Volume totals reported were higher than the prior session on the NYSE and on the Nasdaq exchange. Advancers led decliners by a narrow margin on the NYSE and on the Nasdaq exchange. There were 24 high-ranked companies from the Leaders List that hit a new 52-week high and were listed on the BreakOuts Page versus the total of 25 on the prior session. New 52-week lows totals still outnumbered new 52-week highs totals on both the NYSE and on the Nasdaq exchange. The major indices are in a confirmed uptrend (M criteria).
PICTURED: The Nasdaq Composite Index posted a solid gain and closed back above its 50-day moving average (DMA) line.
Strength from some mega cap names provided a nice boost to the broader market. Tesla (TSLA +10.09%) was a notable outperformer after an analyst upgrade. Most of the S&P 500 sectors logged gains. Consumer discretionary (+2.8%) was the top performing sector by a wide margin. The energy sector (-1.3%) fell and was the worst performing sector.
The 2-yr note yield rose two basis points to 4.99% and the 10-yr note yield rose three basis points to 4.29%. There was a lack of strong conviction ahead of a busy week of economic data. This week's calendar features the August Consumer Price Index on Wednesday, followed by the August Producer Price Index and Retail Sales report on Thursday.
The New York Fed's August 2023 Survey of Consumer Expectations showed that households are less optimistic about their financial situation. Inflation expectations rose slightly at the short- and longer-term horizons and fell slightly at the medium-term horizon. Income growth perceptions declined in August, and job loss expectations rose sharply to its highest level since April 2021.
|
 Kenneth J. Gruneisen started out as a licensed stockbroker in August 1987, a couple of months prior to the historic stock market crash that took the Dow Jones Industrial Average down -22.6% in a single day. He has published daily fact-based fundamental and technical analysis on high-ranked stocks online for two decades. Through FACTBASEDINVESTING.COM, Kenneth provides educational articles, news, market commentary, and other information regarding proven investment systems that work in good times and bad.
Comments contained in the body of this report are technical opinions only and are not necessarily those of Gruneisen Growth Corp. The material herein has been obtained from sources believed to be reliable and accurate, however, its accuracy and completeness cannot be guaranteed. Our firm, employees, and customers may effect transactions, including transactions contrary to any recommendation herein, or have positions in the securities mentioned herein or options with respect thereto. Any recommendation contained in this report may not be suitable for all investors and it is not to be deemed an offer or solicitation on our part with respect to the purchase or sale of any securities. |
|
 |
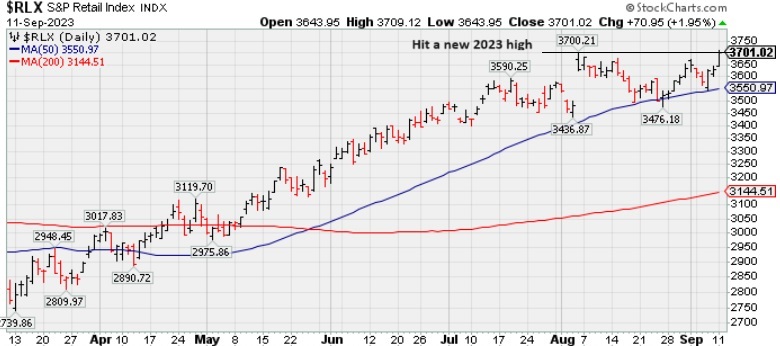
Retail and Gold & Silver Indexes Led Group Gainers
Kenneth J. Gruneisen - Passed the CAN SLIM® Master's Exam
The Retail Index ($RLX +1.95%) posted a standout gain while the Bank Index ($BKX +0.30%) edged higher and the Broker/Dealer Index ($XBD +0.02%) finished flat. The tech sector was indecisive as the Biotech Index ($BTK +0.55%) edged higher while the Semiconductor Index ($SOX +0.09%) was little changed and the Networking Index ($NWX -0.19%) edged lower. Commodity-linked groups were mixed as the Gold & Silver Index ($XAU +1.52%) posted a solid gain, meanwhile the Oil Services Index ($OSX -0.11%) inched lower and the Integrated Oil Index ($XOI -1.23%) suffered a larger loss.
PICTURED: The Retail Index ($RLX +1.95%) posted a standout gain and hit a new 2023 high after finding support at its 50-day moving average (DMA) line last week.
| Oil Services |
$OSX |
96.49 |
-0.10 |
-0.11% |
+15.06% |
| Integrated Oil |
$XOI |
1,934.20 |
-24.06 |
-1.23% |
+8.22% |
| Semiconductor |
$SOX |
3,569.23 |
+3.24 |
+0.09% |
+40.96% |
| Networking |
$NWX |
788.18 |
-1.50 |
-0.19% |
+0.62% |
| Broker/Dealer |
$XBD |
500.88 |
+0.08 |
+0.02% |
+11.52% |
| Retail |
$RLX |
3,701.02 |
+70.95 |
+1.95% |
+34.39% |
| Gold & Silver |
$XAU |
114.88 |
+1.72 |
+1.52% |
-4.95% |
| Bank |
$BKX |
80.63 |
+0.24 |
+0.30% |
-20.05% |
| Biotech |
$BTK |
5,229.08 |
+28.74 |
+0.55% |
-0.99% |
|
|
|
 |
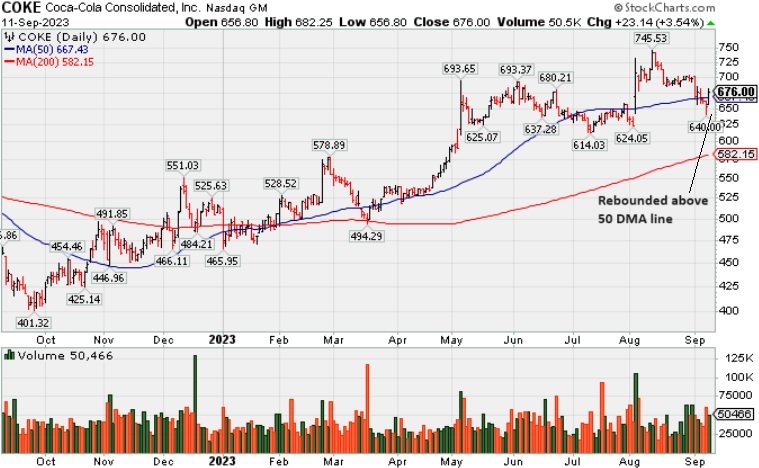
Rebounded Above 50-Day Moving Average
Kenneth J. Gruneisen - Passed the CAN SLIM® Master's Exam
Coca-Cola Consolidated (COKE +$23.14 or +3.54% to $676.00) volume was near average today while rebounding above its 50-day moving average (DMA) line ($667).
COKE was highlighted in yellow with pivot point cited based on its 5/04/23 high plus 10 cents in the 8/03/23 mid-day report (read here). It was shown in this FSU section on 8/03/23 with an annotated graph under the headline "Powerful Breakout for COKE".
COKE has a 99 Earnings Per Share Rating, well above the 80+ minimum for buy candidates. It reported Jun '23 quarterly earnings +54% on +9% sales revenues versus the year-ago period, continuing its strong track record. The 6 latest quarterly comparisons were well above the +25% minimum earnings guideline (C criteria). Annual earnings (A criteria) growth has been very strong after a slight downturn in FY '18.
The number of top-rated funds owning its shares rose from 379 in Jun '21 to 511 in Jun '23, a reassuring sign concerning the I criteria. Its current Up/Down Volume Ratio of 0.7 is an unbiased indication its shares have been under distributional pressure over the past 50 days. It has a Timeliness Rating of A and a Sponsorship Rating of C. There are only 5.8 million shares in the public float which can contribute to greater price volatility due to any buying or selling by the institutional crowd. |
|
|
Color Codes Explained :
Y - Better candidates highlighted by our
staff of experts.
G - Previously featured
in past reports as yellow but may no longer be buyable under the
guidelines.
***Last / Change / Volume data in this table is the closing quote data***
Symbol/Exchange
Company Name
Industry Group |
PRICE |
CHANGE
(%Change) |
Day High |
Volume
(% DAV)
(% 50 day avg vol) |
52 Wk Hi
% From Hi |
Featured
Date |
Price
Featured |
Pivot Featured |
|
Max Buy |
 STRL
-
NASDAQ
STRL
-
NASDAQ
Sterling Infrastructure
Bldg-Heavy Construction
|
$77.34
|
-1.14
-1.45% |
$79.46
|
325,549
78.64% of 50 DAV
50 DAV is 414,000
|
$84.00
-7.93%
|
12/14/2022
|
$32.41
|
PP = $33.72
|
|
MB = $35.41
|
Most Recent Note - 9/7/2023 11:44:02 AM
G - Pulling back from its all-time high with today's 3rd consecutive loss on light volume. It is extended from any sound base. The recent low ($73.39 on 8/18/23) defines near-term support above its 50 DMA line ($67.78). Fundamentals remain strong.
>>> FEATURED STOCK ARTICLE : Volume-Driven Gains Leave Construction Firm at All-Time High - 8/9/2023 |
View all notes |
Set NEW NOTE alert |
Company Profile |
SEC
News |
Chart |
Request a new note
C
A
S
I |
FIX
-
NYSE
Comfort Systems USA
Bldg-A/C and Heating Prds
|
$188.13
|
+1.26
0.67% |
$189.40
|
210,585
100.76% of 50 DAV
50 DAV is 209,000
|
$189.82
-0.89%
|
4/27/2023
|
$148.85
|
PP = $152.23
|
|
MB = $159.84
|
 Most Recent Note - 9/11/2023 6:35:00 PM
G - Posted a small gain with average volume today for a best-ever close. Its 50 DMA line ($174.39) defines important near-term support to watch on pullbacks. Fundamentals remain strong.
>>> FEATURED STOCK ARTICLE : FIX Still Stubbornly Hovering Near High - 8/21/2023 |
View all notes |
Set NEW NOTE alert |
Company Profile |
SEC
News |
Chart |
Request a new note
C
A
S
I |
KOF
-
NYSE
Coca Cola Femsa Sab Ads
FOOD and BEVERAGE - Beverages - Soft Drinks
|
$82.15
|
+0.36
0.44% |
$83.32
|
114,236
76.31% of 50 DAV
50 DAV is 149,700
|
$91.23
-9.95%
|
6/9/2023
|
$88.61
|
PP = $91.33
|
|
MB = $95.90
|
Most Recent Note - 9/11/2023 6:36:57 PM
G - Consolidating below its 50 DMA line ($83.69). Faces some near-term resistance due to overhead supply up to the $91 area. Its Relative Strength Rating is currently 79. Reported Jun '23 quarterly earnings +23% on +26% sales revenues versus the year-ago period, below the +25% minimum guideline (C criteria).
>>> FEATURED STOCK ARTICLE : 50-Day Moving Average Line has Acted as Resistance - 8/10/2023 |
View all notes |
Set NEW NOTE alert |
Company Profile |
SEC
News |
Chart |
Request a new note
C
A
S
I |
CLH
-
NYSE
Clean Harbors
Pollution Control
|
$165.35
|
+0.00
0.00% |
$166.60
|
380,561
116.02% of 50 DAV
50 DAV is 328,000
|
$178.33
-7.28%
|
3/10/2023
|
$136.89
|
PP = $136.74
|
|
MB = $143.58
|
Most Recent Note - 9/8/2023 12:15:20 PM
G - Sputtering below its 50 DMA line ($168.68) raising concerns. Reported earnings for the Jun '23 quarter -13% on +3% sales revenues versus the year-ago period, below the +25% minimum earnings guideline (C criteria), raising fundamental concerns.
>>> FEATURED STOCK ARTICLE : Volume Totals Have Been Cooling While Hovering Near High - 8/18/2023 |
View all notes |
Set NEW NOTE alert |
Company Profile |
SEC
News |
Chart |
Request a new note
C
A
S
I |
HUBB
-
NYSE
Hubbell
Electrical-Power/Equipmt
|
$326.45
|
-1.12
-0.34% |
$328.85
|
358,640
83.60% of 50 DAV
50 DAV is 429,000
|
$340.06
-4.00%
|
4/25/2023
|
$262.85
|
PP = $257.51
|
|
MB = $270.39
|
Most Recent Note - 9/11/2023 6:36:15 PM
G - Perched only -4% off its all-time high, consolidating above its 50 DMA line ($320). Fundamentals remain strong after Jun '23 earnings rose +45% on +9% sales revenues versus the year-ago period.
>>> FEATURED STOCK ARTICLE : Rebounded Near 50-Day Moving Average Line - 8/24/2023 |
View all notes |
Set NEW NOTE alert |
Company Profile |
SEC
News |
Chart |
Request a new note
C
A
S
I |
Symbol/Exchange
Company Name
Industry Group |
PRICE |
CHANGE
(%Change) |
Day High |
Volume
(% DAV)
(% 50 day avg vol) |
52 Wk Hi
% From Hi |
Featured
Date |
Price
Featured |
Pivot Featured |
|
Max Buy |
ANET
-
NYSE
Arista Networks
Computer-Networking
|
$193.19
|
-3.28
-1.67% |
$198.62
|
1,869,136
68.44% of 50 DAV
50 DAV is 2,731,000
|
$198.70
-2.77%
|
8/1/2023
|
$188.84
|
PP = $178.46
|
|
MB = $187.38
|
Most Recent Note - 9/11/2023 6:33:54 PM
G - Pulled back today with light volume. Remains perched near its all-time high. Fundamentals remain strong.
>>> FEATURED STOCK ARTICLE : Hovering Near High with Volume Totals Cooling - 8/14/2023 |
View all notes |
Set NEW NOTE alert |
Company Profile |
SEC
News |
Chart |
Request a new note
C
A
S
I |
LSCC
-
NASDAQ
Lattice Semiconductor
Elec-Semicondctor Fablss
|
$89.99
|
-1.67
-1.82% |
$92.95
|
1,230,025
75.55% of 50 DAV
50 DAV is 1,628,000
|
$98.30
-8.45%
|
6/13/2023
|
$91.73
|
PP = $96.92
|
|
MB = $101.77
|
Most Recent Note - 9/11/2023 6:38:06 PM
G - Pulled back today and closed below its 50 DMA line ($91.61) raising some concerns. Reported Jun '23 quarterly earnings +24% on +18% sales revenues versus the year-ago period, just below the +25% minimum earnings guideline (C criteria).
>>> FEATURED STOCK ARTICLE : Rebound Needed Above 50-Day Moving Average for Lattice - 8/17/2023 |
View all notes |
Set NEW NOTE alert |
Company Profile |
SEC
News |
Chart |
Request a new note
C
A
S
I |
XPEL
-
NASDAQ
Xpel Inc
Auto/Truck-Tires andamp; Misc
|
$74.25
|
-1.50
-1.98% |
$76.63
|
145,001
118.27% of 50 DAV
50 DAV is 122,600
|
$87.46
-15.10%
|
8/22/2023
|
$84.64
|
PP = $87.56
|
|
MB = $91.94
|
Most Recent Note - 9/11/2023 6:28:10 PM
Pulled back today with slightly higher volume. Its Relative Strength Rating has slumped to 70, well below the 80+ minimum guideline. It will be dropped from the Featured Stocks list tonight.
>>> FEATURED STOCK ARTICLE : Pulled Back to 200-Day Moving Average Line - 9/8/2023 |
View all notes |
Set NEW NOTE alert |
Company Profile |
SEC
News |
Chart |
Request a new note
C
A
S
I |
ESQ
-
NASDAQ
Esquire Finl Hldgs
Finance-Commercial Loans
|
$46.91
|
-0.30
-0.64% |
$48.28
|
15,044
65.41% of 50 DAV
50 DAV is 23,000
|
$54.03
-13.18%
|
7/14/2023
|
$45.80
|
PP = $48.23
|
|
MB = $50.64
|
Most Recent Note - 9/8/2023 4:58:59 PM
G - Its 50 DMA line ($47.94) has acted as resistance. Still consolidating near prior highs in the $47 area. A rebound above the 50 DMA line is needed for its outlook to improve.
>>> FEATURED STOCK ARTICLE : Pullback with Light Volume Testing Important Support Level - 8/15/2023 |
View all notes |
Set NEW NOTE alert |
Company Profile |
SEC
News |
Chart |
Request a new note
C
A
S
I |
MEDP
-
NASDAQ
Medpace Holdings
Medical-Research Eqp/Svc
|
$279.35
|
+8.24
3.04% |
$280.12
|
291,773
108.06% of 50 DAV
50 DAV is 270,000
|
$274.62
1.72%
|
7/25/2023
|
$196.32
|
PP = $241.57
|
|
MB = $253.65
|
Most Recent Note - 9/11/2023 6:32:24 PM
G - Posted a solid gain today for a new all-time high. Prior high ($269) defines initial support to watch above its 50 DMA line ($255). Fundamentals remain strong.
>>> FEATURED STOCK ARTICLE : Consolidating Above 50-Day Moving Average - 8/23/2023 |
View all notes |
Set NEW NOTE alert |
Company Profile |
SEC
News |
Chart |
Request a new note
C
A
S
I |
Symbol/Exchange
Company Name
Industry Group |
PRICE |
CHANGE
(%Change) |
Day High |
Volume
(% DAV)
(% 50 day avg vol) |
52 Wk Hi
% From Hi |
Featured
Date |
Price
Featured |
Pivot Featured |
|
Max Buy |
COKE
-
NASDAQ
Coca-Cola Consolidated
Beverages-Non-Alcoholic
|
$676.00
|
+23.14
3.54% |
$682.25
|
50,466
126.17% of 50 DAV
50 DAV is 40,000
|
$745.53
-9.33%
|
8/3/2023
|
$718.56
|
PP = $694.30
|
|
MB = $729.02
|
Most Recent Note - 9/11/2023 6:29:57 PM
G - Posted a gain today, rebounding above its 50 DMA line ($667) helping its outlook to improve. See the latest FSU analysis for more details and a new annotated graph.
>>> FEATURED STOCK ARTICLE : Rebounded Above 50-Day Moving Average - 9/11/2023 |
View all notes |
Set NEW NOTE alert |
Company Profile |
SEC
News |
Chart |
Request a new note
C
A
S
I |
PLUS
-
NASDAQ
ePlus
Computer-Tech Services
|
$65.15
|
+0.66
1.02% |
$65.21
|
98,145
97.17% of 50 DAV
50 DAV is 101,000
|
$75.90
-14.16%
|
8/8/2023
|
$67.60
|
PP = $62.92
|
|
MB = $66.07
|
Most Recent Note - 9/7/2023 11:41:21 AM
Y - Still consolidating since a noted "breakaway gap" on 8/08/23. Fundamentals remain strong. The recent low and 50 DMA line define important near-term support in the $61 area.
>>> FEATURED STOCK ARTICLE : ePLUS Gapped Up but Ended in Lower Half of Intra-Day Range - 8/8/2023 |
View all notes |
Set NEW NOTE alert |
Company Profile |
SEC
News |
Chart |
Request a new note
C
A
S
I |
|
|
|
THESE ARE NOT BUY RECOMMENDATIONS!
Comments contained in the body of this report are technical
opinions only. The material herein has been obtained
from sources believed to be reliable and accurate, however,
its accuracy and completeness cannot be guaranteed.
This site is not an investment advisor, hence it does
not endorse or recommend any securities or other investments.
Any recommendation contained in this report may not
be suitable for all investors and it is not to be deemed
an offer or solicitation on our part with respect to
the purchase or sale of any securities. All trademarks,
service marks and trade names appearing in this report
are the property of their respective owners, and are
likewise used for identification purposes only.
This report is a service available
only to active Paid Premium Members.
You may opt-out of receiving report notifications
at any time. Questions or comments may be submitted
by writing to Premium Membership Services 665 S.E. 10 Street, Suite 201 Deerfield Beach, FL 33441-5634 or by calling 1-800-965-8307
or 954-785-1121.
|
|
|