You are not logged in.
This means you
CAN ONLY VIEW reports that were published prior to Thursday, March 20, 2025.
You
MUST UPGRADE YOUR MEMBERSHIP if you want to see any current reports.
AFTER MARKET UPDATE - FRIDAY, SEPTEMBER 8TH, 2023
Previous After Market Report Next After Market Report >>>
|
|
|
|
DOW |
+75.86 |
34,576.59 |
+0.22% |
|
Volume |
740,423,987 |
-19% |
|
Volume |
4,204,526,900 |
-5% |
|
NASDAQ |
+12.69 |
13,761.53 |
+0.09% |
|
Advancers |
1,490 |
52% |
|
Advancers |
1,934 |
45% |
|
S&P 500 |
+6.35 |
4,457.49 |
+0.14% |
|
Decliners |
1,363 |
48% |
|
Decliners |
2,322 |
55% |
|
Russell 2000 |
-4.21 |
1,851.54 |
-0.23% |
|
52 Wk Highs |
46 |
|
|
52 Wk Highs |
45 |
|
|
S&P 600 |
-4.53 |
1,185.50 |
-0.38% |
|
52 Wk Lows |
87 |
|
|
52 Wk Lows |
243 |
|
|
 |
Major Averages Posted Modest Gains
Kenneth J. Gruneisen - Passed the CAN SLIM® Master's Exam
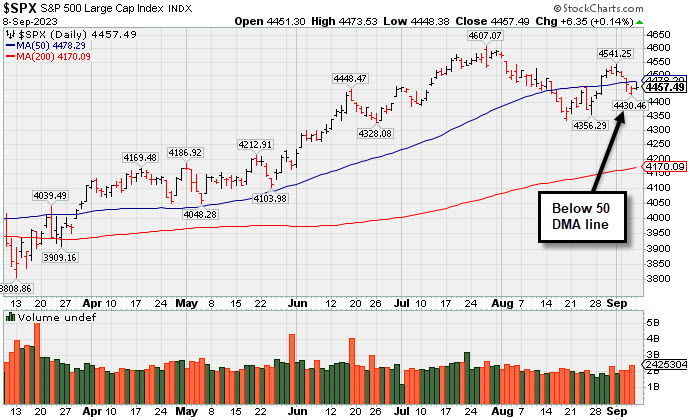
The three major indices closed with modest gains, albeit off their highs of the day. Early upside moves had the S&P 500 and Nasdaq approaching their respective 50-day moving averages. Volume totals reported were lighter than the prior session on the NYSE and on the Nasdaq exchange. Advancers led decliners by a narrow margin on the NYSE and decliners led advancers by a narrow margin on the Nasdaq exchange. There were 25 high-ranked companies from the Leaders List that hit a new 52-week high and were listed on the BreakOuts Page versus the total of 18 on the prior session. New 52-week lows totals solidly outnumbered new 52-week highs totals on both the NYSE and on the Nasdaq exchange. The major indices are in a confirmed uptrend (M criteria).
PICTURED: The S&P 500 Index is sputtering below its 50-day moving average (DMA) line.
Friday's economic data calendar was limited to wholesale inventories for July, which fell 0.2% following a revised 0.7% decline in June (from -0.5%). Apple (AAPL +0.35%) had been up as much as 1.5% but closed just modestly higher. Other mega caps were relative outperformers, offering some support to the broader market.
Eight of the 11 S&P 500 sectors closed in the green led by energy (+1.0%), which climbed alongside oil prices ($87.47/bbl, +0.50, +0.6%). The real estate sector (-0.6%) logged the biggest decline. The 10-yr note yield settled unchanged at 4.26%. The 2-yr note yield rose one basis point to 4.97%.
|
 Kenneth J. Gruneisen started out as a licensed stockbroker in August 1987, a couple of months prior to the historic stock market crash that took the Dow Jones Industrial Average down -22.6% in a single day. He has published daily fact-based fundamental and technical analysis on high-ranked stocks online for two decades. Through FACTBASEDINVESTING.COM, Kenneth provides educational articles, news, market commentary, and other information regarding proven investment systems that work in good times and bad.
Comments contained in the body of this report are technical opinions only and are not necessarily those of Gruneisen Growth Corp. The material herein has been obtained from sources believed to be reliable and accurate, however, its accuracy and completeness cannot be guaranteed. Our firm, employees, and customers may effect transactions, including transactions contrary to any recommendation herein, or have positions in the securities mentioned herein or options with respect thereto. Any recommendation contained in this report may not be suitable for all investors and it is not to be deemed an offer or solicitation on our part with respect to the purchase or sale of any securities. |
|
 |
Financial, Energy, and Networking Indexes Posted Gains
Kenneth J. Gruneisen - Passed the CAN SLIM® Master's Exam
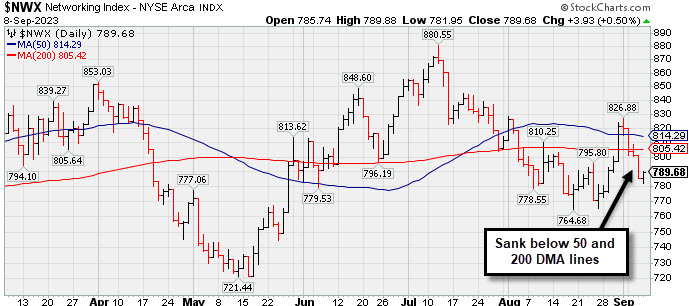
The Bank Index ($BKX +1.11%) and the Broker/Dealer Index ($XBD +0.87%) both posted decent gains while the Retail Index ($RLX +0.15%) inched higher. The Semiconductor Index ($SOX -0.45%) and the Biotech Index ($BTK -0.20%) both edged lower while the Networking Index ($NWX +0.50%) edged higher. The Gold & Silver Index ($XAU -0.04%) was unchanged while the Oil Services Index ($OSX +0.37%) and the Integrated Oil Index ($XOI +1.42%) posted a larger gain.
PICTURED: The Networking Index ($NWX +0.50%) recently sank below its 50-day and 200-day moving average (DMA) lines toward prior lows.
| Oil Services |
$OSX |
96.59 |
+0.36 |
+0.37% |
+15.19% |
| Integrated Oil |
$XOI |
1,958.25 |
+27.38 |
+1.42% |
+9.57% |
| Semiconductor |
$SOX |
3,565.99 |
-16.12 |
-0.45% |
+40.83% |
| Networking |
$NWX |
789.70 |
+3.96 |
+0.50% |
+0.82% |
| Broker/Dealer |
$XBD |
500.80 |
+4.29 |
+0.86% |
+11.50% |
| Retail |
$RLX |
3,630.07 |
+5.28 |
+0.15% |
+31.81% |
| Gold & Silver |
$XAU |
113.16 |
-0.05 |
-0.04% |
-6.37% |
| Bank |
$BKX |
80.39 |
+0.89 |
+1.11% |
-20.29% |
| Biotech |
$BTK |
5,200.40 |
-10.48 |
-0.20% |
-1.53% |
|
|
|
 |
Pulled Back to 200-Day Moving Average Line
Kenneth J. Gruneisen - Passed the CAN SLIM® Master's Exam
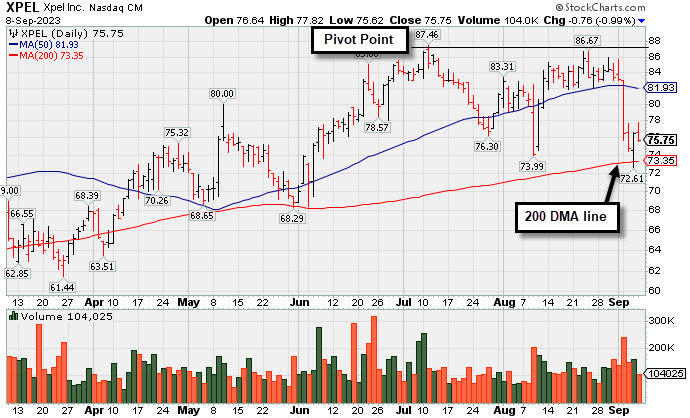
Xpel Inc's (XPEL -$0.76 or -0.99% to $75.75) color code was changed to green after damaging losses violated its 50-day moving average (DMA) line ($81.93) triggering a technical sell signal. It is testing its 200 DMA line ($73.28) with recent losses undercutting the 8/29/23 low. A rebound above the 50 DMA line is needed for tis outlook to improve.
Fundamentals remain strong. It reported Jun '23 quarterly earnings +33% on +22% sales revenues versus the year ago period. XPEL was highlighted in yellow with pivot point cited based on its 8/15/23 high plus 10 cents in the 6/28/23 mid-day report (read here). The 4 latest quarterly comparisons were above the +25% minimum earnings guideline (C criteria), helping it match the winning models of the fact-based investment system.
This Auto/Truck - Replacement Parts firm has a 99 Earnings Per Share Rating. It was last shown in this FSU section on 8/02/23 under the headline, "Consolidating After Rebounding Above 50-Day Moving Average". Annual earnings growth remained strong while it went through a deep consolidation since dropped from the Featured Stocks list on 8/13/21.
The number of top-rated funds owning its shares rose from 45 in Mar '20 to 342 in Jun '23, a reassuring sign concerning the I criteria. Its current Up/Down Volume Ratio of 0.9 is an unbiased indication its shares have been under slight distributional pressure over the past 50 days. Its small supply of only 27.6 million shares outstanding (S criteria) can contribute to greater volatility in the event of institutional buying or selling.
|
|
|
Color Codes Explained :
Y - Better candidates highlighted by our
staff of experts.
G - Previously featured
in past reports as yellow but may no longer be buyable under the
guidelines.
***Last / Change / Volume data in this table is the closing quote data***
Symbol/Exchange
Company Name
Industry Group |
PRICE |
CHANGE
(%Change) |
Day High |
Volume
(% DAV)
(% 50 day avg vol) |
52 Wk Hi
% From Hi |
Featured
Date |
Price
Featured |
Pivot Featured |
|
Max Buy |
 STRL
-
NASDAQ
STRL
-
NASDAQ
Sterling Infrastructure
Bldg-Heavy Construction
|
$78.87
|
-0.23
-0.29% |
$79.97
|
64,408
15.48% of 50 DAV
50 DAV is 416,000
|
$84.00
-6.11%
|
12/14/2022
|
$32.41
|
PP = $33.72
|
|
MB = $35.41
|
Most Recent Note - 9/7/2023 11:44:02 AM
G - Pulling back from its all-time high with today's 3rd consecutive loss on light volume. It is extended from any sound base. The recent low ($73.39 on 8/18/23) defines near-term support above its 50 DMA line ($67.78). Fundamentals remain strong.
>>> FEATURED STOCK ARTICLE : Volume-Driven Gains Leave Construction Firm at All-Time High - 8/9/2023 |
View all notes |
Set NEW NOTE alert |
Company Profile |
SEC
News |
Chart |
Request a new note
C
A
S
I |
FIX
-
NYSE
Comfort Systems USA
Bldg-A/C and Heating Prds
|
$188.48
|
+0.38
0.20% |
$189.82
|
92,070
44.48% of 50 DAV
50 DAV is 207,000
|
$188.29
0.10%
|
4/27/2023
|
$148.85
|
PP = $152.23
|
|
MB = $159.84
|
Most Recent Note - 9/6/2023 8:00:35 PM
G - Posted a gain with average volume today for a new all-time high close. Its 50 DMA line ($172.91) defines important near-term support to watch on pullbacks. Fundamentals remain strong.
>>> FEATURED STOCK ARTICLE : FIX Still Stubbornly Hovering Near High - 8/21/2023 |
View all notes |
Set NEW NOTE alert |
Company Profile |
SEC
News |
Chart |
Request a new note
C
A
S
I |
KOF
-
NYSE
Coca-Cola Femsa ADR
Beverages-Non-Alcoholic
|
$81.81
|
-0.41
-0.50% |
$82.49
|
56,765
37.84% of 50 DAV
50 DAV is 150,000
|
$91.23
-10.33%
|
6/9/2023
|
$88.61
|
PP = $91.33
|
|
MB = $95.90
|
Most Recent Note - 9/6/2023 8:02:12 PM
G - Consolidating near its 50 DMA line ($83.80). Faces some near-term resistance due to overhead supply up to the $91 area. Its Relative Strength Rating is currently 82. Reported Jun '23 quarterly earnings +23% on +26% sales revenues versus the year-ago period, below the +25% minimum guideline (C criteria).
>>> FEATURED STOCK ARTICLE : 50-Day Moving Average Line has Acted as Resistance - 8/10/2023 |
View all notes |
Set NEW NOTE alert |
Company Profile |
SEC
News |
Chart |
Request a new note
C
A
S
I |
CLH
-
NYSE
Clean Harbors
Pollution Control
|
$166.05
|
-1.20
-0.72% |
$167.86
|
328,986
100.92% of 50 DAV
50 DAV is 326,000
|
$178.33
-6.89%
|
3/10/2023
|
$136.89
|
PP = $136.74
|
|
MB = $143.58
|
 Most Recent Note - 9/8/2023 12:15:20 PM
G - Sputtering below its 50 DMA line ($168.68) raising concerns. Reported earnings for the Jun '23 quarter -13% on +3% sales revenues versus the year-ago period, below the +25% minimum earnings guideline (C criteria), raising fundamental concerns.
>>> FEATURED STOCK ARTICLE : Volume Totals Have Been Cooling While Hovering Near High - 8/18/2023 |
View all notes |
Set NEW NOTE alert |
Company Profile |
SEC
News |
Chart |
Request a new note
C
A
S
I |
HUBB
-
NYSE
Hubbell
Electrical-Power/Equipmt
|
$330.24
|
+5.22
1.60% |
$330.75
|
167,796
38.66% of 50 DAV
50 DAV is 434,000
|
$340.06
-2.89%
|
4/25/2023
|
$262.85
|
PP = $257.51
|
|
MB = $270.39
|
Most Recent Note - 9/6/2023 8:01:21 PM
G - Perched only -6.8% off its all-time high but slumped below its 50 DMA line ($319.84) with a volume-driven loss on the prior session. A rebound above the 50 DMA line is needed for its outlook to improve. Fundamentals remain strong after Jun '23 earnings rose +45% on +9% sales revenues versus the year-ago period.
>>> FEATURED STOCK ARTICLE : Rebounded Near 50-Day Moving Average Line - 8/24/2023 |
View all notes |
Set NEW NOTE alert |
Company Profile |
SEC
News |
Chart |
Request a new note
C
A
S
I |
Symbol/Exchange
Company Name
Industry Group |
PRICE |
CHANGE
(%Change) |
Day High |
Volume
(% DAV)
(% 50 day avg vol) |
52 Wk Hi
% From Hi |
Featured
Date |
Price
Featured |
Pivot Featured |
|
Max Buy |
AMPH
-
NASDAQ
Amphastar Pharm
Medical-Biomed/Biotech
|
$50.76
|
-0.48
-0.94% |
$51.68
|
69,857
18.98% of 50 DAV
50 DAV is 368,000
|
$67.66
-24.98%
|
5/15/2023
|
$43.56
|
PP = $44.15
|
|
MB = $46.36
|
Most Recent Note - 9/6/2023 7:54:39 PM
G - Sputtering below its 50 DMA line ($57.25) and a rebound above the 50 DMA line is still needed for its outlook to improve. Fundamentals remain strong after it reported Jun '23 quarterly earnings +67% on +18% sales revenues versus the year-ago period.
>>> FEATURED STOCK ARTICLE : Rebound Above 50-Day Moving Average Needed for Outlook to Improve - 8/22/2023 |
View all notes |
Set NEW NOTE alert |
Company Profile |
SEC
News |
Chart |
Request a new note
C
A
S
I |
ANET
-
NYSE
Arista Networks
Computer-Networking
|
$195.04
|
-0.50
-0.26% |
$197.43
|
626,198
22.79% of 50 DAV
50 DAV is 2,748,000
|
$198.70
-1.84%
|
8/1/2023
|
$188.84
|
PP = $178.46
|
|
MB = $187.38
|
Most Recent Note - 9/6/2023 7:56:26 PM
G - Color code is changed to green while perched at its all-time high after an 8th consecutive small gain with light volume. Fundamentals remain strong.
>>> FEATURED STOCK ARTICLE : Hovering Near High with Volume Totals Cooling - 8/14/2023 |
View all notes |
Set NEW NOTE alert |
Company Profile |
SEC
News |
Chart |
Request a new note
C
A
S
I |
LSCC
-
NASDAQ
Lattice Semiconductor
Elec-Semicondctor Fablss
|
$91.74
|
-0.70
-0.76% |
$92.89
|
244,860
14.94% of 50 DAV
50 DAV is 1,639,000
|
$98.30
-6.67%
|
6/13/2023
|
$91.73
|
PP = $96.92
|
|
MB = $101.77
|
Most Recent Note - 9/7/2023 11:06:55 PM
G - Gapped down today testuing its 50 DMA line ($91.87), retreating from its 52-week high after recent gains lacking great volume conviction. Reported Jun '23 quarterly earnings +24% on +18% sales revenues versus the year-ago period, just below the +25% minimum earnings guideline (C criteria).
>>> FEATURED STOCK ARTICLE : Rebound Needed Above 50-Day Moving Average for Lattice - 8/17/2023 |
View all notes |
Set NEW NOTE alert |
Company Profile |
SEC
News |
Chart |
Request a new note
C
A
S
I |
XPEL
-
NASDAQ
Xpel Inc
Auto/Truck-Tires andamp; Misc
|
$76.81
|
+0.30
0.39% |
$77.83
|
43,827
35.43% of 50 DAV
50 DAV is 123,700
|
$87.01
-11.72%
|
8/22/2023
|
$84.64
|
PP = $87.56
|
|
MB = $91.94
|
Most Recent Note - 9/7/2023 11:46:54 AM
G - Color code is changed to green after damaging losses violated its 50 DMA line ($82) triggering a technical sell signal. It is testing its 200 DMA line ($73.28) with today's loss undercutting the 8/29/23 low. Fundamentals remain strong.
>>> FEATURED STOCK ARTICLE : Consolidating After Rebounding Above 50-Day Moving Average - 8/2/2023 |
View all notes |
Set NEW NOTE alert |
Company Profile |
SEC
News |
Chart |
Request a new note
C
A
S
I |
ESQ
-
NASDAQ
Esquire Finl Hldgs
Finance-Commercial Loans
|
$46.88
|
+0.36
0.77% |
$47.50
|
8,067
35.07% of 50 DAV
50 DAV is 23,000
|
$54.03
-13.24%
|
7/14/2023
|
$45.80
|
PP = $48.23
|
|
MB = $50.64
|
Most Recent Note - 9/6/2023 7:59:22 PM
G - Its 50 DMA line ($47.86) has acted as resistance. Consolidating near prior highs in the $47 area. A rebound above the 50 DMA line is needed for its outlook to improve.
>>> FEATURED STOCK ARTICLE : Pullback with Light Volume Testing Important Support Level - 8/15/2023 |
View all notes |
Set NEW NOTE alert |
Company Profile |
SEC
News |
Chart |
Request a new note
C
A
S
I |
Symbol/Exchange
Company Name
Industry Group |
PRICE |
CHANGE
(%Change) |
Day High |
Volume
(% DAV)
(% 50 day avg vol) |
52 Wk Hi
% From Hi |
Featured
Date |
Price
Featured |
Pivot Featured |
|
Max Buy |
MEDP
-
NASDAQ
Medpace Holdings
Medical-Research Eqp/Svc
|
$270.88
|
-0.82
-0.30% |
$272.82
|
65,608
24.21% of 50 DAV
50 DAV is 271,000
|
$274.62
-1.36%
|
7/25/2023
|
$196.32
|
PP = $241.57
|
|
MB = $253.65
|
Most Recent Note - 9/7/2023 11:39:37 AM
G - Found support above its 50 DMA line ($253) and wedged to new highs above its "max buy" level with recent gains lacking great volume conviction and its color code is changed to green. Fundamentals remain strong.
>>> FEATURED STOCK ARTICLE : Consolidating Above 50-Day Moving Average - 8/23/2023 |
View all notes |
Set NEW NOTE alert |
Company Profile |
SEC
News |
Chart |
Request a new note
C
A
S
I |
COKE
-
NASDAQ
Coca-Cola Consolidated
Beverages-Non-Alcoholic
|
$648.32
|
-14.07
-2.12% |
$661.76
|
9,414
24.14% of 50 DAV
50 DAV is 39,000
|
$745.53
-13.04%
|
8/3/2023
|
$718.56
|
PP = $694.30
|
|
MB = $729.02
|
Most Recent Note - 9/6/2023 7:58:10 PM
G - Volume was average today, consolidating near its 50 DMA line ($666). Slump below its pivot point has raised concerns. Fundamentals remain strong.
>>> FEATURED STOCK ARTICLE : Powerful Breakout for COKE - 8/3/2023 |
View all notes |
Set NEW NOTE alert |
Company Profile |
SEC
News |
Chart |
Request a new note
C
A
S
I |
PLUS
-
NASDAQ
ePlus
Computer-Tech Services
|
$65.14
|
-0.31
-0.47% |
$65.71
|
18,141
17.96% of 50 DAV
50 DAV is 101,000
|
$75.90
-14.18%
|
8/8/2023
|
$67.60
|
PP = $62.92
|
|
MB = $66.07
|
Most Recent Note - 9/7/2023 11:41:21 AM
Y - Still consolidating since a noted "breakaway gap" on 8/08/23. Fundamentals remain strong. The recent low and 50 DMA line define important near-term support in the $61 area.
>>> FEATURED STOCK ARTICLE : ePLUS Gapped Up but Ended in Lower Half of Intra-Day Range - 8/8/2023 |
View all notes |
Set NEW NOTE alert |
Company Profile |
SEC
News |
Chart |
Request a new note
C
A
S
I |
|
|
|
THESE ARE NOT BUY RECOMMENDATIONS!
Comments contained in the body of this report are technical
opinions only. The material herein has been obtained
from sources believed to be reliable and accurate, however,
its accuracy and completeness cannot be guaranteed.
This site is not an investment advisor, hence it does
not endorse or recommend any securities or other investments.
Any recommendation contained in this report may not
be suitable for all investors and it is not to be deemed
an offer or solicitation on our part with respect to
the purchase or sale of any securities. All trademarks,
service marks and trade names appearing in this report
are the property of their respective owners, and are
likewise used for identification purposes only.
This report is a service available
only to active Paid Premium Members.
You may opt-out of receiving report notifications
at any time. Questions or comments may be submitted
by writing to Premium Membership Services 665 S.E. 10 Street, Suite 201 Deerfield Beach, FL 33441-5634 or by calling 1-800-965-8307
or 954-785-1121.
|
|
|