You are not logged in.
This means you
CAN ONLY VIEW reports that were published prior to Thursday, March 20, 2025.
You
MUST UPGRADE YOUR MEMBERSHIP if you want to see any current reports.
AFTER MARKET UPDATE - TUESDAY, SEPTEMBER 12TH, 2023
Previous After Market Report Next After Market Report >>>
|
|
|
|
DOW |
-17.73 |
34,645.99 |
-0.05% |
|
Volume |
780,318,238 |
+0% |
|
Volume |
4,633,191,600 |
+0% |
|
NASDAQ |
-144.28 |
13,773.61 |
-1.04% |
|
Advancers |
1,334 |
47% |
|
Advancers |
1,909 |
45% |
|
S&P 500 |
-25.56 |
4,461.90 |
-0.57% |
|
Decliners |
1,516 |
53% |
|
Decliners |
2,343 |
55% |
|
Russell 2000 |
+0.18 |
1,855.32 |
+0.01% |
|
52 Wk Highs |
64 |
|
|
52 Wk Highs |
61 |
|
|
S&P 600 |
-0.97 |
1,185.37 |
-0.08% |
|
52 Wk Lows |
90 |
|
|
52 Wk Lows |
197 |
|
|
 |
Major Averages Ended Lower After Positive Start
Kenneth J. Gruneisen - Passed the CAN SLIM® Master's Exam
The Dow Jones Industrial Average finished with a small loss while the S&P 500 and Nasdaq Composite closed near their worst levels of the day. Volume totals reported were slightly higher than the prior session on the NYSE and on the Nasdaq exchange. Decliners led advancers by a narrow margin on the NYSE and on the Nasdaq exchange. There were 26 high-ranked companies from the Leaders List that hit a new 52-week high and were listed on the BreakOuts Page versus the total of 24 on the prior session. New 52-week lows totals still outnumbered new 52-week highs totals on both the NYSE and on the Nasdaq exchange. The major indices are in a confirmed uptrend (M criteria).
PICTURED: The S&P 600 Small Cap Index recently slumped below its 200-day moving average (DMA) line.
Tuesday's session started with a positive bias but the major indices ended lower. In the mega cap space, Oracle (ORCL -13.50%) was slammed following its earnings report and relatively disappointing guidance. Apple (AAPL-1.71%) was weak in front of its closely-watched product event and pulled back following a slate of announcements that featured the introduction of the iPhone 15.
Rising oil prices ($89.95/bbl, +1.66, +1.9%), which hit their highest level since last November, were another overhang for the market. That move benefited the S&P 500 energy sector (+2.3%) and made it the top performing sector, meanwhile, the heavily-weighted information technology sector (-1.8%) logged the biggest decline.
Treasuries settled little changed. The 2-yr note yield rose one basis points to 5.00% and the 10-yr note yield fell two basis points to 4.26%. The only new economic data was limited to the August NFIB Small Business Optimism index, which declined to 91.3 from 91.9. The August Consumer Price Index is due at 8:30AM on Wednesday.
|
 Kenneth J. Gruneisen started out as a licensed stockbroker in August 1987, a couple of months prior to the historic stock market crash that took the Dow Jones Industrial Average down -22.6% in a single day. He has published daily fact-based fundamental and technical analysis on high-ranked stocks online for two decades. Through FACTBASEDINVESTING.COM, Kenneth provides educational articles, news, market commentary, and other information regarding proven investment systems that work in good times and bad.
Comments contained in the body of this report are technical opinions only and are not necessarily those of Gruneisen Growth Corp. The material herein has been obtained from sources believed to be reliable and accurate, however, its accuracy and completeness cannot be guaranteed. Our firm, employees, and customers may effect transactions, including transactions contrary to any recommendation herein, or have positions in the securities mentioned herein or options with respect thereto. Any recommendation contained in this report may not be suitable for all investors and it is not to be deemed an offer or solicitation on our part with respect to the purchase or sale of any securities. |
|
 |
Financial and Energy-Linked Groups Led Gainers
Kenneth J. Gruneisen - Passed the CAN SLIM® Master's Exam
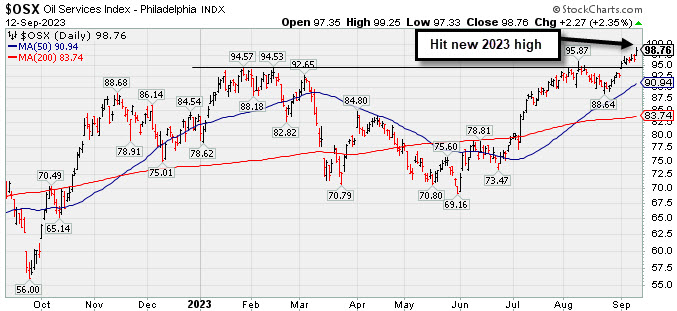
The Retail Index ($RLX -0.98%) lost ground while the Bank Index ($BKX +1.73%) and the Broker/Dealer Index ($XBD +0.68%) both posted gains. The tech sector was mixed as the Biotech Index ($BTK +0.52%) edged higher while the Semiconductor Index ($SOX -0.79%) and the Networking Index ($NWX -1.019%) ended lower. The Gold & Silver Index ($XAU +0.10%) finished flat while the Oil Services Index ($OSX +2.35%) and the Integrated Oil Index ($XOI +2.07%) both posted standout gains.
PICTURED: The Oil Services Index ($OSX +2.35%) posted a standout gain and hit a new 2023 high.
| Oil Services |
$OSX |
98.76 |
+2.27 |
+2.35% |
+17.77% |
| Integrated Oil |
$XOI |
1,974.32 |
+40.13 |
+2.07% |
+10.47% |
| Semiconductor |
$SOX |
3,541.09 |
-28.14 |
-0.79% |
+39.85% |
| Networking |
$NWX |
780.22 |
-7.96 |
-1.01% |
-0.39% |
| Broker/Dealer |
$XBD |
504.29 |
+3.42 |
+0.68% |
+12.28% |
| Retail |
$RLX |
3,664.70 |
-36.32 |
-0.98% |
+33.07% |
| Gold & Silver |
$XAU |
115.00 |
+0.12 |
+0.10% |
-4.85% |
| Bank |
$BKX |
82.02 |
+1.39 |
+1.73% |
-18.67% |
| Biotech |
$BTK |
5,256.39 |
+27.31 |
+0.52% |
-0.47% |
|
|
|
 |
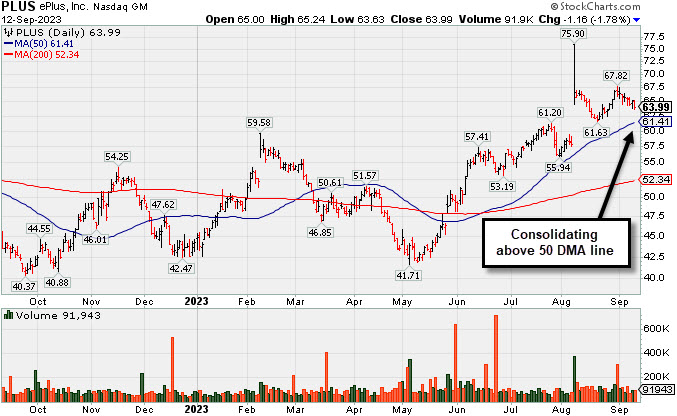
Still Consolidating Above 50 DMA Line
Kenneth J. Gruneisen - Passed the CAN SLIM® Master's Exam
ePlus (PLUS -$1.16 or -1.78% to $63.99) has still been consolidating since a noted "breakaway gap" on 8/08/23. Fundamentals remain strong. The recent low and 50-day moving average (DMA) line ($61.41) define important near-term support in the $61 area.
Bullish action came after it reported earnings +42% on +25% sales revenues for the Jun '23 quarter versus the year ago period, its 3rd consecutive quarterly earnings increase above the +25% minimum guideline (C criteria), helping it better match the winning models of the fact-based investment system. Annual earnings growth (A criteria) has been strong. It has a 97 earnings Per Share rating.
It hails from the Computer-Tech Services group which is currently ranked 61st on the 197 Industry Groups list. The small supply of only 26.9 million shares outstanding (S criteria) can contribute to greater price volatility in the event of institutional buying or selling. The number of top-rated funds owning its shares reportedly fell from 422 in Sep '22 to 409 in Jun '23, not a reassuring sign concerning the I criteria. Meanwhile, its current Up/Down Volume ratio of 1.1 is an unbiased indication its shares have been under slight accumulation over the past 50 days. |
|
|
Color Codes Explained :
Y - Better candidates highlighted by our
staff of experts.
G - Previously featured
in past reports as yellow but may no longer be buyable under the
guidelines.
***Last / Change / Volume data in this table is the closing quote data***
Symbol/Exchange
Company Name
Industry Group |
PRICE |
CHANGE
(%Change) |
Day High |
Volume
(% DAV)
(% 50 day avg vol) |
52 Wk Hi
% From Hi |
Featured
Date |
Price
Featured |
Pivot Featured |
|
Max Buy |
 STRL
-
NASDAQ
STRL
-
NASDAQ
Sterling Infrastructure
Bldg-Heavy Construction
|
$76.09
|
-1.34
-1.73% |
$78.44
|
274,792
66.37% of 50 DAV
50 DAV is 414,000
|
$84.00
-9.42%
|
12/14/2022
|
$32.41
|
PP = $33.72
|
|
MB = $35.41
|
 Most Recent Note - 9/12/2023 5:31:52 PM
G - Pulled back from its all-time high with today's 6th consecutive loss on light volume. It is extended from any sound base. The recent low ($73.39 on 8/18/23) defines near-term support above its 50 DMA line ($69.12). Fundamentals remain strong.
>>> FEATURED STOCK ARTICLE : Volume-Driven Gains Leave Construction Firm at All-Time High - 8/9/2023 |
View all notes |
Set NEW NOTE alert |
Company Profile |
SEC
News |
Chart |
Request a new note
C
A
S
I |
FIX
-
NYSE
Comfort Systems USA
Bldg-A/C and Heating Prds
|
$187.47
|
-0.66
-0.35% |
$189.91
|
414,183
199.13% of 50 DAV
50 DAV is 208,000
|
$189.82
-1.24%
|
4/27/2023
|
$148.85
|
PP = $152.23
|
|
MB = $159.84
|
Most Recent Note - 9/11/2023 6:35:00 PM
G - Posted a small gain with average volume today for a best-ever close. Its 50 DMA line ($174.39) defines important near-term support to watch on pullbacks. Fundamentals remain strong.
>>> FEATURED STOCK ARTICLE : FIX Still Stubbornly Hovering Near High - 8/21/2023 |
View all notes |
Set NEW NOTE alert |
Company Profile |
SEC
News |
Chart |
Request a new note
C
A
S
I |
KOF
-
NYSE
Coca Cola Femsa Sab Ads
FOOD and BEVERAGE - Beverages - Soft Drinks
|
$79.65
|
-2.50
-3.04% |
$82.15
|
281,132
189.31% of 50 DAV
50 DAV is 148,500
|
$91.23
-12.69%
|
6/9/2023
|
$88.61
|
PP = $91.33
|
|
MB = $95.90
|
Most Recent Note - 9/12/2023 12:37:46 PM
G - Raising concerns while slumping further below its 50 DMA line ($83.63) and toward its 200 DMA line ($79) with today's loss. Faces some near-term resistance due to overhead supply up to the $91 area. Its Relative Strength Rating is currently 79. Reported Jun '23 quarterly earnings +23% on +26% sales revenues versus the year-ago period, below the +25% minimum guideline (C criteria).
>>> FEATURED STOCK ARTICLE : 50-Day Moving Average Line has Acted as Resistance - 8/10/2023 |
View all notes |
Set NEW NOTE alert |
Company Profile |
SEC
News |
Chart |
Request a new note
C
A
S
I |
CLH
-
NYSE
Clean Harbors
Pollution Control
|
$167.22
|
+1.87
1.13% |
$168.34
|
226,706
69.12% of 50 DAV
50 DAV is 328,000
|
$178.33
-6.23%
|
3/10/2023
|
$136.89
|
PP = $136.74
|
|
MB = $143.58
|
Most Recent Note - 9/12/2023 5:33:46 PM
G - Posted a gain today with light volume but remains below its 50 DMA line ($168.79). A rebound above the 50 DMA line is needed for its outlook to improve. Reported earnings for the Jun '23 quarter -13% on +3% sales revenues versus the year-ago period, below the +25% minimum earnings guideline (C criteria), raising fundamental concerns.
>>> FEATURED STOCK ARTICLE : Volume Totals Have Been Cooling While Hovering Near High - 8/18/2023 |
View all notes |
Set NEW NOTE alert |
Company Profile |
SEC
News |
Chart |
Request a new note
C
A
S
I |
HUBB
-
NYSE
Hubbell
Electrical-Power/Equipmt
|
$318.93
|
-7.52
-2.30% |
$331.67
|
365,336
85.16% of 50 DAV
50 DAV is 429,000
|
$340.06
-6.21%
|
4/25/2023
|
$262.85
|
PP = $257.51
|
|
MB = $270.39
|
Most Recent Note - 9/11/2023 6:36:15 PM
G - Perched only -4% off its all-time high, consolidating above its 50 DMA line ($320). Fundamentals remain strong after Jun '23 earnings rose +45% on +9% sales revenues versus the year-ago period.
>>> FEATURED STOCK ARTICLE : Rebounded Near 50-Day Moving Average Line - 8/24/2023 |
View all notes |
Set NEW NOTE alert |
Company Profile |
SEC
News |
Chart |
Request a new note
C
A
S
I |
Symbol/Exchange
Company Name
Industry Group |
PRICE |
CHANGE
(%Change) |
Day High |
Volume
(% DAV)
(% 50 day avg vol) |
52 Wk Hi
% From Hi |
Featured
Date |
Price
Featured |
Pivot Featured |
|
Max Buy |
ANET
-
NYSE
Arista Networks
Computer-Networking
|
$189.03
|
-4.16
-2.15% |
$192.75
|
1,506,092
55.31% of 50 DAV
50 DAV is 2,723,000
|
$198.70
-4.87%
|
8/1/2023
|
$188.84
|
PP = $178.46
|
|
MB = $187.38
|
Most Recent Note - 9/11/2023 6:33:54 PM
G - Pulled back today with light volume. Remains perched near its all-time high. Fundamentals remain strong.
>>> FEATURED STOCK ARTICLE : Hovering Near High with Volume Totals Cooling - 8/14/2023 |
View all notes |
Set NEW NOTE alert |
Company Profile |
SEC
News |
Chart |
Request a new note
C
A
S
I |
LSCC
-
NASDAQ
Lattice Semiconductor
Elec-Semicondctor Fablss
|
$88.95
|
-1.04
-1.16% |
$90.71
|
1,399,156
86.31% of 50 DAV
50 DAV is 1,621,000
|
$98.30
-9.51%
|
6/13/2023
|
$91.73
|
PP = $96.92
|
|
MB = $101.77
|
Most Recent Note - 9/11/2023 6:38:06 PM
G - Pulled back today and closed below its 50 DMA line ($91.61) raising some concerns. Reported Jun '23 quarterly earnings +24% on +18% sales revenues versus the year-ago period, just below the +25% minimum earnings guideline (C criteria).
>>> FEATURED STOCK ARTICLE : Rebound Needed Above 50-Day Moving Average for Lattice - 8/17/2023 |
View all notes |
Set NEW NOTE alert |
Company Profile |
SEC
News |
Chart |
Request a new note
C
A
S
I |
ESQ
-
NASDAQ
Esquire Finl Hldgs
Finance-Commercial Loans
|
$47.23
|
+0.32
0.68% |
$47.38
|
11,339
51.54% of 50 DAV
50 DAV is 22,000
|
$54.03
-12.59%
|
7/14/2023
|
$45.80
|
PP = $48.23
|
|
MB = $50.64
|
Most Recent Note - 9/12/2023 5:34:37 PM
G - Its 50 DMA line ($47.99) has acted as resistance while still consolidating near prior highs in the $47 area. A rebound above the 50 DMA line is needed for its outlook to improve.
>>> FEATURED STOCK ARTICLE : Pullback with Light Volume Testing Important Support Level - 8/15/2023 |
View all notes |
Set NEW NOTE alert |
Company Profile |
SEC
News |
Chart |
Request a new note
C
A
S
I |
MEDP
-
NASDAQ
Medpace Holdings
Medical-Research Eqp/Svc
|
$279.54
|
+0.19
0.07% |
$281.94
|
220,902
82.12% of 50 DAV
50 DAV is 269,000
|
$280.12
-0.21%
|
7/25/2023
|
$196.32
|
PP = $241.57
|
|
MB = $253.65
|
Most Recent Note - 9/11/2023 6:32:24 PM
G - Posted a solid gain today for a new all-time high. Prior high ($269) defines initial support to watch above its 50 DMA line ($255). Fundamentals remain strong.
>>> FEATURED STOCK ARTICLE : Consolidating Above 50-Day Moving Average - 8/23/2023 |
View all notes |
Set NEW NOTE alert |
Company Profile |
SEC
News |
Chart |
Request a new note
C
A
S
I |
COKE
-
NASDAQ
Coca-Cola Consolidated
Beverages-Non-Alcoholic
|
$672.70
|
-3.30
-0.49% |
$682.00
|
33,708
82.21% of 50 DAV
50 DAV is 41,000
|
$745.53
-9.77%
|
8/3/2023
|
$718.56
|
PP = $694.30
|
|
MB = $729.02
|
Most Recent Note - 9/11/2023 6:29:57 PM
G - Posted a gain today, rebounding above its 50 DMA line ($667) helping its outlook to improve. See the latest FSU analysis for more details and a new annotated graph.
>>> FEATURED STOCK ARTICLE : Rebounded Above 50-Day Moving Average - 9/11/2023 |
View all notes |
Set NEW NOTE alert |
Company Profile |
SEC
News |
Chart |
Request a new note
C
A
S
I |
Symbol/Exchange
Company Name
Industry Group |
PRICE |
CHANGE
(%Change) |
Day High |
Volume
(% DAV)
(% 50 day avg vol) |
52 Wk Hi
% From Hi |
Featured
Date |
Price
Featured |
Pivot Featured |
|
Max Buy |
PLUS
-
NASDAQ
ePlus
Computer-Tech Services
|
$63.99
|
-1.16
-1.78% |
$65.24
|
91,943
91.03% of 50 DAV
50 DAV is 101,000
|
$75.90
-15.69%
|
8/8/2023
|
$67.60
|
PP = $62.92
|
|
MB = $66.07
|
Most Recent Note - 9/12/2023 5:31:07 PM
Y - Still consolidating since a noted "breakaway gap" on 8/08/23. Fundamentals remain strong. The recent low and 50 DMA line define important near-term support in the $61 area.See the latest FSU analysis for more details and a new annotated graph.
>>> FEATURED STOCK ARTICLE : Still Consolidating Above 50 DMA Line - 9/12/2023 |
View all notes |
Set NEW NOTE alert |
Company Profile |
SEC
News |
Chart |
Request a new note
C
A
S
I |
|
|
|
THESE ARE NOT BUY RECOMMENDATIONS!
Comments contained in the body of this report are technical
opinions only. The material herein has been obtained
from sources believed to be reliable and accurate, however,
its accuracy and completeness cannot be guaranteed.
This site is not an investment advisor, hence it does
not endorse or recommend any securities or other investments.
Any recommendation contained in this report may not
be suitable for all investors and it is not to be deemed
an offer or solicitation on our part with respect to
the purchase or sale of any securities. All trademarks,
service marks and trade names appearing in this report
are the property of their respective owners, and are
likewise used for identification purposes only.
This report is a service available
only to active Paid Premium Members.
You may opt-out of receiving report notifications
at any time. Questions or comments may be submitted
by writing to Premium Membership Services 665 S.E. 10 Street, Suite 201 Deerfield Beach, FL 33441-5634 or by calling 1-800-965-8307
or 954-785-1121.
|
|
|