You are not logged in.
This means you
CAN ONLY VIEW reports that were published prior to Friday, April 4, 2025.
You
MUST UPGRADE YOUR MEMBERSHIP if you want to see any current reports.
AFTER MARKET UPDATE - FRIDAY, AUGUST 5TH, 2016
Previous After Market Report Next After Market Report >>>
|
|
|
|
DOW |
+191.48 |
18,543.53 |
+1.04% |
|
Volume |
843,535,250 |
+6% |
|
Volume |
1,839,630,780 |
+7% |
|
NASDAQ |
+54.87 |
5,221.12 |
+1.06% |
|
Advancers |
2,146 |
73% |
|
Advancers |
2,062 |
72% |
|
S&P 500 |
+18.62 |
2,182.87 |
+0.86% |
|
Decliners |
810 |
27% |
|
Decliners |
795 |
28% |
|
Russell 2000 |
+17.54 |
1,231.30 |
+1.45% |
|
52 Wk Highs |
228 |
|
|
52 Wk Highs |
166 |
|
|
S&P 600 |
+9.81 |
746.67 |
+1.33% |
|
52 Wk Lows |
4 |
|
|
52 Wk Lows |
27 |
|
|
 |
Major Indices Rally as Higher Volume Signals Institutional Buying
Kenneth J. Gruneisen - Passed the CAN SLIM® Master's Exam
Stocks finished firmly higher on Friday. The Dow was up 191 points to 18543. The S&P 500 gained 18 points to 2182 and the Nasdaq Composite added 54 points to 5221. The benchmark S&P 500 Index, the S&P 400 Mid Cap, and the S&P 600 Small Cap Index each hit new record highs. The volume totals were higher than the prior session on the NYSE and on the Nasdaq exchange, indicating an increase in institutional buying demand. Advancers led decliners by an 11-4 margin on the NYSE and on the Nasdaq exchange. There were 51 high-ranked companies from the Leaders List that made new 52-week highs and were listed on the BreakOuts Page, versus the total of 26 on the prior session. New 52-week highs solidly outnumbered new 52-week lows on both the NYSE and the Nasdaq exchange.
PICTURED: The Dow Jones Industrial Average rebounded near its record high.
Big gains for the major indices were noted in prior commentaries and that bullish action signaled a new "confirmed uptrend" for the market (M criteria). See the Featured Stocks Page which now lists a few noteworthy candidates that have made headway. The S&P 500 climbed to an all-time high on Friday following a better-than-expected jobs report. Non-farm payrolls added 255,000 in July versus a projected gain of 180,000 and the revised 5,000 increase in June. The labor force participation rate ticked up 0.1% to 62.8% while the unemployment rate held steady at 4.9%. The probability of a 2016 rate hike in the U.S. climbed to 47% from 37% before the job release according to Bloomberg data. Eight of 10 sectors in the S&P 500 finished in positive territory. Financials paced the gains with Charles Schwab (SCHW +5.05%). Kraft Heinz (KHC+3.80%) rose after exceeding analyst profit expectations. Priceline (PCLN +3.99%) gained as the online travel services company reported hotel bookings rose in the quarter. Bristol-Myers Squibb (BMY -15.99%) tumbled after announcing negative results in a clinical trial treatment. Merck (MRK +10.41%) rallied with the Bristol-Myers news as the company sells a competing product. Treasuries declined with the benchmark 10-year note down 23/32 to yield 1.58%. In commodities, NYMEX WTI crude was off 0.2% to $41.86/barrel. COMEX gold fell 1.7% to $1336.40/ounce. In FOREX, the Dollar Index advanced 0.5%. |
 Kenneth J. Gruneisen started out as a licensed stockbroker in August 1987, a couple of months prior to the historic stock market crash that took the Dow Jones Industrial Average down -22.6% in a single day. He has published daily fact-based fundamental and technical analysis on high-ranked stocks online for two decades. Through FACTBASEDINVESTING.COM, Kenneth provides educational articles, news, market commentary, and other information regarding proven investment systems that work in good times and bad.
Comments contained in the body of this report are technical opinions only and are not necessarily those of Gruneisen Growth Corp. The material herein has been obtained from sources believed to be reliable and accurate, however, its accuracy and completeness cannot be guaranteed. Our firm, employees, and customers may effect transactions, including transactions contrary to any recommendation herein, or have positions in the securities mentioned herein or options with respect thereto. Any recommendation contained in this report may not be suitable for all investors and it is not to be deemed an offer or solicitation on our part with respect to the purchase or sale of any securities. |
|
 |
Financial, Retail, Technology and Energy Groups Gained
Kenneth J. Gruneisen - Passed the CAN SLIM® Master's Exam
Financials gave a big boost to the major averages as the Bank Index ($BKX +3.18%) and Broker/Dealer Index ($XBD +1.96%) rallied on Friday. The Retail Index ($RLX +1.14%) rose, and the tech sector saw unanimous gains from the Biotechnology Index ($BTK +1.99%), Semiconductor Index ($SOX +1.34%) and Networking Index ($NWX +2.43%). Energy-linked groups also rose as the Oil Services Index ($OSX +1.66%) outpaced the Integrated Oil Index ($XOI +0.26%). Meanwhile, the Gold & Silver Index ($XAU -2.85%) was a standout decliner. Charts courtesy www.stockcharts.com
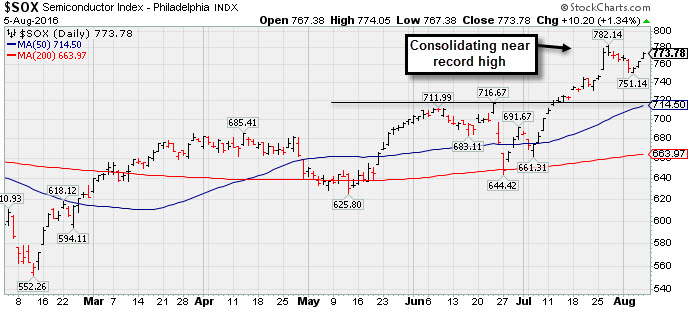
PICTURED: The Semiconductor Index ($SOX +1.34%) is consolidating near record highs.
| Oil Services |
$OSX |
161.32 |
+2.64 |
+1.66% |
+2.28% |
| Integrated Oil |
$XOI |
1,118.93 |
+14.01 |
+1.27% |
+4.31% |
| Semiconductor |
$SOX |
773.78 |
+10.21 |
+1.34% |
+16.62% |
| Networking |
$NWX |
389.10 |
+7.94 |
+2.08% |
+3.50% |
| Broker/Dealer |
$XBD |
166.53 |
+4.76 |
+2.94% |
-6.49% |
| Retail |
$RLX |
1,371.00 |
+15.45 |
+1.14% |
+6.82% |
| Gold & Silver |
$XAU |
109.61 |
-3.22 |
-2.85% |
+141.96% |
| Bank |
$BKX |
69.99 |
+2.15 |
+3.17% |
-4.23% |
| Biotech |
$BTK |
3,456.23 |
+15.60 |
+0.45% |
-9.38% |
|
|
|
 |
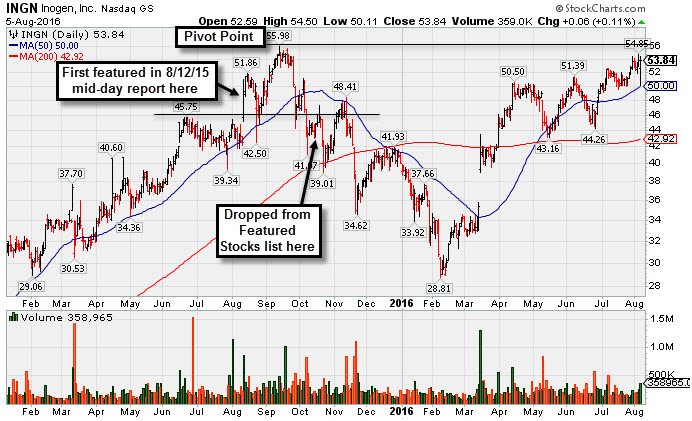
Perched Within Striking Distance of Highs Following Rebound
Kenneth J. Gruneisen - Passed the CAN SLIM® Master's Exam
Inogen Inc (INGN +$0.06 or +0.11% to $53.84) was highlighted in yellow with new pivot point cited based on its 9/14/15 high plus 10 cents in the earlier mid-day report (read here). Recently it has been rebounding near its 52-week high, however, a volume-driven gain above the pivot point is still needed to trigger a technical buy signal.
The Dec '15, Mar and Jun '16 quarters showed earnings increases above the +25% minimum guideline (C criteria). Sales revenues growth has been in the +24-39% range, a reassuring sign of increasing demand for its new products and services (N criteria). Annual earnings (A criteria) growth has been strong.
INGN waslast shown in this FSU section on 10/14/15 with an annotated graph under the headline, "Slumping Further After Recent Sell Signal Triggered", and it went through a deep consolidation below its 200 DMA line and rebounded since dropped from the Featured Stocks list on 10/16/15. It had triggered a technical sell signal with big volume-driven losses undercutting its 50-day moving average (DMA) line and prior highs near $45.
The number of top-rated funds owning its shares rose from 114 in Sep '14 to 318 in Jun '16, a reassuring sign concerning the I criteria. Its small supply of only 15.1 million shares (S criteria) in the public float can contribute to greater price volatility in the event of institutional buying or selling. it is up considerably from its $16 IPO on 2/14/14 followed by a Secondary Offering on 10/30/14.
|
|
|
Color Codes Explained :
Y - Better candidates highlighted by our
staff of experts.
G - Previously featured
in past reports as yellow but may no longer be buyable under the
guidelines.
***Last / Change / Volume data in this table is the closing quote data***
Symbol/Exchange
Company Name
Industry Group |
PRICE |
CHANGE
(%Change) |
Day High |
Volume
(% DAV)
(% 50 day avg vol) |
52 Wk Hi
% From Hi |
Featured
Date |
Price
Featured |
Pivot Featured |
|
Max Buy |
TDG
-
NYSE
Transdigm Group Inc
AEROSPACE/DEFENSE - Aerospace/Defense Products and; Services
|
$280.61
|
+2.82
1.02% |
$280.75
|
303,988
41.42% of 50 DAV
50 DAV is 734,000
|
$280.28
0.12%
|
5/11/2016
|
$248.33
|
PP = $245.00
|
|
MB = $257.25
|
Most Recent Note - 8/1/2016 6:04:02 PM
G - Volume was below average while recently wedging into new all-time high territory. Its 50 DMA line ($264.91) defines important near-term support to watch on pullbacks.
>>> FEATURED STOCK ARTICLE : Gains Lack Great Volume While Wedging to New Highs - 7/27/2016 |
View all notes |
Set NEW NOTE alert |
Company Profile |
SEC
News |
Chart |
Request a new note
C
A
S
I |
IESC
-
NASDAQ
I E S Holdings Inc
Bldg-Maintenance and Svc
|
$14.21
|
+0.64
4.72% |
$14.26
|
54,230
59.59% of 50 DAV
50 DAV is 91,000
|
$16.77
-15.27%
|
7/26/2016
|
$15.79
|
PP = $15.74
|
|
MB = $16.53
|
 Most Recent Note - 8/5/2016 5:23:22 PM
Y - Rebounded above its 50 DMA line ($13.95) with today's gain on light volume and its color code is changed to yellow. Raised concerns when it slumped into the prior base. Due to report earnings soon for the Jun '16 quarter, and volume and volatility often increase near earnings news.
>>> FEATURED STOCK ARTICLE : Volume-Driven Gain for New Highs Clinched Technical Buy Signal - 7/26/2016 |
View all notes |
Set NEW NOTE alert |
Company Profile |
SEC
News |
Chart |
Request a new note
C
A
S
I |
NTES
-
NASDAQ
Netease Inc Adr
INTERNET - Internet Information Providers
|
$201.59
|
+3.17
1.60% |
$202.00
|
591,514
46.25% of 50 DAV
50 DAV is 1,279,000
|
$210.27
-4.13%
|
6/29/2016
|
$182.42
|
PP = $186.55
|
|
MB = $195.88
|
Most Recent Note - 8/2/2016 5:47:50 PM
G - Still consolidating above its "max buy" level with volume totals below average behind 4 consecutive losses. Disciplined investors avoid chasing stocks more than +5% above the prior high or pivot point. Prior highs near $186 define initial support to watch on pullbacks.
>>> FEATURED STOCK ARTICLE : Perched +5% Above Prior Highs Following Volume-Driven Gains - 7/15/2016 |
View all notes |
Set NEW NOTE alert |
Company Profile |
SEC
News |
Chart |
Request a new note
C
A
S
I |
HTHT
-
NASDAQ
China Lodging Group Ads
LEISURE - Lodging
|
$37.48
|
+0.44
1.19% |
$37.78
|
97,401
47.05% of 50 DAV
50 DAV is 207,000
|
$41.76
-10.25%
|
7/13/2016
|
$38.87
|
PP = $39.29
|
|
MB = $41.25
|
Most Recent Note - 8/4/2016 5:01:08 PM
Y - Ended near the session low with a loss on average volume, raising concerns while slumping further into its prior base. Its 50 DMA line ($36.29) defines near-term support to watch. Stalled after the 7/15/16 gain backed by +57% above average volume clinched a technical buy signal.
>>> FEATURED STOCK ARTICLE : Negative Reversal After Touching New High - 7/13/2016 |
View all notes |
Set NEW NOTE alert |
Company Profile |
SEC
News |
Chart |
Request a new note
C
A
S
I |
MXL
-
NYSE
Maxlinear Inc Cl A
Telecom-Infrastructure
|
$21.55
|
-0.01
-0.05% |
$21.87
|
1,065,396
110.18% of 50 DAV
50 DAV is 967,000
|
$22.50
-4.22%
|
5/16/2016
|
$19.24
|
PP = $19.20
|
|
MB = $20.16
|
Most Recent Note - 8/2/2016 5:46:28 PM
G - Still consolidating above its "max buy" level. Recent lows and the 200 DMA line in the $16.85 area define important support to watch on pullbacks.
>>> FEATURED STOCK ARTICLE : Consolidating Near Highs Above its "Max Buy" Level - 7/29/2016 |
View all notes |
Set NEW NOTE alert |
Company Profile |
SEC
News |
Chart |
Request a new note
C
A
S
I |
Symbol/Exchange
Company Name
Industry Group |
PRICE |
CHANGE
(%Change) |
Day High |
Volume
(% DAV)
(% 50 day avg vol) |
52 Wk Hi
% From Hi |
Featured
Date |
Price
Featured |
Pivot Featured |
|
Max Buy |
PATK
-
NASDAQ
Patrick Industries Inc
WHOLESALE - Building Materials Wholesale
|
$63.63
|
+0.18
0.28% |
$64.18
|
98,090
64.96% of 50 DAV
50 DAV is 151,000
|
$69.53
-8.49%
|
5/24/2016
|
$53.45
|
PP = $50.68
|
|
MB = $53.21
|
Most Recent Note - 8/2/2016 5:43:34 PM
G - Churning above average volume while hovering near all-time highs, extended from any sound base. Disciplined investors avoid chasing stocks more than +5% above prior highs. Reported earnings +41% on +35% sales revenues for the Jun '16 quarter. Its 50 DMA line ($58.75) defines near-term support to watch on pullbacks.
>>> FEATURED STOCK ARTICLE : Rallied +30% in 2 Months Since Breakout Was Featured - 7/28/2016 |
View all notes |
Set NEW NOTE alert |
Company Profile |
SEC
News |
Chart |
Request a new note
C
A
S
I |
FBHS
-
NYSE
Fortune Brands Hme & Sec
Bldg-Constr Prds/Misc
|
$63.75
|
+0.29
0.46% |
$64.02
|
1,469,562
78.00% of 50 DAV
50 DAV is 1,884,000
|
$64.47
-1.12%
|
6/22/2016
|
$57.71
|
PP = $60.08
|
|
MB = $63.08
|
Most Recent Note - 8/1/2016 5:58:46 PM
G - Consolidating above its "max buy" level and its color code is changed to green. Rallied for new highs with +66% above average volume following strong earnings news. See the latest FSU analysis for more details and a new annotated graph.
>>> FEATURED STOCK ARTICLE : Perched Above "Max Buy" Level Following Volume-Driven Gain - 8/1/2016 |
View all notes |
Set NEW NOTE alert |
Company Profile |
SEC
News |
Chart |
Request a new note
C
A
S
I |
NVEE
-
NASDAQ
N V 5 Global Inc
Comml Svcs-Consulting
|
$33.21
|
+0.02
0.06% |
$37.00
|
350,343
372.71% of 50 DAV
50 DAV is 94,000
|
$33.79
-1.72%
|
4/19/2016
|
$28.20
|
PP = $28.10
|
|
MB = $29.51
|
Most Recent Note - 8/5/2016 12:42:56 PM
G - Gapped up and hit another new 52-week high today but erased most of the early gains. Reported earnings +23% on +62% sales revenues, below the +25% minimum earnings guideline (C criteria), raising concerns. Its 50 DMA line ($29.30) and prior highs define important near-term support to watch on pullbacks.
>>> FEATURED STOCK ARTICLE : Winning Streak Leaves Leader Extended From Prior Base Pattern - 7/18/2016 |
View all notes |
Set NEW NOTE alert |
Company Profile |
SEC
News |
Chart |
Request a new note
C
A
S
I |
SFBS
-
NASDAQ
"ServisFirst Bancshares, Inc"
BANKING - Regional - Southeast Banks
|
$51.53
|
+1.93
3.89% |
$51.57
|
71,593
67.35% of 50 DAV
50 DAV is 106,300
|
$53.58
-3.83%
|
7/19/2016
|
$53.28
|
PP = $52.82
|
|
MB = $55.46
|
Most Recent Note - 8/5/2016 5:24:47 PM
Y - Rebounded above its 50 DMA line ($50.24) and finished near the session high. A volume-driven gain and strong close above the pivot point are needed to clinch a convincing technical buy signal. It has been quietly consolidating since highlighted in yellow in the 7/19/16 mid-day report with pivot point cited based on the 6/01/16 high plus 10 cents.
>>> FEATURED STOCK ARTICLE : Meeting Resistance Near Prior Highs - 7/20/2016 |
View all notes |
Set NEW NOTE alert |
Company Profile |
SEC
News |
Chart |
Request a new note
C
A
S
I |
INGN
-
NASDAQ
Inogen Inc
HEALTH SERVICES - Medical Instruments and Supplies
|
$53.84
|
+0.06
0.11% |
$54.50
|
360,291
159.42% of 50 DAV
50 DAV is 226,000
|
$55.98
-3.82%
|
8/5/2016
|
$51.72
|
PP = $56.08
|
|
MB = $58.88
|
Most Recent Note - 8/5/2016 4:53:36 PM
Y - Finished near the session high with a volume-driven gain after highlighted in yellow in the earlier mid-day report with new pivot point cited based on its 9/14/15 high plus 10 cents. A volume-driven gain above the pivot point is still needed to trigger a technical buy signal. The Dec '15, Mar and Jun '16 quarters showed earnings increases above the +25% minimum guideline (C criteria). See the latest FSU analysis for more details and a new annotated graph.
>>> FEATURED STOCK ARTICLE : Perched Within Striking Distance of Highs Following Rebound - 8/5/2016 |
View all notes |
Set NEW NOTE alert |
Company Profile |
SEC
News |
Chart |
Request a new note
C
A
S
I |
Symbol/Exchange
Company Name
Industry Group |
PRICE |
CHANGE
(%Change) |
Day High |
Volume
(% DAV)
(% 50 day avg vol) |
52 Wk Hi
% From Hi |
Featured
Date |
Price
Featured |
Pivot Featured |
|
Max Buy |
OLLI
-
NASDAQ
Ollie's Bargain Outlet
Retail-DiscountandVariety
|
$26.89
|
+0.36
1.36% |
$27.00
|
301,463
29.88% of 50 DAV
50 DAV is 1,009,000
|
$28.72
-6.37%
|
7/19/2016
|
$26.42
|
PP = $28.82
|
|
MB = $30.26
|
Most Recent Note - 8/3/2016 5:26:02 PM
Y - Managed a positive reversal today after finding prompt support at its 50 DMA line. Volume-driven gains above the pivot point are needed to trigger a convincing technical buy signal. Completed another Secondary Offering on 6/06/16. Such offerings often hinder upward price progress for the short term, yet they also help to attract more institutional sponsorship.
>>> FEATURED STOCK ARTICLE : Retail Firm Approaching Pivot Point - 7/19/2016 |
View all notes |
Set NEW NOTE alert |
Company Profile |
SEC
News |
Chart |
Request a new note
C
A
S
I |
|
|
|
THESE ARE NOT BUY RECOMMENDATIONS!
Comments contained in the body of this report are technical
opinions only. The material herein has been obtained
from sources believed to be reliable and accurate, however,
its accuracy and completeness cannot be guaranteed.
This site is not an investment advisor, hence it does
not endorse or recommend any securities or other investments.
Any recommendation contained in this report may not
be suitable for all investors and it is not to be deemed
an offer or solicitation on our part with respect to
the purchase or sale of any securities. All trademarks,
service marks and trade names appearing in this report
are the property of their respective owners, and are
likewise used for identification purposes only.
This report is a service available
only to active Paid Premium Members.
You may opt-out of receiving report notifications
at any time. Questions or comments may be submitted
by writing to Premium Membership Services 665 S.E. 10 Street, Suite 201 Deerfield Beach, FL 33441-5634 or by calling 1-800-965-8307
or 954-785-1121.
|
|
|