You are not logged in.
This means you
CAN ONLY VIEW reports that were published prior to Thursday, March 20, 2025.
You
MUST UPGRADE YOUR MEMBERSHIP if you want to see any current reports.
AFTER MARKET UPDATE - FRIDAY, AUGUST 11TH, 2023
Previous After Market Report Next After Market Report >>>
|
|
|
|
DOW |
+105.25 |
35,281.40 |
+0.30% |
|
Volume |
751,666,901 |
-12% |
|
Volume |
4,655,383,100 |
-13% |
|
NASDAQ |
-93.14 |
13,644.85 |
-0.68% |
|
Advancers |
1,452 |
52% |
|
Advancers |
1,903 |
44% |
|
S&P 500 |
-4.78 |
4,464.05 |
-0.11% |
|
Decliners |
1,360 |
48% |
|
Decliners |
2,433 |
56% |
|
Russell 2000 |
+2.49 |
1,925.11 |
+0.13% |
|
52 Wk Highs |
40 |
|
|
52 Wk Highs |
59 |
|
|
S&P 600 |
-1.17 |
1,243.65 |
-0.09% |
|
52 Wk Lows |
34 |
|
|
52 Wk Lows |
177 |
|
|
 |
Major Indices Were Mixed With Lighter Volume Totals
Kenneth J. Gruneisen - Passed the CAN SLIM® Master's Exam
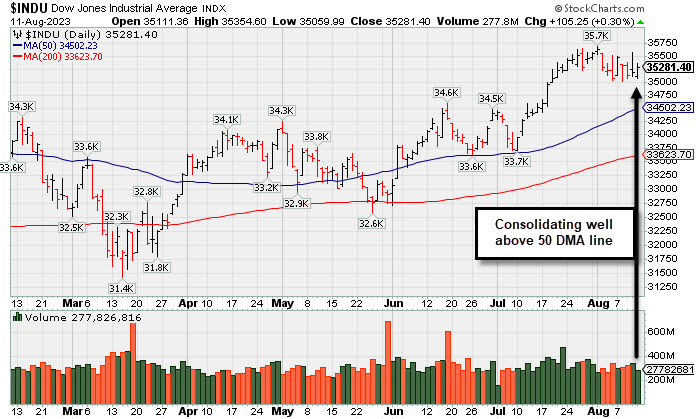
The S&P 500 declined 0.1%; the Nasdaq Composite fell 0.7%; and the Dow Jones Industrial Average rose 0.3%. Volume totals reported were lighter than the prior session on the NYSE and on the Nasdaq exchange. Advancers led decliners by a narrow margin on the NYSE but decliners led advancers by about a 5-4 margin on the Nasdaq exchange. There were 33 high-ranked companies from the Leaders List that hit a new 52-week high and were listed on the BreakOuts Page, versus the total of 33 on the prior session. New 52-week highs outnumbered new 52-week lows on the NYSE, but for an 8th consecutive session new lows convincingly outnumbered new highs on the Nasdaq exchange. The major indices are in an uptrend that is under pressure (M criteria), Healthy leadership is crucial to any sustained rally. Appropriate new buying efforts may still be considered under the fact-based investment system. Greater caution may be necessary in the event of a more serious correction.
PICTURED: The Dow Jones Industrial Average posted a small gain with light volume, yet it remains consolidating well above its 50-day moving average (DMA) line.
Total PPI increased 0.3% month-over-month in July following a downwardly revised 0.0% (from 0.1%) for June. Excluding food and energy, the index for final demand was also up 0.3% month-over-month following a downwardly revised 0.1% decline (from +0.1%) for June. On a year-over-year basis, the index for final demand was up 0.8%, versus 0.3% in June, and the index for final demand, excluding food and energy, was up 2.4%, unchanged from June.
The 2-yr note yield, at 4.80% just before the release, rose six basis points to 4.89%. The 10-yr note yield, at 4.08% just before the release, rose nine basis points to 4.17%.
Apple (APPL -0.10%) finished flat, but weakness from Tesla (TSLA -1.10%), Meta Platforms (META -1.34%), and NVIDIA (NVDA -3.62%) weighed on the broader market.
Only four of the 11 S&P 500 sectors closed with a loss. Information technology (-0.9%) was the worst performer while energy (+1.6%) was a leading gainer. |
 Kenneth J. Gruneisen started out as a licensed stockbroker in August 1987, a couple of months prior to the historic stock market crash that took the Dow Jones Industrial Average down -22.6% in a single day. He has published daily fact-based fundamental and technical analysis on high-ranked stocks online for two decades. Through FACTBASEDINVESTING.COM, Kenneth provides educational articles, news, market commentary, and other information regarding proven investment systems that work in good times and bad.
Comments contained in the body of this report are technical opinions only and are not necessarily those of Gruneisen Growth Corp. The material herein has been obtained from sources believed to be reliable and accurate, however, its accuracy and completeness cannot be guaranteed. Our firm, employees, and customers may effect transactions, including transactions contrary to any recommendation herein, or have positions in the securities mentioned herein or options with respect thereto. Any recommendation contained in this report may not be suitable for all investors and it is not to be deemed an offer or solicitation on our part with respect to the purchase or sale of any securities. |
|
 |
Commodity-Linked Groups Led Gainers; Semiconductor Index Fell
Kenneth J. Gruneisen - Passed the CAN SLIM® Master's Exam
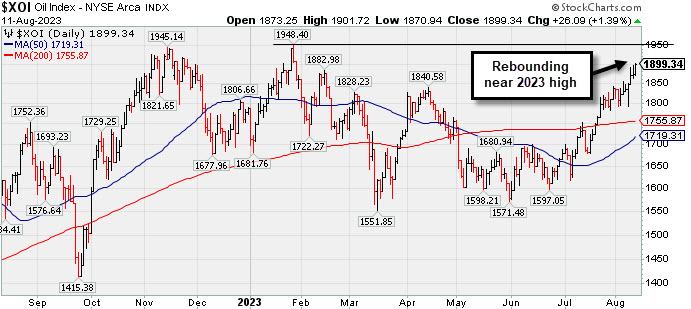
Commodity-linked groups had a positive bias on Friday as the Gold & Silver Index ($XAU +1.01%), Integrated Oil Index ($XOI +1.39%), and the Oil Services Index ($OSX +0.91%) each posted a solid gain. The Retail Index ($RLX +0.10%) and Bank Index ($BKX +0.39%) both posted small gains while the Broker/Dealer Index ($XBD +0.00%) finished flat. The tech sector was led lower by the Semiconductor Index ($SOX -2.29%) while the Biotech Index ($BTK +0.21%) eked out a small gain and the Networking Index ($NWX +0.05%) finished flat.
PICTURED: The Integrated Oil Index ($XOI +1.39%) has been rebounding near its 2023 high.
| Oil Services |
$OSX |
94.51 |
+0.86 |
+0.91% |
+12.70% |
| Integrated Oil |
$XOI |
1,899.34 |
+26.09 |
+1.39% |
+6.27% |
| Semiconductor |
$SOX |
3,514.55 |
-82.47 |
-2.29% |
+38.80% |
| Networking |
$NWX |
797.05 |
+0.43 |
+0.05% |
+1.75% |
| Broker/Dealer |
$XBD |
497.61 |
-0.00 |
-0.00% |
+10.79% |
| Retail |
$RLX |
3,624.34 |
+3.78 |
+0.10% |
+31.60% |
| Gold & Silver |
$XAU |
119.28 |
+1.20 |
+1.01% |
-1.31% |
| Bank |
$BKX |
86.67 |
+0.34 |
+0.39% |
-14.06% |
| Biotech |
$BTK |
5,232.98 |
+10.72 |
+0.21% |
-0.91% |
|
|
|
 |
Quiet Pullback Undercut 50-Day Moving Average Line
Kenneth J. Gruneisen - Passed the CAN SLIM® Master's Exam
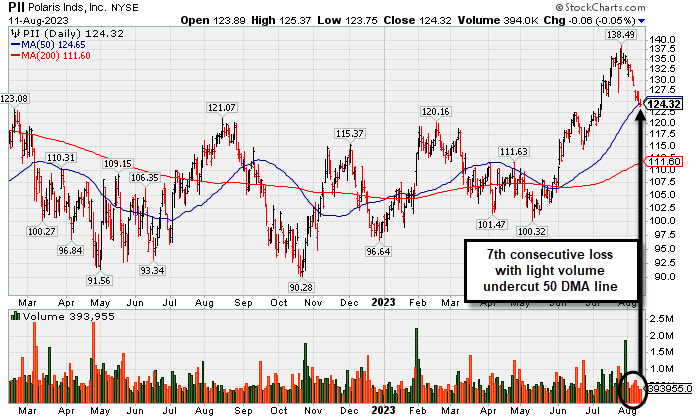
Polaris (PII -$0.06 or -0.05% to $124.32) pulled back today for a 7th consecutive loss with below-average volume and closed just below its 50-day moving average (DMA) line ($124.65). More damaging losses would raise greater concerns. Recently it reported Jun '23 quarterly earnings +0% versus the year-ago period, below the +25% minimum earnings guideline (C criteria), raising fundamental concerns. Its Earnings Per Share Rating is currently 88, still above the 80+ minimum guidelint for buy candidates.
PII was highlighted in yellow with pivot point cited based on its 8/16/22 high plus 10 cents in the 7/11/23 mid-day report (read here). It was shown in greater detail that evening with an annotated graph under the headline, "Volume-Driven Breakout for Polaris".
It hails from the Leisure-Products group which is ranked 136th on the 197 Industry Groups list. Its Sep, Dec '22, and Mar '23 quarterly sales revenues were strong and earnings increases were above the +25% minimum (C criteria) versus the year ago periods. Annual earnings (A criteria) history had a slight downturn in FY '19 followed by strong growth.
The number of top-rated funds owning its shares reportedly fell from 613 in Sep '22 to 593 in Mar '23, not a reassuring sign concerning the I criteria. Its current Up/Down Volume Ratio of 1.1 is only a slightly bullish sign of accumulation over the past 50 days. It has an Accumulation/Distribution Rating of B+ and B ratings for both Timeliness and Sponsorship. |
|
|
Color Codes Explained :
Y - Better candidates highlighted by our
staff of experts.
G - Previously featured
in past reports as yellow but may no longer be buyable under the
guidelines.
***Last / Change / Volume data in this table is the closing quote data***
Symbol/Exchange
Company Name
Industry Group |
PRICE |
CHANGE
(%Change) |
Day High |
Volume
(% DAV)
(% 50 day avg vol) |
52 Wk Hi
% From Hi |
Featured
Date |
Price
Featured |
Pivot Featured |
|
Max Buy |
 STRL
-
NASDAQ
STRL
-
NASDAQ
Sterling Infrastructure
Bldg-Heavy Construction
|
$80.79
|
+0.90
1.13% |
$82.32
|
490,716
124.23% of 50 DAV
50 DAV is 395,000
|
$81.00
-0.26%
|
12/14/2022
|
$32.41
|
PP = $33.72
|
|
MB = $35.41
|
Most Recent Note - 8/9/2023 5:15:08 PM
G - A 3rd consecutive volume-driven gain for another new all-time high leaves it very extended from any sound base. Bullish action came after it reported Jun '23 quarterly earnings +37% on +13% sales revenues versus the year-ago period, a solid increase after the Mar '23 earnings were below the +25% minimum guideline (C criteria). See the latest FSU analysis for more details and a new annotated graph.
>>> FEATURED STOCK ARTICLE : Volume-Driven Gains Leave Construction Firm at All-Time High - 8/9/2023 |
View all notes |
Set NEW NOTE alert |
Company Profile |
SEC
News |
Chart |
Request a new note
C
A
S
I |
FIX
-
NYSE
Comfort Systems USA
Bldg-A/C and Heating Prds
|
$178.03
|
+1.23
0.70% |
$179.33
|
108,798
48.79% of 50 DAV
50 DAV is 223,000
|
$182.94
-2.68%
|
4/27/2023
|
$148.85
|
PP = $152.23
|
|
MB = $159.84
|
Most Recent Note - 8/7/2023 6:30:36 PM
G - Hit another new all-time high with light volume behind today's 4th consecutive gain. Its 50 DMA line ($163) defines important near-term support to watch on pullbacks. Reported Jun '23 quarterly earnings +65% on +27% versus the year-ago period.
>>> FEATURED STOCK ARTICLE : Pulled Back From High With Lighter Volume - 7/19/2023 |
View all notes |
Set NEW NOTE alert |
Company Profile |
SEC
News |
Chart |
Request a new note
C
A
S
I |
KOF
-
NYSE
Coca Cola Femsa Sab Ads
FOOD and BEVERAGE - Beverages - Soft Drinks
|
$82.64
|
-0.05
-0.06% |
$83.23
|
97,672
63.92% of 50 DAV
50 DAV is 152,800
|
$91.23
-9.42%
|
6/9/2023
|
$88.61
|
PP = $91.33
|
|
MB = $95.90
|
Most Recent Note - 8/10/2023 6:15:22 PM
G - Posted a gain today with average volume. A rebound above the 50 DMA line ($84.33) is needed for its outlook to improve but that short-term average recently has acted as resistance. Its Relative Strength Rating has slumped to 79. Reported Jun '23 quarterly earnings +23% on +26% sales revenues versus the year-ago period, below the +25% minimum guideline (C criteria). See the latest FSU analysis for more details and a new annotated graph.
>>> FEATURED STOCK ARTICLE : 50-Day Moving Average Line has Acted as Resistance - 8/10/2023 |
View all notes |
Set NEW NOTE alert |
Company Profile |
SEC
News |
Chart |
Request a new note
C
A
S
I |
CLH
-
NYSE
Clean Harbors
Pollution Control
|
$174.73
|
+2.02
1.17% |
$176.63
|
353,975
88.94% of 50 DAV
50 DAV is 398,000
|
$175.49
-0.43%
|
3/10/2023
|
$136.89
|
PP = $136.74
|
|
MB = $143.58
|
Most Recent Note - 8/9/2023 5:26:58 PM
G - Hit yet another new all-time high with today's 3rd consecutive gain. Its 50 DMA line ($161.60) defines important near-term support to watch on pullbacks. Reported earnings for the Jun '23 quarter -13% on +3% sales revenues versus the year-ago period, below the +25% minimum earnings guideline (C criteria), raising fundamental concerns.
>>> FEATURED STOCK ARTICLE : Negative Reversal at High After +26% Rally in 4 Months - 7/18/2023 |
View all notes |
Set NEW NOTE alert |
Company Profile |
SEC
News |
Chart |
Request a new note
C
A
S
I |
HUBB
-
NYSE
Hubbell
Electrical-Power/Equipmt
|
$306.96
|
+4.59
1.52% |
$309.79
|
504,056
117.22% of 50 DAV
50 DAV is 430,000
|
$340.06
-9.73%
|
4/25/2023
|
$262.85
|
PP = $257.51
|
|
MB = $270.39
|
Most Recent Note - 8/9/2023 5:28:25 PM
G - Still lingering below its 50 DMA line ($317). A rebound above the 50 DMA line is needed for its outlook to improve. Fundamentals remain strong after Jun '23 earnings rose +45% on +9% sales revenues versus the year-ago period.
>>> FEATURED STOCK ARTICLE : Pulled Back Undercutting 50 Day Moving Average Line - 7/26/2023 |
View all notes |
Set NEW NOTE alert |
Company Profile |
SEC
News |
Chart |
Request a new note
C
A
S
I |
Symbol/Exchange
Company Name
Industry Group |
PRICE |
CHANGE
(%Change) |
Day High |
Volume
(% DAV)
(% 50 day avg vol) |
52 Wk Hi
% From Hi |
Featured
Date |
Price
Featured |
Pivot Featured |
|
Max Buy |
NVR
-
NYSE
N V R Inc
MATERIALS and CONSTRUCTION - Residential Construction
|
$6,156.73
|
+37.40
0.61% |
$6,201.86
|
9,586
43.77% of 50 DAV
50 DAV is 21,900
|
$6,474.53
-4.91%
|
4/25/2023
|
$5,882.18
|
PP = $5,978.25
|
|
MB = $6,277.16
|
Most Recent Note - 8/10/2023 6:25:14 PM
G - Reported Jun '23 quarterly earnings -6% on -13% sales revenues, its 2nd subpar quarter, raising greater fundamental concerns. Undercut its 50 DMA line ($6,143) triggering a technical sell signal with today's 3rd consecutive loss backed by light volume.
>>> FEATURED STOCK ARTICLE : Consolidating Above 50 DMA After 2nd Subpar Earnings Report - 8/7/2023 |
View all notes |
Set NEW NOTE alert |
Company Profile |
SEC
News |
Chart |
Request a new note
C
A
S
I |
PHM
-
NYSE
PulteGroup
Bldg-Resident/Comml
|
$82.77
|
-0.19
-0.23% |
$83.65
|
1,716,415
63.74% of 50 DAV
50 DAV is 2,693,000
|
$86.16
-3.93%
|
4/25/2023
|
$65.17
|
PP = $64.01
|
|
MB = $67.21
|
Most Recent Note - 8/10/2023 6:26:44 PM
G - Pulled back from its high with today's 2nd loss with below-average volume. It is very extended from any sound base. Recently reported earnings +18% for the Jun '23 quarter versus the year-ago period, below the +25% minimum guideline (C criteria) raising concerns. Its 50 DMA line ($77.88) defines important support to watch.
>>> FEATURED STOCK ARTICLE : Reversed After Reaching a New All-Time High - 7/27/2023 |
View all notes |
Set NEW NOTE alert |
Company Profile |
SEC
News |
Chart |
Request a new note
C
A
S
I |
AMPH
-
NASDAQ
Amphastar Pharm
Medical-Biomed/Biotech
|
$54.69
|
+1.29
2.42% |
$55.41
|
492,326
106.10% of 50 DAV
50 DAV is 464,000
|
$67.66
-19.17%
|
5/15/2023
|
$43.56
|
PP = $44.15
|
|
MB = $46.36
|
Most Recent Note - 8/10/2023 6:18:51 PM
G - Suffered a damaging volume-driven loss today violating its 50 DMA line ($55.85) triggering a technical sell signal following a noted "negative reversal" on the prior session after hitting a new all-time high. Fundamentals remain strong after it reported Jun '23 quarterly earnings +67% on +18% sales revenues versus the year-ago period.
>>> FEATURED STOCK ARTICLE : 6th Straight Gain for Amphastar - 7/20/2023 |
View all notes |
Set NEW NOTE alert |
Company Profile |
SEC
News |
Chart |
Request a new note
C
A
S
I |
ANET
-
NYSE
Arista Networks
Computer-Networking
|
$174.94
|
-1.36
-0.77% |
$177.40
|
1,229,290
36.50% of 50 DAV
50 DAV is 3,368,000
|
$190.65
-8.24%
|
8/1/2023
|
$188.84
|
PP = $178.46
|
|
MB = $187.38
|
Most Recent Note - 8/9/2023 5:25:23 PM
Y - Volume totals have been cooling while hovering near the prior high and pivot point. Bullish action came after it reported Jun '23 quarterly earnings +40% on +39% sales revenues versus the year-ago period.
>>> FEATURED STOCK ARTICLE : Wedging Higher After Rebounding Above 50-Day Moving Average - 7/12/2023 |
View all notes |
Set NEW NOTE alert |
Company Profile |
SEC
News |
Chart |
Request a new note
C
A
S
I |
LSCC
-
NASDAQ
Lattice Semiconductor
Elec-Semicondctor Fablss
|
$85.40
|
-2.25
-2.57% |
$87.35
|
1,336,791
66.08% of 50 DAV
50 DAV is 2,023,000
|
$98.18
-13.02%
|
6/13/2023
|
$91.73
|
PP = $96.92
|
|
MB = $101.77
|
Most Recent Note - 8/10/2023 6:23:04 PM
G - Color code is changed to green after violating its 50 DMA line ($89.31) with today's damaging loss raising concerns and triggering a technical sell signal. Reported Jun '23 quarterly earnings +24% on +18% sales revenues versus the year-ago period, just below the +25% minimum earnings guideline (C criteria).
>>> FEATURED STOCK ARTICLE : Perched Near Pivot Point After Best-Ever Close - 7/17/2023 |
View all notes |
Set NEW NOTE alert |
Company Profile |
SEC
News |
Chart |
Request a new note
C
A
S
I |
Symbol/Exchange
Company Name
Industry Group |
PRICE |
CHANGE
(%Change) |
Day High |
Volume
(% DAV)
(% 50 day avg vol) |
52 Wk Hi
% From Hi |
Featured
Date |
Price
Featured |
Pivot Featured |
|
Max Buy |
XPEL
-
NASDAQ
Xpel Inc
Auto/Truck-Tires andamp; Misc
|
$83.25
|
+3.14
3.92% |
$84.25
|
154,578
115.53% of 50 DAV
50 DAV is 133,800
|
$87.46
-4.81%
|
6/28/2023
|
$83.14
|
PP = $87.11
|
|
MB = $91.47
|
 Most Recent Note - 8/11/2023 5:17:11 PM
G - Posted another solid gain today, promptly rebounding well above its 50 DMA line ($80.27), showing resilience after triggering a technical sell signal on 8/09/23. Faces little resistance due to overhead supply up to the $87 level. Reported Jun '23 quarterly earnings +33% on +22% sales revenues versus the year-ago period. Volume and volatility often increase near earnings news.
>>> FEATURED STOCK ARTICLE : Consolidating After Rebounding Above 50-Day Moving Average - 8/2/2023 |
View all notes |
Set NEW NOTE alert |
Company Profile |
SEC
News |
Chart |
Request a new note
C
A
S
I |
PII
-
NYSE
Polaris
Leisure-Products
|
$124.32
|
-0.06
-0.05% |
$125.37
|
393,955
63.44% of 50 DAV
50 DAV is 621,000
|
$138.49
-10.23%
|
7/11/2023
|
$126.92
|
PP = $123.97
|
|
MB = $130.17
|
Most Recent Note - 8/11/2023 5:11:06 PM
G - Pulled back today for a 7th consecutive loss with below-average volume and undercut its 50 DMA line ($124.65) raising concerns. Recently reported Jun '23 quarterly earnings +0% versus the year-ago period, below the +25% minimum earnings guideline (C criteria). See the latest FSU analysis for more details and a new annotated graph.
>>> FEATURED STOCK ARTICLE : Quiet Pullback Undercut 50-Day Moving Average Line - 8/11/2023 |
View all notes |
Set NEW NOTE alert |
Company Profile |
SEC
News |
Chart |
Request a new note
C
A
S
I |
ESQ
-
NASDAQ
Esquire Finl Hldgs
Finance-Commercial Loans
|
$50.29
|
-0.46
-0.91% |
$51.01
|
7,265
25.05% of 50 DAV
50 DAV is 29,000
|
$54.03
-6.92%
|
7/14/2023
|
$45.80
|
PP = $48.23
|
|
MB = $50.64
|
Most Recent Note - 8/7/2023 6:28:29 PM
G - Color code is changed to green after rising above its "max buy" level with 4 consecutive gains. Prior highs in the $47 define initial support above its 50 DMA line.
>>> FEATURED STOCK ARTICLE : Esquire Perched Near Prior Highs - 7/14/2023 |
View all notes |
Set NEW NOTE alert |
Company Profile |
SEC
News |
Chart |
Request a new note
C
A
S
I |
MEDP
-
NASDAQ
Medpace Holdings
Medical-Research Eqp/Svc
|
$266.89
|
-0.76
-0.28% |
$268.39
|
243,597
63.27% of 50 DAV
50 DAV is 385,000
|
$269.44
-0.95%
|
7/25/2023
|
$196.32
|
PP = $241.57
|
|
MB = $253.65
|
Most Recent Note - 8/7/2023 6:36:54 PM
Y - Posted a small gain with below-average volume today for a 3rd consecutive session, wedging to a new all-time high. Prior highs in the $241 area define support to watch on pullbacks. Reported earnings increases above the +25% minimum earnings guideline (C criteria) in the past 5 quarterly comparisons through Jun '23.
>>> FEATURED STOCK ARTICLE : Medpace Posted a Solid Volume-Driven Gain for a New High - 7/25/2023 |
View all notes |
Set NEW NOTE alert |
Company Profile |
SEC
News |
Chart |
Request a new note
C
A
S
I |
COKE
-
NASDAQ
Coca-Cola Consolidated
Beverages-Non-Alcoholic
|
$741.60
|
+27.70
3.88% |
$745.53
|
36,722
85.40% of 50 DAV
50 DAV is 43,000
|
$731.90
1.33%
|
8/3/2023
|
$718.56
|
PP = $694.30
|
|
MB = $729.02
|
Most Recent Note - 8/11/2023 5:15:14 PM
G - Volume was below average behind today's gain for another new all-time high, rising above its "max buy" level and its color code is changed to green. Prior highs in the $693 area define initial support to watch on pullbacks. Fundamentals remain strong
>>> FEATURED STOCK ARTICLE : Powerful Breakout for COKE - 8/3/2023 |
View all notes |
Set NEW NOTE alert |
Company Profile |
SEC
News |
Chart |
Request a new note
C
A
S
I |
Symbol/Exchange
Company Name
Industry Group |
PRICE |
CHANGE
(%Change) |
Day High |
Volume
(% DAV)
(% 50 day avg vol) |
52 Wk Hi
% From Hi |
Featured
Date |
Price
Featured |
Pivot Featured |
|
Max Buy |
ACLS
-
NASDAQ
Axcelis Technologies
Elec-Semiconductor Equip
|
$167.11
|
-6.97
-4.00% |
$173.02
|
692,245
125.63% of 50 DAV
50 DAV is 551,000
|
$201.00
-16.86%
|
8/4/2023
|
$181.59
|
PP = $201.10
|
|
MB = $211.16
|
Most Recent Note - 8/11/2023 5:12:58 PM
G - Slumped further below its 50 DMA line ($176.66) and below recent lows with yet another loss today backed by above-average volume. A prompt rebound above the 50 DMA line is needed for its outlook to improve. Fundamentals remain strong.
>>> FEATURED STOCK ARTICLE : Formed Ascending Base and Now Testing 50-Day Moving Average - 8/4/2023 |
View all notes |
Set NEW NOTE alert |
Company Profile |
SEC
News |
Chart |
Request a new note
C
A
S
I |
PLUS
-
NASDAQ
ePlus
Computer-Tech Services
|
$66.21
|
-0.13
-0.20% |
$66.88
|
118,806
92.82% of 50 DAV
50 DAV is 128,000
|
$75.90
-12.77%
|
8/8/2023
|
$67.60
|
PP = $62.92
|
|
MB = $66.07
|
Most Recent Note - 8/8/2023 6:21:15 PM
Y - Finished in the lower half of its intra-day range today after highlighted in yellow with pivot point cited based on its may '22 high plus 10 cents. A "breakaway gap" helped it hit a new all-time high with +202% above average volume triggering a technical buy signal. Reported earnings +42% on +25% sales revenues for the Jun '23 quarter versus the year ago period, its 3rd consecutive quarterly earnings increase above the +25% minimum guideline (C criteria) helping iot better match the winning models of the fact-based investment system. Annual earnings growth (A criteria) has been strong. See the latest FSU analysis for more details and a new annotated graph.
>>> FEATURED STOCK ARTICLE : ePLUS Gapped Up but Ended in Lower Half of Intra-Day Range - 8/8/2023 |
View all notes |
Set NEW NOTE alert |
Company Profile |
SEC
News |
Chart |
Request a new note
C
A
S
I |
|
|
|
THESE ARE NOT BUY RECOMMENDATIONS!
Comments contained in the body of this report are technical
opinions only. The material herein has been obtained
from sources believed to be reliable and accurate, however,
its accuracy and completeness cannot be guaranteed.
This site is not an investment advisor, hence it does
not endorse or recommend any securities or other investments.
Any recommendation contained in this report may not
be suitable for all investors and it is not to be deemed
an offer or solicitation on our part with respect to
the purchase or sale of any securities. All trademarks,
service marks and trade names appearing in this report
are the property of their respective owners, and are
likewise used for identification purposes only.
This report is a service available
only to active Paid Premium Members.
You may opt-out of receiving report notifications
at any time. Questions or comments may be submitted
by writing to Premium Membership Services 665 S.E. 10 Street, Suite 201 Deerfield Beach, FL 33441-5634 or by calling 1-800-965-8307
or 954-785-1121.
|
|
|