You are not logged in.
This means you
CAN ONLY VIEW reports that were published prior to Monday, March 24, 2025.
You
MUST UPGRADE YOUR MEMBERSHIP if you want to see any current reports.
AFTER MARKET UPDATE - FRIDAY, MAY 31ST, 2019
Previous After Market Report Next After Market Report >>>
|
|
|
|
DOW |
-354.84 |
24,815.04 |
-1.41% |
|
Volume |
994,567,910 |
+42% |
|
Volume |
2,212,851,930 |
+19% |
|
NASDAQ |
-114.57 |
7,453.15 |
-1.51% |
|
Advancers |
892 |
31% |
|
Advancers |
780 |
25% |
|
S&P 500 |
-36.80 |
2,752.06 |
-1.32% |
|
Decliners |
1,954 |
69% |
|
Decliners |
2,339 |
75% |
|
Russell 2000 |
-20.04 |
1,465.49 |
-1.35% |
|
52 Wk Highs |
84 |
|
|
52 Wk Highs |
64 |
|
|
S&P 600 |
-12.60 |
888.72 |
-1.40% |
|
52 Wk Lows |
256 |
|
|
52 Wk Lows |
233 |
|
|
 |
Major Indices Fell While Institutional Selling Increased
Kenneth J. Gruneisen - Passed the CAN SLIM® Master's Exam
For the week, the S&P 500 lost 2.6%, capping a 6.6% monthly retreat. The Dow’s 3.0% weekly decline left the blue chip benchmark 6.7% lower in May, while the Nasdaq shed 2.4% for the week and 7.9% for the month. Stocks finished lower on Friday, capping May with the first monthly decline of the year, as trade news continues to weigh on sentiment. The Dow dropped 355 points, the S&P 500 lost 1.3% and the Nasdaq Composite slid 1.5%. The volume totals reported were higher on the NYSE and on the Nasdaq exchange, revealing greater conviction behind institutional selling. Decliners decisively outnumbered advancers by more than a 2-1 margin on the NYSE and 3-1 on the Nasdaq exchange. Leadership remained thin as only 9 high-ranked companies from the Leaders List hit new 52-week highs and were listed on the BreakOuts Page, versus the total of 7 on the prior session. New 52-week lows totals swelled and outnumbered new 52-week highs totals on the NYSE and on the Nasdaq exchange. The major indices (M criteria) are showing action indicative of a more worrisome "market correction". The fact-based investment system discourages any new buying efforts and suggests selling stocks on a case-by-case basis, raising cash levels to reduce market exposure. The Featured Stocks Page provides the most timely analysis on high-ranked leaders. Charts used courtesy of www.stockcharts.com
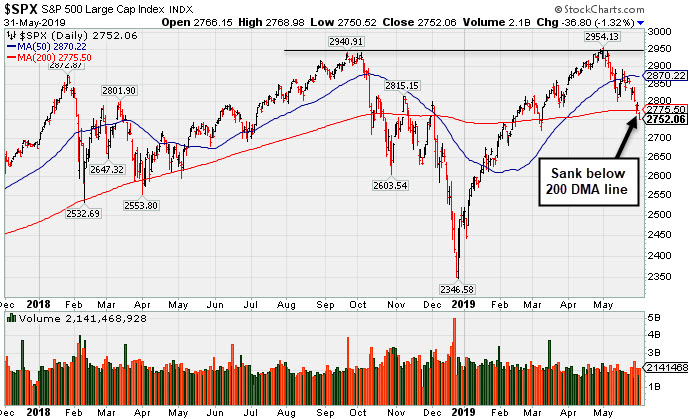
PICTURED: The S&P 500 Index slumped below its 200-day moving average (DMA) line. Losses on higher volume in recent weeks indicate distributional pressure.
The S&P 500 Index and Nasdaq Composite Index both slumped below their respective 200 DMA lines, joining the Dow Jones Industrial Average which had already fallen below that important long-term moving average recently. Disciplined investors have been watching for a follow-through day of big gains (more than +1%) from at least one of the major indices backed with higher volume and an expansion in stocks reaching new 52-week highs - all of which are critical components for a new confirmed uptrend under the fact-based system.
The major averages retreated after President Trump announced plans late Thursday evening to implement a new 5% tariff on Mexican goods. White House officials also suggested the tariffs could continue to rise to 25% if Mexican officials don’t stop the flow of illegal immigration along the Southern U.S. border. General Motors (GM -4.25%), which has a supply chain with heavy exposure to Mexico, fell amid a broad sell-off for automakers on the news. Energy stocks also lagged as WTI crude fell 5.9% to cap its worst monthly performance since November.
The rise in trade tensions continued to spur demand for perceived safe-haven assets. Utilities and Real Estate were the only S&P 500 sectors to finish higher, while Gold climbed 1.4% on the session. U.S. Treasuries also rallied, as economic data left investors questioning inflation prospects. A report showed the core PCE deflator, which is the Fed’s preferred inflation gauge, rose at a muted 1.6% annualized pace in April. The yield on the benchmark 10-year Treasury note dipped eight basis points Friday to finish at 2.13%, the lowest level since September 2017.
|
 Kenneth J. Gruneisen started out as a licensed stockbroker in August 1987, a couple of months prior to the historic stock market crash that took the Dow Jones Industrial Average down -22.6% in a single day. He has published daily fact-based fundamental and technical analysis on high-ranked stocks online for two decades. Through FACTBASEDINVESTING.COM, Kenneth provides educational articles, news, market commentary, and other information regarding proven investment systems that work in good times and bad.
Comments contained in the body of this report are technical opinions only and are not necessarily those of Gruneisen Growth Corp. The material herein has been obtained from sources believed to be reliable and accurate, however, its accuracy and completeness cannot be guaranteed. Our firm, employees, and customers may effect transactions, including transactions contrary to any recommendation herein, or have positions in the securities mentioned herein or options with respect thereto. Any recommendation contained in this report may not be suitable for all investors and it is not to be deemed an offer or solicitation on our part with respect to the purchase or sale of any securities. |
|
 |
Financial, Retail, Tech, and Energy-Linked Groups Fell
Kenneth J. Gruneisen - Passed the CAN SLIM® Master's Exam
The Retail Index ($RLX -1.41%) and Bank Index ($BKX -1.68%) both weighed on the major averages. The tech sector had a negative bias as the Semiconductor Index ($SOX -1.45%), Biotech Index ($BTK -1.35%), and the Networking Index ($NWX -1.78%) finished with unanimous losses. Commodity-linked groups were mixed as the Gold & Silver Index ($XAU +3.81%) rose while the Oil Services Index ($OSX -2.07%) and the Integrated Oil Index ($XOI -1.72%) both lost ground. Charts courtesy of www.stockcharts.com
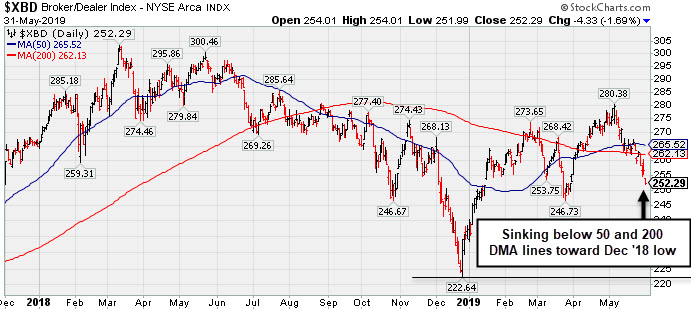 PICTURED: The Broker/Dealer Index ($XBD -1.69%) has been sinking below its 50 and 200 DMA lines toward its December 2018 low.
| Oil Services |
$OSX |
74.03 |
-1.57 |
-2.08% |
-8.15% |
| Integrated Oil |
$XOI |
1,170.76 |
-20.48 |
-1.72% |
+1.01% |
| Semiconductor |
$SOX |
1,296.18 |
-19.11 |
-1.45% |
+12.21% |
| Networking |
$NWX |
538.01 |
-9.75 |
-1.78% |
+10.10% |
| Broker/Dealer |
$XBD |
252.29 |
-4.33 |
-1.69% |
+6.30% |
| Retail |
$RLX |
2,200.89 |
-31.49 |
-1.41% |
+12.78% |
| Gold & Silver |
$XAU |
70.02 |
+2.57 |
+3.81% |
-0.91% |
| Bank |
$BKX |
91.83 |
-1.57 |
-1.68% |
+7.04% |
| Biotech |
$BTK |
4,362.26 |
-59.82 |
-1.35% |
+3.35% |
|
|
|
 |
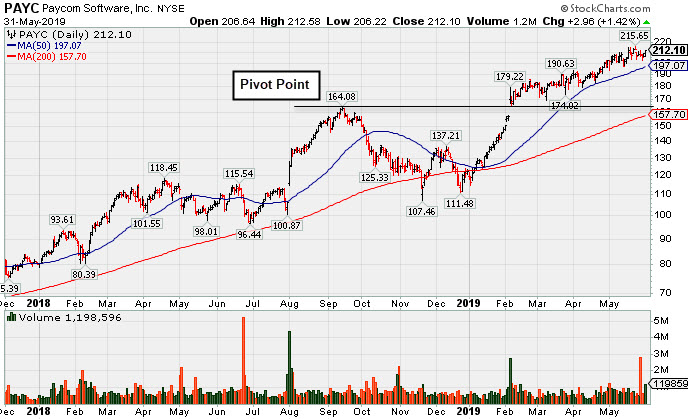
Posted Volume-Driven Gain While Hovering Near All-Time High
Kenneth J. Gruneisen - Passed the CAN SLIM® Master's Exam
Paycom Software Inc (PAYC +$2.96 or +1.42% to $212.10) posted a volume-driven gain on Friday. It has been holding its ground in a tight range near its all-time high. Its 50-day moving average (DMA) line ($197.05) defines important near-term support to watch.
It reported earnings +25% on +30% sales revenues for the Mar '19 quarter, right at the +25% minimum earnings guideline (C criteria). Prior comparisons established its strong earnings track record. It has earned a 96 Earnings Per Share Rating.
The high-ranked Computer Software - Enterprise firm was last shown in this FSU section on 4/16/19 under the headline, "Paycom Software Quietly Hovering Near All-Time High". It found support after a deep slump below its 200 DMA line after dropped from the Featured Stocks list on 10/10/18. It returned to the Featured Stocks list when highlighted in yellow with new pivot point cited based on its 9/14/18 high plus 10 cents in the 2/06/19 mid-day report (read here). A "breakaway gap" cleared all overhead supply and triggered a technical buy signal.
The current Up/Down Volume Ratio of 1.3 is an unbiased indication its shares have been under accumulation over the past 50 days. Its small supply of only 58.5 million shares outstanding (S criteria) can contribute to greater price volatility in the event of institutional buying or selling. The number of top-rated funds owning its shares rose from 384 in Jun '17 to 513 in Mar '19, a reassuring sign concerning the I criteria. It has a Timeliness rating of A and Sponsorship rating of B. It completed Secondary Offerings on 11/13/15, 9/16/15, 5/15/15 and 1/14/15 since its $15 IPO on 4/15/14.
|
|
|
Color Codes Explained :
Y - Better candidates highlighted by our
staff of experts.
G - Previously featured
in past reports as yellow but may no longer be buyable under the
guidelines.
***Last / Change / Volume data in this table is the closing quote data***
Symbol/Exchange
Company Name
Industry Group |
PRICE |
CHANGE
(%Change) |
Day High |
Volume
(% DAV)
(% 50 day avg vol) |
52 Wk Hi
% From Hi |
Featured
Date |
Price
Featured |
Pivot Featured |
|
Max Buy |
SPSC
-
NASDAQ
S P S Commerce Inc
COMPUTER SOFTWARE and SERVICES - Application Software
|
$101.93
|
-1.56
-1.51% |
$105.88
|
104,037
67.56% of 50 DAV
50 DAV is 154,000
|
$115.00
-11.37%
|
3/26/2019
|
$107.12
|
PP = $113.41
|
|
MB = $119.08
|
Most Recent Note - 5/30/2019 5:57:51 PM
G - Still meeting resistance while sputtering below its 50 DMA line ($104.30) and it faces resistance due to overhead supply up to the $115 level. Recent low ($98.59 on 4/18/19) defines important near-term support to watch. Fundamentals remain strong.
>>> FEATURED STOCK ARTICLE : Sputtering Near 50-Day Average Line Building Base-On-Base - 5/1/2019 |
View all notes |
Set NEW NOTE alert |
Company Profile |
SEC
News |
Chart |
Request a new note
C
A
S
I |
EPAM
-
NYSE
Epam Systems Inc
COMPUTER SOFTWARE and SERVICES - Information Technology Service
|
$172.59
|
-0.45
-0.26% |
$173.50
|
817,925
180.16% of 50 DAV
50 DAV is 454,000
|
$180.55
-4.41%
|
5/9/2019
|
$169.25
|
PP = $180.55
|
|
MB = $189.58
|
Most Recent Note - 5/29/2019 1:01:03 PM
G - Met resistance near its 50 DMA line ($171) while sputtering in recent weeks, and a rebound above that important short-term average is needed for its outlook to improve. Reported earnings +34% on +23% sales revenues for the Mar '19 quarter, continuing its strong earnings track record.
>>> FEATURED STOCK ARTICLE : Found Support and Closed in Upper Third of Day's Range - 5/9/2019 |
View all notes |
Set NEW NOTE alert |
Company Profile |
SEC
News |
Chart |
Request a new note
C
A
S
I |
ENV
-
NYSE
Envestnet Inc
FINANCIAL SERVICES - Diversified Investments
|
$66.91
|
-1.37
-2.01% |
$67.79
|
205,492
71.85% of 50 DAV
50 DAV is 286,000
|
$72.67
-7.93%
|
3/15/2019
|
$66.05
|
PP = $64.90
|
|
MB = $68.15
|
Most Recent Note - 5/28/2019 8:21:33 PM
G - Consolidating above its 50 DMA line ($68.07). Weak action came after recently reporting earnings +5% on +1% sales revenues for the Mar '19 quarter, below the +25% minimum earnings guideline (C criteria). The prior high ($64.80 on 9/14/18) defines important near-term support to watch.
>>> FEATURED STOCK ARTICLE : Negative Reversal After Another New High - 4/24/2019 |
View all notes |
Set NEW NOTE alert |
Company Profile |
SEC
News |
Chart |
Request a new note
C
A
S
I |
TPL
-
NYSE
Texas Pacific Land Trust
Real Estate Dvlpmt/Ops
|
$737.01
|
-39.60
-5.10% |
$766.80
|
28,731
191.54% of 50 DAV
50 DAV is 15,000
|
$915.66
-19.51%
|
5/15/2019
|
$850.01
|
PP = $915.76
|
|
MB = $961.55
|
Most Recent Note - 5/30/2019 5:59:27 PM
G - Still sputtering below its 50 DMA line ($820) and a prompt rebound is needed for its outlook to improve. Subsequent gains above the pivot point backed by at least +40% above average volume may trigger a technical buy signal. Keep in mind that the major averages (M criteria) need a follow-through day to confirm a new uptrend before any new buying efforts are justified under the fact-based investment system. Reported earnings +222% on +219% sales revenues for the Mar '19 quarter continuing its strong earnings track record.
>>> FEATURED STOCK ARTICLE : Recently Found Support and Rose Toward All-Time High - 5/17/2019 |
View all notes |
Set NEW NOTE alert |
Company Profile |
SEC
News |
Chart |
Request a new note
C
A
S
I |
LHCG
-
NASDAQ
L H C Group Inc
HEALTH SERVICES - Home Health Care
|
$113.28
|
+0.60
0.53% |
$114.05
|
142,646
55.72% of 50 DAV
50 DAV is 256,000
|
$122.20
-7.30%
|
4/29/2019
|
$110.94
|
PP = $115.64
|
|
MB = $121.42
|
Most Recent Note - 5/30/2019 5:46:08 PM
Y - Still sputtering below its pivot point after losses on higher volume. Its 50 DMA line ($111) defines near-term support. Fundamentals remain strong.
>>> FEATURED STOCK ARTICLE : Long-Term Care Firm Hovering Near All-Time High - 5/14/2019 |
View all notes |
Set NEW NOTE alert |
Company Profile |
SEC
News |
Chart |
Request a new note
C
A
S
I |
Symbol/Exchange
Company Name
Industry Group |
PRICE |
CHANGE
(%Change) |
Day High |
Volume
(% DAV)
(% 50 day avg vol) |
52 Wk Hi
% From Hi |
Featured
Date |
Price
Featured |
Pivot Featured |
|
Max Buy |
ENSG
-
NASDAQ
Ensign Group Inc
HEALTH SERVICES - Long-Term Care Facilities
|
$53.26
|
-0.24
-0.45% |
$53.75
|
259,513
86.79% of 50 DAV
50 DAV is 299,000
|
$58.14
-8.39%
|
4/30/2019
|
$51.46
|
PP = $53.30
|
|
MB = $55.97
|
Most Recent Note - 5/30/2019 6:00:48 PM
Y - Showed resilience in recent weeks after it reported earnings +22% on +12% sales revenues for the Mar '19 quarter, below the +25% minimum earnings guideline (C criteria), raising fundamental concerns. Its 50 DMA line ($51.94) defines near-term support to watch.
>>> FEATURED STOCK ARTICLE : Two Damaging Losses Hurt Outlook - 4/17/2019 |
View all notes |
Set NEW NOTE alert |
Company Profile |
SEC
News |
Chart |
Request a new note
C
A
S
I |
LULU
-
NASDAQ
Lululemon Athletica
MANUFACTURING - Textile Manufacturing
|
$165.59
|
+1.74
1.06% |
$165.63
|
1,617,156
70.71% of 50 DAV
50 DAV is 2,287,000
|
$179.50
-7.75%
|
3/28/2019
|
$169.20
|
PP = $164.89
|
|
MB = $173.13
|
Most Recent Note - 5/29/2019 1:18:13 PM
G - Color code is changed to green after violating its 50 DMA line ($168.48) and prior highs in the $164 area with today's big volume-driven loss triggering technical sell signals. Due to report Apr '19 quarterly earnings news after the close on Wednesday, June 12th
>>> FEATURED STOCK ARTICLE : Volume Light While Hovering Near High - 5/10/2019 |
View all notes |
Set NEW NOTE alert |
Company Profile |
SEC
News |
Chart |
Request a new note
C
A
S
I |
ULTA
-
NASDAQ
Ulta Beauty Inc
SPECIALTY RETAIL - Specialty Retail, Other
|
$333.38
|
+4.92
1.50% |
$335.13
|
3,184,612
470.40% of 50 DAV
50 DAV is 677,000
|
$359.69
-7.31%
|
3/15/2019
|
$341.27
|
PP = $322.59
|
|
MB = $338.72
|
 Most Recent Note - 5/31/2019 12:56:39 PM
G - Rebounded from a deep early loss today after gapping down. Reported earnings +17% on +13% sales revenues for the Apr '19 quarter, below the +25% minimum earnings guideline (C criteria), raising fundamental concerns. Volume and volatility often increase near earnings news. Prior notes cautioned members - "Slumped further below its 50 DMA line ($344) and violated the prior low ($325.62 on 5/14/19) with damaging volume-driven losses hurting its outlook. A rebound above the 50 DMA line is needed for its outlook to improve. Faces resistance due to overhead supply up to the $359 level.
>>> FEATURED STOCK ARTICLE : Volume Totals Cooling in Recent Weeks While Hovering Near High - 4/26/2019 |
View all notes |
Set NEW NOTE alert |
Company Profile |
SEC
News |
Chart |
Request a new note
C
A
S
I |
ESNT
-
NYSE
Essent Group Ltd
Finance-MrtgandRel Svc
|
$46.95
|
-0.54
-1.14% |
$47.12
|
881,456
147.65% of 50 DAV
50 DAV is 597,000
|
$48.88
-3.95%
|
3/18/2019
|
$45.84
|
PP = $45.06
|
|
MB = $47.31
|
Most Recent Note - 5/28/2019 8:22:43 PM
Y - Still perched near its 52-week high. Recently reported earnings +15% on +20% sales revenues for the Mar '19 quarter, below the +25% minimum earnings guideline (C criteria), raising fundamental concerns. Its 50 DMA line ($46.16) defines near term support to watch. Faces very little resistance due to overhead supply up to the $50 level.
>>> FEATURED STOCK ARTICLE : Perched Above Pivot Point With Earnings News Due May 3rd - 4/25/2019 |
View all notes |
Set NEW NOTE alert |
Company Profile |
SEC
News |
Chart |
Request a new note
C
A
S
I |
FIVE
-
NASDAQ
Five Below Inc
Retail-DiscountandVariety
|
$128.73
|
-0.59
-0.46% |
$130.82
|
928,815
79.39% of 50 DAV
50 DAV is 1,170,000
|
$148.22
-13.15%
|
4/11/2019
|
$132.05
|
PP = $133.75
|
|
MB = $140.44
|
Most Recent Note - 5/29/2019 5:22:23 PM
G - Color code is changed to green after slumping below its 50 DMA line ($131.62) again with today's big loss. Recent low ($123.64 on 5/20/19) defines the next important near-term support above its 200 DMA line.
>>> FEATURED STOCK ARTICLE : Rallied But Slumped Back Near 50-Day Moving Average - 5/28/2019 |
View all notes |
Set NEW NOTE alert |
Company Profile |
SEC
News |
Chart |
Request a new note
C
A
S
I |
Symbol/Exchange
Company Name
Industry Group |
PRICE |
CHANGE
(%Change) |
Day High |
Volume
(% DAV)
(% 50 day avg vol) |
52 Wk Hi
% From Hi |
Featured
Date |
Price
Featured |
Pivot Featured |
|
Max Buy |
NOW
-
NYSE
Servicenow Inc
Computer Sftwr-Enterprse
|
$261.93
|
-0.67
-0.26% |
$265.44
|
1,217,170
69.55% of 50 DAV
50 DAV is 1,750,000
|
$281.74
-7.03%
|
4/22/2019
|
$242.64
|
PP = $251.75
|
|
MB = $264.34
|
Most Recent Note - 5/29/2019 5:30:52 PM
G - The 50 DMA line ($255) and prior high ($251.65 on 3/21/19) define important near-term support to watch while consolidating near its all-time high. Recently reported earnings +20% on +34% sales revenues for the Mar '19 quarter, below the +25% minimum earnings guideline (C criteria), raising concerns, fundamentally. See the latest FSU analysis for more details and a new annotated graph.
>>> FEATURED STOCK ARTICLE : Leader Consolidating Above 50-Day Moving Average Line - 5/29/2019 |
View all notes |
Set NEW NOTE alert |
Company Profile |
SEC
News |
Chart |
Request a new note
C
A
S
I |
QLYS
-
NASDAQ
Qualys Inc
Computer Sftwr-Security
|
$88.61
|
-1.57
-1.74% |
$89.87
|
324,229
104.25% of 50 DAV
50 DAV is 311,000
|
$98.30
-9.86%
|
5/23/2019
|
$90.43
|
PP = $98.40
|
|
MB = $103.32
|
Most Recent Note - 5/30/2019 5:54:07 PM
Y - Subsequent volume-driven gains above the pivot point are still needed to trigger a technical buy signal. Its Relative Strength Rating is 87, above the 80+ minimum guideline for buy candidates. Near-term support to watch is its 50 DMA line ($85.66) and prior low ($83.68). Met stubborn resistance in the $97-98 area. Reported earnings +36% on +16% sales revenues for the Mar '19 quarter, continuing its strong earnings history.
>>> FEATURED STOCK ARTICLE : Rallying to Challenge Previously Stubborn Resistance - 5/2/2019 |
View all notes |
Set NEW NOTE alert |
Company Profile |
SEC
News |
Chart |
Request a new note
C
A
S
I |
VEEV
-
NYSE
Veeva Systems Inc Cl A
Computer Sftwr-Medical
|
$154.29
|
-0.01
-0.01% |
$156.98
|
2,844,467
248.86% of 50 DAV
50 DAV is 1,143,000
|
$156.93
-1.68%
|
5/30/2019
|
$154.32
|
PP = $145.80
|
|
MB = $153.09
|
Most Recent Note - 5/31/2019 12:58:13 PM
Y - Trading up today after finishing strong when highlighted in yellow with pivot point cited based on its 5/16/19 high plus 10 cents in the prior mid-day report. Gapped up hitting a new all-time high, rallying from the previously noted advanced "3 weeks tight" base. Bullish action came after it reported earnings +52% on +25% sales revenues for the Apr '19 quarter, marking its 5th strong quarter with earnings above the +25% minimum guideline (C criteria). Disciplined investors will note that no new buying efforts are to be made during market corrections (M criteria) under the fact-based investment system's rules. Watch for a confirmed rally with a follow-through day first. See the latest FSU analysis for more details and an annotated graph.
>>> FEATURED STOCK ARTICLE : Big Volume-Driven Gain for New High Following Earnings News - 5/30/2019 |
View all notes |
Set NEW NOTE alert |
Company Profile |
SEC
News |
Chart |
Request a new note
C
A
S
I |
PAYC
-
NYSE
Paycom Software Inc
COMPUTER SOFTWARE and SERVICES - Application Software
|
$212.10
|
+2.96
1.42% |
$212.58
|
1,198,646
171.97% of 50 DAV
50 DAV is 697,000
|
$215.65
-1.65%
|
2/6/2019
|
$171.66
|
PP = $164.18
|
|
MB = $172.39
|
Most Recent Note - 5/31/2019 12:43:10 PM
G - Still holding its ground in a tight range near its all-time high. Its 50 DMA line ($197.03) defines important near-term support to watch. Reported earnings +25% on +30% sales revenues for the Mar '19 quarter.
>>> FEATURED STOCK ARTICLE : Posted Volume-Driven Gain While Hovering Near All-Time High - 5/31/2019 |
View all notes |
Set NEW NOTE alert |
Company Profile |
SEC
News |
Chart |
Request a new note
C
A
S
I |
PYPL
-
NASDAQ
Paypal Holdings Inc
Finance-CrdtCard/PmtPr
|
$109.75
|
-1.66
-1.49% |
$110.80
|
4,807,384
79.40% of 50 DAV
50 DAV is 6,055,000
|
$114.66
-4.28%
|
1/24/2019
|
$92.56
|
PP = $93.80
|
|
MB = $98.49
|
Most Recent Note - 5/30/2019 5:51:36 PM
G - Hovering near its all-time high, stubbornly holding its ground, but very extended from any sound base. Its 50 DMA line ($108.20) and prior low ($106.52) define important near-term support to watch. Recently reported earnings +37% on +12% sales revenues for the Mar '19 quarter, continuing its strong earnings track record.
>>> FEATURED STOCK ARTICLE : Hovering Near All Time High Extended From Any Sound Base - 5/15/2019 |
View all notes |
Set NEW NOTE alert |
Company Profile |
SEC
News |
Chart |
Request a new note
C
A
S
I |
Symbol/Exchange
Company Name
Industry Group |
PRICE |
CHANGE
(%Change) |
Day High |
Volume
(% DAV)
(% 50 day avg vol) |
52 Wk Hi
% From Hi |
Featured
Date |
Price
Featured |
Pivot Featured |
|
Max Buy |
PLNT
-
NYSE
Planet Fitness Inc Cl A
Leisure-Services
|
$76.47
|
+0.91
1.20% |
$77.02
|
815,364
57.75% of 50 DAV
50 DAV is 1,412,000
|
$81.76
-6.47%
|
11/7/2018
|
$57.10
|
PP = $55.45
|
|
MB = $58.22
|
Most Recent Note - 5/30/2019 5:49:55 PM
G - Still extended from any sound base. Its 50 DMA line ($73.39) and prior low define near-term support levels to watch. Violations would raise concerns and trigger technical sell signals. Fundamentals remain strong.
>>> FEATURED STOCK ARTICLE : Pulling Back From High After Impressive Rally - 5/23/2019 |
View all notes |
Set NEW NOTE alert |
Company Profile |
SEC
News |
Chart |
Request a new note
C
A
S
I |
BLD
-
NYSE
Topbuild Corp
Bldg-Constr Prds/Misc
|
$79.27
|
+1.01
1.29% |
$79.44
|
295,392
94.98% of 50 DAV
50 DAV is 311,000
|
$87.21
-9.10%
|
5/17/2019
|
$82.19
|
PP = $87.31
|
|
MB = $91.68
|
Most Recent Note - 5/30/2019 5:44:16 PM
Y - Encountered distributional pressure in recent weeks after highlighted in the 5/17/19 mid-day report. Subsequent gains above the pivot point backed by at least +40% above average volume may trigger a technical buy signal. Reported earnings +45% on +26% sales revenues for the Mar '19 quarter. Quarterly earnings increases have been above the +25% minimum guideline (C criteria). Annual earnings (A criteria) history has been strong and steady since turning profitable in FY '14.
>>> FEATURED STOCK ARTICLE : Encountered Distributional Pressure Near Prior High - 5/20/2019 |
View all notes |
Set NEW NOTE alert |
Company Profile |
SEC
News |
Chart |
Request a new note
C
A
S
I |
TEAM
-
NASDAQ
Atlassian Corp Plc Cl A
Comp Sftwr-Spec Enterprs
|
$125.88
|
-0.34
-0.27% |
$127.34
|
1,073,341
59.90% of 50 DAV
50 DAV is 1,792,000
|
$132.87
-5.26%
|
5/24/2019
|
$129.52
|
PP = $132.09
|
|
MB = $138.69
|
Most Recent Note - 5/29/2019 5:24:15 PM
Y - Gapped down today. Formed an advanced "3-weeks tight" base. Prior high ($117) defines important neat-term support to watch. Subsequent volume-driven gains for new highs may trigger a new (or add-on) technical buy signal. Reported earnings +133% on +38% sales revenues for the Mar '19 quarter, continuing its strong earnings track record.
>>> FEATURED STOCK ARTICLE : Perched Near All-Time High After "3-Weeks Tight" - 5/24/2019 |
View all notes |
Set NEW NOTE alert |
Company Profile |
SEC
News |
Chart |
Request a new note
C
A
S
I |
GLOB
-
NYSE
Globant SA
Computer-Tech Services
|
$92.84
|
+2.07
2.28% |
$93.19
|
321,988
92.00% of 50 DAV
50 DAV is 350,000
|
$93.50
-0.71%
|
2/15/2019
|
$69.35
|
PP = $70.00
|
|
MB = $73.50
|
Most Recent Note - 5/29/2019 1:06:01 PM
G - Gapped down today, retreating from its all-time high after getting very extended from any sound base. Its 50 DMA line ($79.74) defines important support above the prior high ($74). Violations would raise concerns and trigger technical sell signals. Reported earnings +32% on +22% sales revenues for the quarter ended March 31st, 2019 versus the year ago period, continuing its strong earning track record.
>>> FEATURED STOCK ARTICLE : Earnings News Due While Perched Near All-Time High - 5/7/2019 |
View all notes |
Set NEW NOTE alert |
Company Profile |
SEC
News |
Chart |
Request a new note
C
A
S
I |
|
|
|
THESE ARE NOT BUY RECOMMENDATIONS!
Comments contained in the body of this report are technical
opinions only. The material herein has been obtained
from sources believed to be reliable and accurate, however,
its accuracy and completeness cannot be guaranteed.
This site is not an investment advisor, hence it does
not endorse or recommend any securities or other investments.
Any recommendation contained in this report may not
be suitable for all investors and it is not to be deemed
an offer or solicitation on our part with respect to
the purchase or sale of any securities. All trademarks,
service marks and trade names appearing in this report
are the property of their respective owners, and are
likewise used for identification purposes only.
This report is a service available
only to active Paid Premium Members.
You may opt-out of receiving report notifications
at any time. Questions or comments may be submitted
by writing to Premium Membership Services 665 S.E. 10 Street, Suite 201 Deerfield Beach, FL 33441-5634 or by calling 1-800-965-8307
or 954-785-1121.
|
|
|