You are not logged in.
This means you
CAN ONLY VIEW reports that were published prior to Thursday, March 20, 2025.
You
MUST UPGRADE YOUR MEMBERSHIP if you want to see any current reports.
AFTER MARKET UPDATE - TUESDAY, MARCH 28TH, 2023
Previous After Market Report Next After Market Report >>>
|
|
|
|
DOW |
-37.83 |
32,394.25 |
-0.12% |
|
Volume |
797,929,678 |
-13% |
|
Volume |
4,019,545,000 |
-6% |
|
NASDAQ |
-52.76 |
11,716.08 |
-0.45% |
|
Advancers |
1,752 |
60% |
|
Advancers |
1,892 |
43% |
|
S&P 500 |
-6.26 |
3,971.27 |
-0.16% |
|
Decliners |
1,174 |
40% |
|
Decliners |
2,545 |
57% |
|
Russell 2000 |
-1.04 |
1,752.63 |
-0.06% |
|
52 Wk Highs |
27 |
|
|
52 Wk Highs |
43 |
|
|
S&P 600 |
+1.17 |
1,153.08 |
+0.10% |
|
52 Wk Lows |
50 |
|
|
52 Wk Lows |
147 |
|
|
Recent commentaries have noted an ongoing "market correction". No new buying efforts are to be made based on the (M criteria) of the fact-based investment system. Disciplined investors know to reduce market exposure by selling any weakening stocks on a case-by-case basis.
|
 |
Indices Sputter Again on Lighter Volume Totals and Thin Leadership
Kenneth J. Gruneisen - Passed the CAN SLIM® Master's Exam
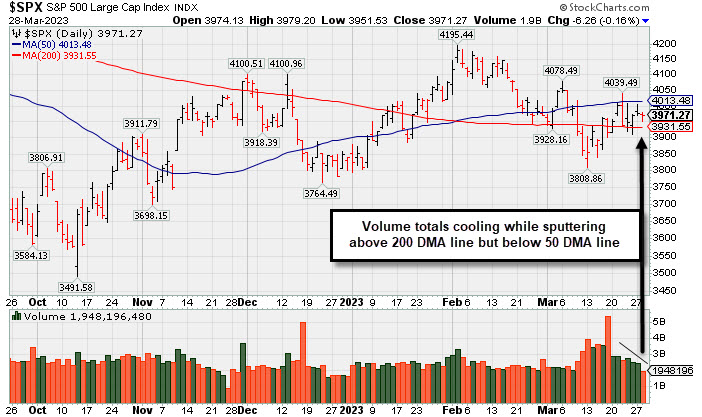
The Dow lost 37 points (-0.1%) while the Nasdaq Composite declined 0.5%. The S&P 500 dropped 0.2%. Volume totals reported were lighter than the prior session on the NYSE and on the Nasdaq exchange, a reassuring sign of lighter institutional selling or less "distributional" pressure on stocks. Breadth was negative as decliners led advancers by a 3-2 margin on the NYSE and by a 5-4 margin on the Nasdaq exchange. There were 12 high-ranked companies from theLeaders List that hit a new 52-week high and were listed on the BreakOuts Page, versus the total of 14 on the prior session. New 52-week lows outnumbered new 52-week highs on the NYSE and on the Nasdaq exchange. The major indices are still in a market correction (M criteria). Disciplined investors know that the fact-based investment system does not allow any new buying efforts until there is a new confirmed rally marked by a noted follow-through day. Caution and patience remain paramount! Stay tuned...
PICTURED: The S&P 500 Index has been sputtering above its 200-day moving average (DMA) line but below its 50 DMA line with volume totals cooling. Tuesday's session marked Day 9 of the benchmark index's current rally attempt. Disciplined investors still are watching for a solid follow-through day to confirm a new uptrend.
Six of the eleven sectors finished in negative territory as U.S. equities closed in the red Tuesday. Technology stocks weighed on the broader market amid continued pressure from high interest rates, which were raised further by the Federal Reserve (Fed) last week. Elsewhere, Fed Vice Chair Michael Barr wrapped up his two days in Congress today. Barr commented on potential changes implemented by the central bank following the failure of two banks earlier this month. He noted the Fed will investigate strengthening capital and liquidity rules along with considering long-term debt requirements to provide an extra cushion, particularly on banks with more than $100 billion in assets.
On the data front, consumer confidence came in hotter than expected in March as the Conference Board Consumer Confidence Index jumped to 104.2 from the prior month’s upwardly revised 103.4 print. January’s Federal Housing Finance Agency (FHFA) Price Index also topped analyst’s estimates by increasing 0.2%, up from December’s 0.1% decline. Meanwhile, January’s S&P CoreLogic Case-Shiller U.S. Housing Price Index came in at 3.79% annual growth, declining from the revised 5.63% seen in December.
Treasuries weakened, with the yield on the benchmark 10-year note up one basis point (0.01%) to 3.55%, while the 30-year bond yield gained one basis point (0.01%) to 3.76%. The yield on the two-year note added four basis points (0.04%) to 4.06%. Over in the commodity pits, West Texas Intermediate (WTI) crude increased 0.8% to $73.36/barrel amid disruption risks from Iraqi Kurdistan after the region was forced to halt exports.
|
 Kenneth J. Gruneisen started out as a licensed stockbroker in August 1987, a couple of months prior to the historic stock market crash that took the Dow Jones Industrial Average down -22.6% in a single day. He has published daily fact-based fundamental and technical analysis on high-ranked stocks online for two decades. Through FACTBASEDINVESTING.COM, Kenneth provides educational articles, news, market commentary, and other information regarding proven investment systems that work in good times and bad.
Comments contained in the body of this report are technical opinions only and are not necessarily those of Gruneisen Growth Corp. The material herein has been obtained from sources believed to be reliable and accurate, however, its accuracy and completeness cannot be guaranteed. Our firm, employees, and customers may effect transactions, including transactions contrary to any recommendation herein, or have positions in the securities mentioned herein or options with respect thereto. Any recommendation contained in this report may not be suitable for all investors and it is not to be deemed an offer or solicitation on our part with respect to the purchase or sale of any securities. |
|
 |
Commodity-Linked Groups Led Financial Indexes Higher
Kenneth J. Gruneisen - Passed the CAN SLIM® Master's Exam
The Broker/Dealer Index ($XBD +0.46%) and Bank Index ($BKX +0.32%) both posted modest gains while the Retail Index ($RLX -0.19%) edged lower. Commodity-linked groups posted solid gains as the Oil Services Index ($OSX +2.77%), Integrated Oil Index ($XOI +1.88%), and Gold & Silver Index ($XAU +2.37%) each rose. Meanwhile, the Semiconductor Index ($SOX -0.85%) and Networking Index ($NWX -0.59%) both edged lower and the Biotech Index ($BTK +0.01%) finished flat.
PICTURED: The Biotech Index ($BTK +0.01%) is consolidating above its 200-day moving average (DMA) line.
| Oil Services |
$OSX |
77.96 |
+2.10 |
+2.77% |
-7.03% |
| Integrated Oil |
$XOI |
1,691.63 |
+31.20 |
+1.88% |
-5.35% |
| Semiconductor |
$SOX |
3,057.27 |
-26.31 |
-0.85% |
+20.74% |
| Networking |
$NWX |
814.93 |
-4.88 |
-0.59% |
+4.04% |
| Broker/Dealer |
$XBD |
450.21 |
+2.06 |
+0.46% |
+0.24% |
| Retail |
$RLX |
2,842.90 |
-5.44 |
-0.19% |
+3.23% |
| Gold & Silver |
$XAU |
130.30 |
+3.01 |
+2.37% |
+7.81% |
| Bank |
$BKX |
80.64 |
+0.26 |
+0.32% |
-20.04% |
| Biotech |
$BTK |
5,154.63 |
+0.53 |
+0.01% |
-2.39% |
|
|
|
 |
Pulling Back After Getting Very Extended From Prior Base
Kenneth J. Gruneisen - Passed the CAN SLIM® Master's Exam
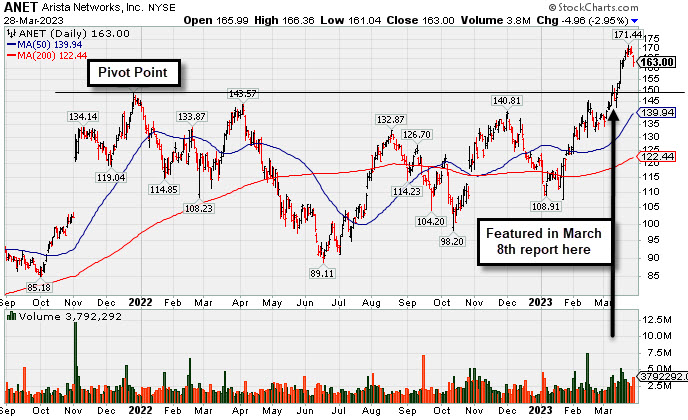
Arista Networks Inc (ANET -$4.96 or -2.95% to $163.00) gapped down today and suffered a loss backed by +46% above average volume, retreating from its all-time high. It remains very extended from any sound base after an impressive spurt of volume-driven gains. Prior highs in the $148-145 area define initial support to watch above its 50-day moving average (DMA )line ($140). Broader market weakness (M criteria) has been noted as a "correction" that has raised concerns.
ANET was highlighted in yellow with pivot point cited based on its 12/27/21 high plus 10 cents in the 3/08/23 mid-day report (read here). It was last shown in this FSU section on 3/08/23 with an annotated graph under the headline, "Arista Challenging All-Time High". Subsequent gains above the pivot point backed by more than +40% above average volume triggered a technical buy signal.
ANET currently has a 98 Earnings Per Share Rating. It reported Dec '22 quarterly earnings +72% on +55% sales revenues versus the year ago period, its 5th quarterly comparison strong and steady above the +25% minimum earnings guideline (C criteria). Annual earnings had a downturn in FY 20 like many during the pandemic.
The number of top-rated funds owning its shares rose from 1,758 in Dec '21 to 2,061 in Dec '22, a reassuring sign concerning the I criteria. Its current Up/Down Volume Ratio of 2.7 is an unbiased indication its shares have been under accumulation over the past 50 days. The high-ranked Computer - Networking firm has a Timeliness Rating of A and a Sponsorship Rating of C. Its small supply of 245.1 million shares (S criteria) in the public float may contribute to greater volatility in the event of institutional buying or selling.
|
|
|
Color Codes Explained :
Y - Better candidates highlighted by our
staff of experts.
G - Previously featured
in past reports as yellow but may no longer be buyable under the
guidelines.
***Last / Change / Volume data in this table is the closing quote data***
Symbol/Exchange
Company Name
Industry Group |
PRICE |
CHANGE
(%Change) |
Day High |
Volume
(% DAV)
(% 50 day avg vol) |
52 Wk Hi
% From Hi |
Featured
Date |
Price
Featured |
Pivot Featured |
|
Max Buy |
 GPK
-
NYSE
GPK
-
NYSE
Graphic Packaging
CONSUMER NON-DURABLES - Packaging and Containers
|
$25.15
|
+0.33
1.33% |
$25.17
|
3,184,323
95.83% of 50 DAV
50 DAV is 3,323,000
|
$25.17
-0.08%
|
10/25/2022
|
$22.75
|
PP = $24.17
|
|
MB = $25.38
|
Most Recent Note - 3/27/2023 6:05:39 PM
Y - Posted a 3rd consecutive gain today with lighter volume, wedging back above the noted pivot point. Its 50 DMA line ($23.59) and recent low ($22.99 on 3/16/23) define important near-term support to watch. More damaging losses would raise greater concerns and trigger a technical sell signal.
>>> FEATURED STOCK ARTICLE : Found Encouraging Support Near 50-Day Moving Average Line - 3/21/2023 |
View all notes |
Set NEW NOTE alert |
Company Profile |
SEC
News |
Chart |
Request a new note
C
A
S
I |
STRL
-
NASDAQ
Sterling Infrastructure
MATERIALS and; CONSTRUCTION - Heavy Construction
|
$38.30
|
-0.12
-0.31% |
$38.63
|
147,286
51.32% of 50 DAV
50 DAV is 287,000
|
$42.00
-8.81%
|
12/14/2022
|
$32.41
|
PP = $33.72
|
|
MB = $35.41
|
 Most Recent Note - 3/28/2023 3:44:01 PM
G - On track today for a 3rd consecutive small gain with below-average volume. Its 50 DMA line ($37.09) defines important near-term support to watch above recent lows in the mid-$36 area.
>>> FEATURED STOCK ARTICLE : Posting Quiet Gains Just Above 50-Day Moving Average Line - 3/20/2023 |
View all notes |
Set NEW NOTE alert |
Company Profile |
SEC
News |
Chart |
Request a new note
C
A
S
I |
PERI
-
NASDAQ
Perion Network
Comml Svcs-Advertising
|
$38.33
|
-0.77
-1.97% |
$39.02
|
465,916
58.90% of 50 DAV
50 DAV is 791,000
|
$39.54
-3.06%
|
1/25/2023
|
$31.79
|
PP = $33.19
|
|
MB = $34.85
|
Most Recent Note - 3/28/2023 3:42:27 PM
G - Pulling back today with light volume after hitting new all-time highs with 5 consecutive gains. Found support when recently consolidating above its 50 DMA line ($33.86) and the prior high ($33) which define important near-term support.
>>> FEATURED STOCK ARTICLE : Consolidating in an Orderly Manner Above Old High and 50 DMA Line - 3/15/2023 |
View all notes |
Set NEW NOTE alert |
Company Profile |
SEC
News |
Chart |
Request a new note
C
A
S
I |
ALGM
-
NASDAQ
Allegro MicroSystems
Elec-Semiconductor Mfg
|
$45.08
|
-1.04
-2.25% |
$46.18
|
1,268,811
74.37% of 50 DAV
50 DAV is 1,706,000
|
$48.30
-6.67%
|
1/31/2023
|
$37.80
|
PP = $38.38
|
|
MB = $40.30
|
Most Recent Note - 3/28/2023 3:39:35 PM
G - Pulling back today for a 3rd consecutive loss with below-average volume. It is extended from the previously noted base. Its 50 DMA line ($42) and recent low ($41.30 on 3/18/23) define important near-term support to watch.
>>> FEATURED STOCK ARTICLE : Extended From Prior Base and Perched Near All-Time High - 3/22/2023 |
View all notes |
Set NEW NOTE alert |
Company Profile |
SEC
News |
Chart |
Request a new note
C
A
S
I |
FIX
-
NYSE
Comfort Systems USA
MATERIALS and CONSTRUCTION - General Contractors
|
$141.94
|
+2.23
1.60% |
$142.85
|
227,888
90.79% of 50 DAV
50 DAV is 251,000
|
$152.13
-6.70%
|
2/23/2023
|
$136.52
|
PP = $128.78
|
|
MB = $135.22
|
Most Recent Note - 3/28/2023 3:40:54 PM
G - Posting a 3rd consecutive small gain with light volume. Consolidating well above its 50 DMA line ($131.20) and the prior high in the $128 area defining important support to watch. Fundamentals remain strong.
>>> FEATURED STOCK ARTICLE : Consolidating Above Support at Prior High and 50-Day Moving Average - 3/16/2023 |
View all notes |
Set NEW NOTE alert |
Company Profile |
SEC
News |
Chart |
Request a new note
C
A
S
I |
Symbol/Exchange
Company Name
Industry Group |
PRICE |
CHANGE
(%Change) |
Day High |
Volume
(% DAV)
(% 50 day avg vol) |
52 Wk Hi
% From Hi |
Featured
Date |
Price
Featured |
Pivot Featured |
|
Max Buy |
KOF
-
NYSE
Coca-Cola Femsa ADR
FOOD and BEVERAGE - Beverages - Soft Drinks
|
$78.64
|
+0.19
0.24% |
$78.96
|
213,509
122.01% of 50 DAV
50 DAV is 175,000
|
$79.61
-1.22%
|
3/7/2023
|
$76.63
|
PP = $77.11
|
|
MB = $80.97
|
Most Recent Note - 3/27/2023 6:09:09 PM
Y - Touched a new all-time high today but reversed into the red for a small loss with light volume. Highlighted in yellow with pivot point cited based on its 1/24/23 high plus 10 cents in the 3/07/23 mid-day report. Gains above the pivot point must be backed by at least +40% above average volume to trigger a proper technical buy signal.
>>> FEATURED STOCK ARTICLE : Gain for Best-Ever Close With Near Average Volume - 3/24/2023 |
View all notes |
Set NEW NOTE alert |
Company Profile |
SEC
News |
Chart |
Request a new note
C
A
S
I |
ANET
-
NYSE
Arista Networks
Computer-Networking
|
$163.00
|
-4.96
-2.95% |
$166.36
|
3,792,289
146.19% of 50 DAV
50 DAV is 2,594,000
|
$171.44
-4.92%
|
3/8/2023
|
$147.59
|
PP = $148.67
|
|
MB = $156.10
|
Most Recent Note - 3/28/2023 12:37:52 PM
G - Gapped down today retreating from its all-time high. Very extended from any sound base after an impressive spurt of volume-driven gains. Prior highs in the $148-145 area define initial support to watch above its 50 DMA line ($138). Broader market weakness (M criteria) has been noted as a "correction" that has raised concerns.
>>> FEATURED STOCK ARTICLE : Pulling Back After Getting Very Extended From Prior Base - 3/28/2023 |
View all notes |
Set NEW NOTE alert |
Company Profile |
SEC
News |
Chart |
Request a new note
C
A
S
I |
CLH
-
NYSE
Clean Harbors
Pollution Control
|
$133.00
|
+0.72
0.54% |
$133.67
|
326,112
79.54% of 50 DAV
50 DAV is 410,000
|
$140.69
-5.47%
|
3/10/2023
|
$136.89
|
PP = $136.74
|
|
MB = $143.58
|
Most Recent Note - 3/27/2023 6:07:59 PM
Y - Posted a gain today with below-average volume. Fundamentals remain strong. Its 50 DMA line ($131.99) defines important near-term support to watch.
>>> FEATURED STOCK ARTICLE : Pullback to Support Marked Secondary Buy Point; Market Concerns Rose - 3/10/2023 |
View all notes |
Set NEW NOTE alert |
Company Profile |
SEC
News |
Chart |
Request a new note
C
A
S
I |
|
|
|
THESE ARE NOT BUY RECOMMENDATIONS!
Comments contained in the body of this report are technical
opinions only. The material herein has been obtained
from sources believed to be reliable and accurate, however,
its accuracy and completeness cannot be guaranteed.
This site is not an investment advisor, hence it does
not endorse or recommend any securities or other investments.
Any recommendation contained in this report may not
be suitable for all investors and it is not to be deemed
an offer or solicitation on our part with respect to
the purchase or sale of any securities. All trademarks,
service marks and trade names appearing in this report
are the property of their respective owners, and are
likewise used for identification purposes only.
This report is a service available
only to active Paid Premium Members.
You may opt-out of receiving report notifications
at any time. Questions or comments may be submitted
by writing to Premium Membership Services 665 S.E. 10 Street, Suite 201 Deerfield Beach, FL 33441-5634 or by calling 1-800-965-8307
or 954-785-1121.
|
|
|