You are not logged in.
This means you
CAN ONLY VIEW reports that were published prior to Monday, March 17, 2025.
You
MUST UPGRADE YOUR MEMBERSHIP if you want to see any current reports.
AFTER MARKET UPDATE - THURSDAY, APRIL 13TH, 2023
Previous After Market Report Next After Market Report >>>
|
|
|
|
DOW |
+383.19 |
34,029.69 |
+1.14% |
|
Volume |
820,987,948 |
+1% |
|
Volume |
4,865,947,800 |
-1% |
|
NASDAQ |
+236.93 |
12,166.27 |
+1.99% |
|
Advancers |
2,064 |
71% |
|
Advancers |
3,221 |
72% |
|
S&P 500 |
+54.27 |
4,146.22 |
+1.33% |
|
Decliners |
854 |
29% |
|
Decliners |
1,268 |
28% |
|
Russell 2000 |
+22.98 |
1,796.68 |
+1.30% |
|
52 Wk Highs |
47 |
|
|
52 Wk Highs |
89 |
|
|
S&P 600 |
+9.74 |
1,172.98 |
+0.84% |
|
52 Wk Lows |
28 |
|
|
52 Wk Lows |
155 |
|
|
 |
Major Averages Rose With Greater Leadership
Kenneth J. Gruneisen - Passed the CAN SLIM® Master's Exam
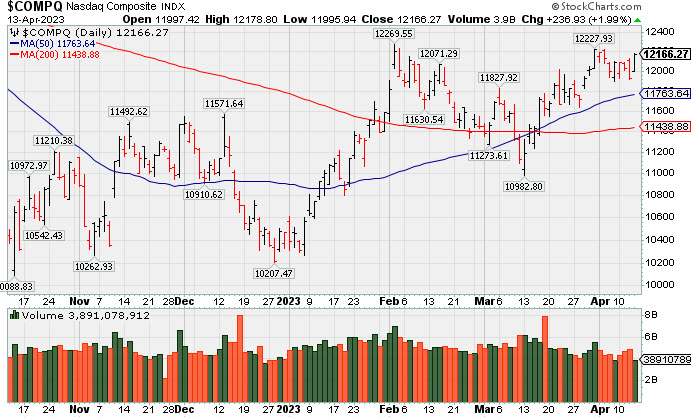
The Dow climbed 383 points (1.1%), while the Nasdaq Composite added 2%. The S&P 500 finished 1.3% higher, notching its highest close since February. Volume totals reported were mixed, higher than the prior session on the NYSE and slightly lower on the Nasdaq exchange. Breadth was positive as advancers led decliners by more than a 2-1 margin on the NYSE and by 5-2 on the Nasdaq exchange. There were 29 high-ranked companies from the Leaders Listthat hit a new 52-week high and were listed on the BreakOuts Page, versus the total of 21 on the prior session. New 52-week highs outnumbered new 52-week lows on the NYSE but new lows still outnumbered new highs on the Nasdaq exchange.The major indices are in a confirmed uptrend (M criteria). Appropriate new buying efforts may be considered under the fact-based investment system.
PICTURED: The Nasdaq Composite Index is consolidating above its 50-day moving average (DMA) line, still lingering below its February high.
U.S. equities finished higher Thursday as investors digested today’s inflation report. The Producer Price Index (PPI), a measure of wholesale inflation, fell 0.5% month-over-month, rising just 2.7% year-over-year, its lowest annual growth rate in over two years. Meanwhile, core PPI (which excludes food and energy prices) fell 0.1% month-over-month versus expectations of a 0.2% monthly gain, while on an annual basis, core PPI came in at 3.4% year-over-year. The PPI data comes a day after the Consumer Price Index (CPI) showed headline inflation eased while core prices accelerated. The data has bolstered hope the Federal Reserve (Fed) may pause rate hikes after their May meeting and may start cutting rates by the end of 2023.
Elsewhere on the data front, initial jobless claims for the week ended April 8 came in at 239,000, up from the prior week’s 228,000 print and higher than Wall Street forecasts. Treasuries weakened as investors tried to gauge the future course of monetary policy. The yield on the benchmark 10-year note climbed five basis points (0.05%) to 3.45%, while the 30-year bond yield advanced five basis points (0.05%) to 3.68%. The yield on the two-year note, which is more sensitive to changes in Fed policy, ticked up one basis point (0.01%) to 3.97%. In commodities, West Texas Intermediate (WTI) crude fell 1.1% to $82.31/barrel amid lingering worries over a recession and concerns over declining crude demand. |
 Kenneth J. Gruneisen started out as a licensed stockbroker in August 1987, a couple of months prior to the historic stock market crash that took the Dow Jones Industrial Average down -22.6% in a single day. He has published daily fact-based fundamental and technical analysis on high-ranked stocks online for two decades. Through FACTBASEDINVESTING.COM, Kenneth provides educational articles, news, market commentary, and other information regarding proven investment systems that work in good times and bad.
Comments contained in the body of this report are technical opinions only and are not necessarily those of Gruneisen Growth Corp. The material herein has been obtained from sources believed to be reliable and accurate, however, its accuracy and completeness cannot be guaranteed. Our firm, employees, and customers may effect transactions, including transactions contrary to any recommendation herein, or have positions in the securities mentioned herein or options with respect thereto. Any recommendation contained in this report may not be suitable for all investors and it is not to be deemed an offer or solicitation on our part with respect to the purchase or sale of any securities. |
|
 |
Retail, Financial, Tech, and Commodity-Linked Groups Rose
Kenneth J. Gruneisen - Passed the CAN SLIM® Master's Exam
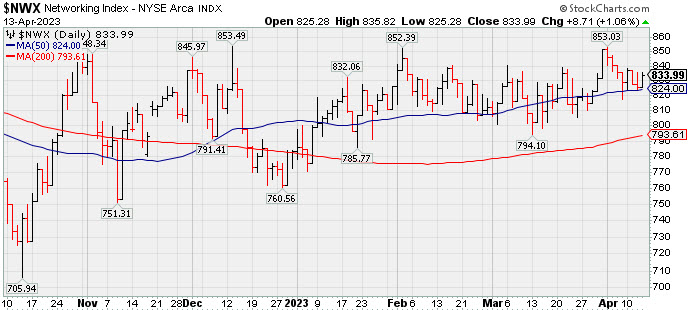
The Retail Index ($RLX +2.75%) posted an influential gain while the Broker/Dealer Index ($XBD +1.31%) and Bank Index ($BKX +0.73%) also rose and helped give the major averages a boost. The tech sector had a positive bias as the Biotech Index ($BTK +1.78%) outpaced the Semiconductor Index ($SOX +0.73%) and the Networking Index ($NWX +1.06%). The Gold & Silver Index ($XAU +2.90%) also posted a big gain, meanwhile the Oil Services Index ($OSX +0.19%) and Integrated Oil Index ($XOI +0.55%) both edged higher.
PICTURED: The Networking Index ($NWX +1.06%) is consolidating above its 50-day moving average (DMA) line.
| Oil Services |
$OSX |
82.88 |
+0.16 |
+0.19% |
-1.17% |
| Integrated Oil |
$XOI |
1,824.95 |
+10.03 |
+0.55% |
+2.11% |
| Semiconductor |
$SOX |
3,074.94 |
+22.43 |
+0.73% |
+21.44% |
| Networking |
$NWX |
833.99 |
+8.71 |
+1.06% |
+6.47% |
| Broker/Dealer |
$XBD |
453.24 |
+5.86 |
+1.31% |
+0.92% |
| Retail |
$RLX |
2,973.78 |
+79.56 |
+2.75% |
+7.98% |
| Gold & Silver |
$XAU |
144.37 |
+4.07 |
+2.90% |
+19.45% |
| Bank |
$BKX |
82.09 |
+0.60 |
+0.73% |
-18.60% |
| Biotech |
$BTK |
5,431.75 |
+94.90 |
+1.78% |
+2.85% |
|
|
|
 |
Featured Stocks
Kenneth J. Gruneisen - Passed the CAN SLIM® Master's Exam
|
|
|
Color Codes Explained :
Y - Better candidates highlighted by our
staff of experts.
G - Previously featured
in past reports as yellow but may no longer be buyable under the
guidelines.
***Last / Change / Volume data in this table is the closing quote data***
Symbol/Exchange
Company Name
Industry Group |
PRICE |
CHANGE
(%Change) |
Day High |
Volume
(% DAV)
(% 50 day avg vol) |
52 Wk Hi
% From Hi |
Featured
Date |
Price
Featured |
Pivot Featured |
|
Max Buy |
 GPK
-
NYSE
GPK
-
NYSE
Graphic Packaging
CONSUMER NON-DURABLES - Packaging and Containers
|
$24.86
|
+0.02
0.08% |
$24.91
|
3,551,784
110.41% of 50 DAV
50 DAV is 3,217,000
|
$25.62
-2.97%
|
10/25/2022
|
$22.75
|
PP = $24.17
|
|
MB = $25.38
|
Most Recent Note - 4/12/2023 5:24:18 PM
Y - Still consolidating below its "max buy" level and just -3% below its all-time high. Recent gains lacked great volume conviction. Its 50 DMA line ($24.10) and recent low ($22.99 on 3/16/23) define important near-term support to watch.
>>> FEATURED STOCK ARTICLE : Quietly Consolidating Just Below "Max Buy" Level - 4/10/2023 |
View all notes |
Set NEW NOTE alert |
Company Profile |
SEC
News |
Chart |
Request a new note
C
A
S
I |
STRL
-
NASDAQ
Sterling Infrastructure
MATERIALS and; CONSTRUCTION - Heavy Construction
|
$36.07
|
+0.55
1.55% |
$36.17
|
183,597
69.54% of 50 DAV
50 DAV is 264,000
|
$42.00
-14.12%
|
12/14/2022
|
$32.41
|
PP = $33.72
|
|
MB = $35.41
|
Most Recent Note - 4/11/2023 5:46:51 PM
G - Still sputtering and failing to rebound after damaging losses with above-average volume violated its 50 DMA line ($37.70) triggering a technical sell signal. A rebound above the 50 DMA line is needed for its outlook to improve.
>>> FEATURED STOCK ARTICLE : Volume-Driven 50-Day Moving Average Violation Triggered Sell Signal - 4/5/2023 |
View all notes |
Set NEW NOTE alert |
Company Profile |
SEC
News |
Chart |
Request a new note
C
A
S
I |
PERI
-
NASDAQ
Perion Network
Comml Svcs-Advertising
|
$39.88
|
+1.05
2.70% |
$40.08
|
422,088
54.39% of 50 DAV
50 DAV is 776,000
|
$42.04
-5.14%
|
1/25/2023
|
$31.79
|
PP = $33.19
|
|
MB = $34.85
|
Most Recent Note - 4/12/2023 5:21:47 PM
G - Pulled back today with below-average volume. Volume totals have been cooling while consolidating near its all-time high. Its 50 DMA line ($35.57) defines important near-term support to watch.
>>> FEATURED STOCK ARTICLE : Hit Another New High With Gain Backed by Light Volume - 3/31/2023 |
View all notes |
Set NEW NOTE alert |
Company Profile |
SEC
News |
Chart |
Request a new note
C
A
S
I |
ALGM
-
NASDAQ
Allegro MicroSystems
Elec-Semiconductor Mfg
|
$44.82
|
+0.00
0.00% |
$45.24
|
881,685
53.79% of 50 DAV
50 DAV is 1,639,000
|
$48.72
-8.00%
|
1/31/2023
|
$37.80
|
PP = $38.38
|
|
MB = $40.30
|
Most Recent Note - 4/11/2023 5:41:30 PM
G - Volume totals have been cooling while consolidating just above its 50 DMA line ($44.31) which defines important near-term support to watch on pullbacks. See the latest FSU analysis for more details and a new annotated graph.
>>> FEATURED STOCK ARTICLE : Consolidating Near 50 DMA Line After Recent Rally - 4/11/2023 |
View all notes |
Set NEW NOTE alert |
Company Profile |
SEC
News |
Chart |
Request a new note
C
A
S
I |
FIX
-
NYSE
Comfort Systems USA
MATERIALS and CONSTRUCTION - General Contractors
|
$131.75
|
+1.19
0.91% |
$132.69
|
144,934
49.98% of 50 DAV
50 DAV is 290,000
|
$152.13
-13.40%
|
2/23/2023
|
$136.52
|
PP = $128.78
|
|
MB = $135.22
|
Most Recent Note - 4/11/2023 5:43:57 PM
G - Still sputtering near prior highs in the $128 area which are acting as support after damaging losses violated its 50 DMA line ($134.71) triggering a technical sell signal. Only a prompt rebound above the 50 DMA line would help its outlook improve. Fundamentals remain strong.
>>> FEATURED STOCK ARTICLE : Pullback With Higher Volume While Consolidating - 4/4/2023 |
View all notes |
Set NEW NOTE alert |
Company Profile |
SEC
News |
Chart |
Request a new note
C
A
S
I |
Symbol/Exchange
Company Name
Industry Group |
PRICE |
CHANGE
(%Change) |
Day High |
Volume
(% DAV)
(% 50 day avg vol) |
52 Wk Hi
% From Hi |
Featured
Date |
Price
Featured |
Pivot Featured |
|
Max Buy |
KOF
-
NYSE
Coca-Cola Femsa ADR
FOOD and BEVERAGE - Beverages - Soft Drinks
|
$83.71
|
+0.31
0.37% |
$83.88
|
149,753
80.95% of 50 DAV
50 DAV is 185,000
|
$84.55
-0.99%
|
3/7/2023
|
$76.63
|
PP = $77.11
|
|
MB = $80.97
|
Most Recent Note - 4/12/2023 5:20:22 PM
G - Hitting new all-time highs with a streak of 11 consecutive gains, getting extended from the prior base. On pullbacks, prior highs in the $79-$77 area define initial support to watch above its 50 DMA line ($75.66). See the latest FSU analysis for more details and a new annotated graph.
>>> FEATURED STOCK ARTICLE : Streak of 11 Straight Gains into New High Territory - 4/12/2023 |
View all notes |
Set NEW NOTE alert |
Company Profile |
SEC
News |
Chart |
Request a new note
C
A
S
I |
ANET
-
NYSE
Arista Networks
Computer-Networking
|
$164.79
|
+3.38
2.09% |
$165.23
|
1,668,043
61.76% of 50 DAV
50 DAV is 2,701,000
|
$171.44
-3.88%
|
3/8/2023
|
$147.59
|
PP = $148.67
|
|
MB = $156.10
|
 Most Recent Note - 4/13/2023 3:55:47 PM
G - Posting a 2nd small gain today with below-average volume. Very extended from any sound base after an impressive spurt of volume-driven gains. Prior highs in the $148-145 area define important support to watch along with its 50 DMA line ($149.51).
>>> FEATURED STOCK ARTICLE : Pulling Back After Getting Very Extended From Prior Base - 3/28/2023 |
View all notes |
Set NEW NOTE alert |
Company Profile |
SEC
News |
Chart |
Request a new note
C
A
S
I |
CLH
-
NYSE
Clean Harbors
Pollution Control
|
$143.63
|
+2.74
1.94% |
$143.79
|
281,111
64.92% of 50 DAV
50 DAV is 433,000
|
$144.20
-0.40%
|
3/10/2023
|
$136.89
|
PP = $136.74
|
|
MB = $143.58
|
Most Recent Note - 4/12/2023 5:22:48 PM
Y - Posted a 3rd consecutive gain today with below-average volume. Found prompt support near its 50 DMA line ($134.57). Below that important short-term average, the recent low ($129.93 on 3/24/23) defines the next important support where a violation would raise concerns and trigger a more worrisome technical sell signal. Fundamentals remain strong.
>>> FEATURED STOCK ARTICLE : Finding Support Recently at 50-Day Moving Average Line - 3/29/2023 |
View all notes |
Set NEW NOTE alert |
Company Profile |
SEC
News |
Chart |
Request a new note
C
A
S
I |
|
|
|
THESE ARE NOT BUY RECOMMENDATIONS!
Comments contained in the body of this report are technical
opinions only. The material herein has been obtained
from sources believed to be reliable and accurate, however,
its accuracy and completeness cannot be guaranteed.
This site is not an investment advisor, hence it does
not endorse or recommend any securities or other investments.
Any recommendation contained in this report may not
be suitable for all investors and it is not to be deemed
an offer or solicitation on our part with respect to
the purchase or sale of any securities. All trademarks,
service marks and trade names appearing in this report
are the property of their respective owners, and are
likewise used for identification purposes only.
This report is a service available
only to active Paid Premium Members.
You may opt-out of receiving report notifications
at any time. Questions or comments may be submitted
by writing to Premium Membership Services 665 S.E. 10 Street, Suite 201 Deerfield Beach, FL 33441-5634 or by calling 1-800-965-8307
or 954-785-1121.
|
|
|