You are not logged in.
This means you
CAN ONLY VIEW reports that were published prior to Thursday, April 17, 2025.
You
MUST UPGRADE YOUR MEMBERSHIP if you want to see any current reports.
AFTER MARKET UPDATE - THURSDAY, MARCH 30TH, 2023
Previous After Market Report Next After Market Report >>>
|
|
|
|
DOW |
+141.43 |
32,859.03 |
+0.43% |
|
Volume |
803,748,918 |
-11% |
|
Volume |
4,682,360,000 |
+4% |
|
NASDAQ |
+87.24 |
12,013.47 |
+0.73% |
|
Advancers |
2,041 |
70% |
|
Advancers |
2,364 |
54% |
|
S&P 500 |
+23.02 |
4,050.83 |
+0.57% |
|
Decliners |
884 |
30% |
|
Decliners |
2,038 |
46% |
|
Russell 2000 |
-3.22 |
1,768.38 |
-0.18% |
|
52 Wk Highs |
44 |
|
|
52 Wk Highs |
75 |
|
|
S&P 600 |
-1.03 |
1,159.56 |
-0.09% |
|
52 Wk Lows |
16 |
|
|
52 Wk Lows |
153 |
|
|
Wednesday's gains with higher volume and greater leadership marked a follow-through day confirming a new uptrend. New buying efforts may be made based on the (M criteria) of the fact-based investment system. Disciplined investors know to only buy stocks meeting all key criteria.
|
 |
Major Indices Notched Additional Gains
Kenneth J. Gruneisen - Passed the CAN SLIM® Master's Exam
The Dow added 141 points (0.4%) while the Nasdaq Composite increased 0.7%. The S&P 500 gained 0.6% as it looks to notch a three-week high. Volume totals reported were mixed, lighter than the prior session on the NYSE and higher on the Nasdaq exchange. Breadth was positive as advancers led decliners by more than a 2-1 margin on the NYSE and by a 6-5 margin on the Nasdaq exchange. There were 17 high-ranked companies from the Leaders List that hit a new 52-week high and were listed on the BreakOuts Page, versus the total of 14 on the prior session. There was an increase in new 52-week highs as they outnumbered new 52-week lows on the NYSE, and new highs also increased on the Nasdaq exchange but new 52-week lows still outnumbered them. The major indices are in a new confirmed uptrend (M criteria). Appropriate new buying efforts may be considered under the fact-based investment system.
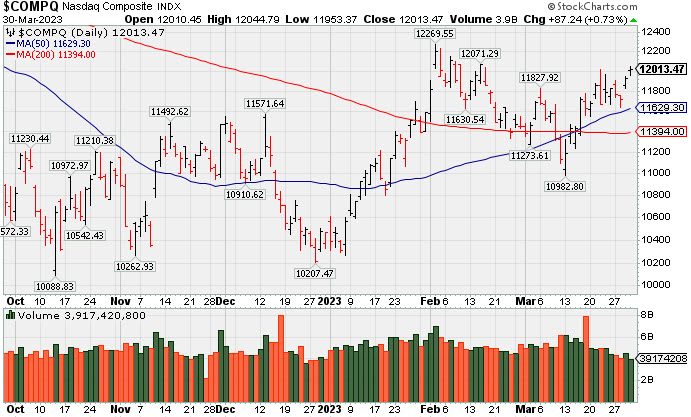
PICTURED: The Nasdaq Composite Index has posted 2 consecutive gains with higher volume (final volume total today is not reflected in graph). The prior session marked a solid follow-through day to confirm a new uptrend on Day 13 of the tech-heavy index's rally.
U.S. equities closed higher Thursday as investors bet the worst of the banking turmoil is over. The CBOE Volatility Index, Wall Street’s preferred measure of fear within the market over the next 30 days, has dropped below the 20 level after reaching its high of 30 during mid-March.
On the data front, initial jobless claims for the week ended March 25 came in at 198,000, up from the prior week’s 191,000 print. Continuing claims also saw an uptick for the week ended March 18 with 4,000 new claims. Meanwhile, the finalized fourth quarter reading of Gross Domestic Product came in relatively in-line with analyst expectations while personal consumption fell to 1% growth verses the 1.4% expected.
Treasuries finished mixed, with the yield on the benchmark 10-year note down two basis points (0.02%) to 3.55%, while the 30-year bond yield declined three basis points (0.03%) to 3.74%. The yield on the two-year note added two basis points (0.02%) to 4.11% as it heads for its biggest monthly drop since 2008. Over in the commodity pits, West Texas Intermediate (WTI) crude increased 1.9% to $74.32/barrel following a halt on exports from Iraq’s Kurdistan region while a drop in U.S. crude stockpiles further supported prices. Iraq was forced to stop around 450,000 barrels/day of semi-automated crude exports through a pipeline that runs from Kirkuk to the Turkey’s Ceyhan port. Exports were halted after an arbitration decision determined consent was needed from Baghdad before shipping. |
 Kenneth J. Gruneisen started out as a licensed stockbroker in August 1987, a couple of months prior to the historic stock market crash that took the Dow Jones Industrial Average down -22.6% in a single day. He has published daily fact-based fundamental and technical analysis on high-ranked stocks online for two decades. Through FACTBASEDINVESTING.COM, Kenneth provides educational articles, news, market commentary, and other information regarding proven investment systems that work in good times and bad.
Comments contained in the body of this report are technical opinions only and are not necessarily those of Gruneisen Growth Corp. The material herein has been obtained from sources believed to be reliable and accurate, however, its accuracy and completeness cannot be guaranteed. Our firm, employees, and customers may effect transactions, including transactions contrary to any recommendation herein, or have positions in the securities mentioned herein or options with respect thereto. Any recommendation contained in this report may not be suitable for all investors and it is not to be deemed an offer or solicitation on our part with respect to the purchase or sale of any securities. |
|
 |
Retail, Tech, and Gold & Silver Indexes Rose
Kenneth J. Gruneisen - Passed the CAN SLIM® Master's Exam
The Retail Index ($RLX +1.21%) posted a gain but the Bank Index ($BKX -1.22%) fell and the Broker/Dealer Index ($XBD -0.11%) was little changed. The Semiconductor Index ($SOX +1.62%) and Networking Index ($NWX +1.12%) both posted gains but the Biotech Index ($BTK -0.22%) inched lower. The Gold & Silver Index ($XAU +1.55%) posted a solid gain and the Integrated Oil Index ($XOI +0.37%) edged higher, but the Oil Services Index ($OSX -1.02%) lost ground.
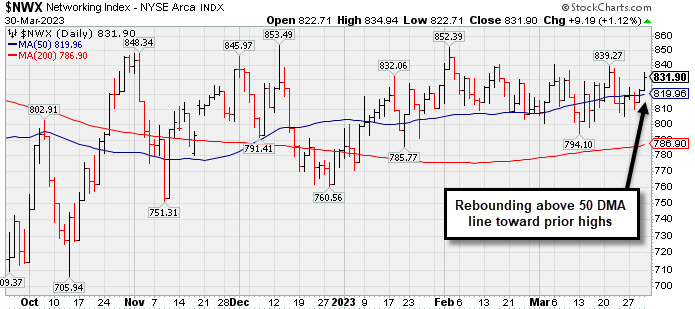
PICTURED: The Networking Index ($NWX +1.12%) recently rebounded above its 50-day moving average (DMA) line toward the prior highs.
| Oil Services |
$OSX |
78.13 |
-0.80 |
-1.02% |
-6.83% |
| Integrated Oil |
$XOI |
1,721.79 |
+6.33 |
+0.37% |
-3.66% |
| Semiconductor |
$SOX |
3,208.26 |
+51.15 |
+1.62% |
+26.70% |
| Networking |
$NWX |
831.90 |
+9.19 |
+1.12% |
+6.20% |
| Broker/Dealer |
$XBD |
455.63 |
-0.51 |
-0.11% |
+1.45% |
| Retail |
$RLX |
2,933.28 |
+35.13 |
+1.21% |
+6.51% |
| Gold & Silver |
$XAU |
132.01 |
+2.01 |
+1.55% |
+9.23% |
| Bank |
$BKX |
81.32 |
-1.00 |
-1.22% |
-19.37% |
| Biotech |
$BTK |
5,224.16 |
-11.48 |
-0.22% |
-1.08% |
|
|
|
 |
Featured Stocks
Kenneth J. Gruneisen - Passed the CAN SLIM® Master's Exam
|
|
|
Color Codes Explained :
Y - Better candidates highlighted by our
staff of experts.
G - Previously featured
in past reports as yellow but may no longer be buyable under the
guidelines.
***Last / Change / Volume data in this table is the closing quote data***
Symbol/Exchange
Company Name
Industry Group |
PRICE |
CHANGE
(%Change) |
Day High |
Volume
(% DAV)
(% 50 day avg vol) |
52 Wk Hi
% From Hi |
Featured
Date |
Price
Featured |
Pivot Featured |
|
Max Buy |
 GPK
-
NYSE
GPK
-
NYSE
Graphic Packaging
CONSUMER NON-DURABLES - Packaging and Containers
|
$25.26
|
+0.09
0.36% |
$25.45
|
2,000,513
59.72% of 50 DAV
50 DAV is 3,350,000
|
$25.45
-0.75%
|
10/25/2022
|
$22.75
|
PP = $24.17
|
|
MB = $25.38
|
 Most Recent Note - 3/30/2023 4:31:20 PM
Y - Posted a 6th consecutive gain today for a new all-time high with lighter volume, wedging up near its "max buy" level with gains lacking great volume conviction. Its 50 DMA line ($23.76) and recent low ($22.99 on 3/16/23) define important near-term support to watch.
>>> FEATURED STOCK ARTICLE : Found Encouraging Support Near 50-Day Moving Average Line - 3/21/2023 |
View all notes |
Set NEW NOTE alert |
Company Profile |
SEC
News |
Chart |
Request a new note
C
A
S
I |
STRL
-
NASDAQ
Sterling Infrastructure
MATERIALS and; CONSTRUCTION - Heavy Construction
|
$37.58
|
-0.42
-1.11% |
$38.49
|
160,804
57.02% of 50 DAV
50 DAV is 282,000
|
$42.00
-10.52%
|
12/14/2022
|
$32.41
|
PP = $33.72
|
|
MB = $35.41
|
Most Recent Note - 3/28/2023 3:44:01 PM
G - On track today for a 3rd consecutive small gain with below-average volume. Its 50 DMA line ($37.09) defines important near-term support to watch above recent lows in the mid-$36 area.
>>> FEATURED STOCK ARTICLE : Posting Quiet Gains Just Above 50-Day Moving Average Line - 3/20/2023 |
View all notes |
Set NEW NOTE alert |
Company Profile |
SEC
News |
Chart |
Request a new note
C
A
S
I |
PERI
-
NASDAQ
Perion Network
Comml Svcs-Advertising
|
$38.36
|
-0.24
-0.62% |
$39.40
|
493,386
63.09% of 50 DAV
50 DAV is 782,000
|
$39.54
-2.98%
|
1/25/2023
|
$31.79
|
PP = $33.19
|
|
MB = $34.85
|
Most Recent Note - 3/28/2023 3:42:27 PM
G - Pulling back today with light volume after hitting new all-time highs with 5 consecutive gains. Found support when recently consolidating above its 50 DMA line ($33.86) and the prior high ($33) which define important near-term support.
>>> FEATURED STOCK ARTICLE : Consolidating in an Orderly Manner Above Old High and 50 DMA Line - 3/15/2023 |
View all notes |
Set NEW NOTE alert |
Company Profile |
SEC
News |
Chart |
Request a new note
C
A
S
I |
ALGM
-
NASDAQ
Allegro MicroSystems
Elec-Semiconductor Mfg
|
$47.38
|
+0.72
1.54% |
$48.25
|
878,898
51.61% of 50 DAV
50 DAV is 1,703,000
|
$48.30
-1.90%
|
1/31/2023
|
$37.80
|
PP = $38.38
|
|
MB = $40.30
|
Most Recent Note - 3/30/2023 4:03:56 PM
G - Challenged the prior high today as it posted a 2nd consecutive gain with below-average volume. It is extended from the previously noted base. Its 50 DMA line ($42.52) and recent low ($41.30 on 3/18/23) define important near-term support to watch on pullbacks.
>>> FEATURED STOCK ARTICLE : Extended From Prior Base and Perched Near All-Time High - 3/22/2023 |
View all notes |
Set NEW NOTE alert |
Company Profile |
SEC
News |
Chart |
Request a new note
C
A
S
I |
FIX
-
NYSE
Comfort Systems USA
MATERIALS and CONSTRUCTION - General Contractors
|
$142.53
|
-1.43
-0.99% |
$145.47
|
388,070
152.78% of 50 DAV
50 DAV is 254,000
|
$152.13
-6.31%
|
2/23/2023
|
$136.52
|
PP = $128.78
|
|
MB = $135.22
|
Most Recent Note - 3/30/2023 4:29:07 PM
G - Pulled back today with heavier volume breaking a streak of 3 consecutive small gains. Consolidating well above its 50 DMA line ($132.15) and the prior high in the $128 area defining important support to watch. Fundamentals remain strong.
>>> FEATURED STOCK ARTICLE : Consolidating Above Support at Prior High and 50-Day Moving Average - 3/16/2023 |
View all notes |
Set NEW NOTE alert |
Company Profile |
SEC
News |
Chart |
Request a new note
C
A
S
I |
Symbol/Exchange
Company Name
Industry Group |
PRICE |
CHANGE
(%Change) |
Day High |
Volume
(% DAV)
(% 50 day avg vol) |
52 Wk Hi
% From Hi |
Featured
Date |
Price
Featured |
Pivot Featured |
|
Max Buy |
KOF
-
NYSE
Coca-Cola Femsa ADR
FOOD and BEVERAGE - Beverages - Soft Drinks
|
$80.03
|
+0.63
0.79% |
$81.10
|
231,018
129.06% of 50 DAV
50 DAV is 179,000
|
$80.95
-1.14%
|
3/7/2023
|
$76.63
|
PP = $77.11
|
|
MB = $80.97
|
Most Recent Note - 3/30/2023 12:43:30 PM
Y - Hitting another new all-time high and challenging its "max buy" level with today's 3rd consecutive gain backed by above-average volume. Gains above the pivot point must be backed by at least +40% above average volume to trigger a proper technical buy signal. It wedged higher with gains missing that volume threshold since highlighted in yellow with pivot point cited based on its 1/24/23 high plus 10 cents in the 3/07/23 mid-day report.
>>> FEATURED STOCK ARTICLE : Gain for Best-Ever Close With Near Average Volume - 3/24/2023 |
View all notes |
Set NEW NOTE alert |
Company Profile |
SEC
News |
Chart |
Request a new note
C
A
S
I |
ANET
-
NYSE
Arista Networks
Computer-Networking
|
$162.49
|
-0.01
-0.01% |
$163.90
|
2,740,667
103.58% of 50 DAV
50 DAV is 2,646,000
|
$171.44
-5.22%
|
3/8/2023
|
$147.59
|
PP = $148.67
|
|
MB = $156.10
|
Most Recent Note - 3/28/2023 12:37:52 PM
G - Gapped down today retreating from its all-time high. Very extended from any sound base after an impressive spurt of volume-driven gains. Prior highs in the $148-145 area define initial support to watch above its 50 DMA line ($138). Broader market weakness (M criteria) has been noted as a "correction" that has raised concerns.
>>> FEATURED STOCK ARTICLE : Pulling Back After Getting Very Extended From Prior Base - 3/28/2023 |
View all notes |
Set NEW NOTE alert |
Company Profile |
SEC
News |
Chart |
Request a new note
C
A
S
I |
CLH
-
NYSE
Clean Harbors
Pollution Control
|
$138.76
|
+3.61
2.67% |
$139.86
|
500,828
120.97% of 50 DAV
50 DAV is 414,000
|
$140.69
-1.37%
|
3/10/2023
|
$136.89
|
PP = $136.74
|
|
MB = $143.58
|
Most Recent Note - 3/30/2023 4:27:47 PM
Y - Volume was +21% above average today as it posted a 4th consecutive gain with ever-increasing volume for a best-ever close while challenging the recent high. Found prompt support near its 50 DMA line ($132.81). More damaging losses below the 50 DMA line and recent low ($129.93 on 3/24/23) would raise concerns and trigger technical sell signals. Fundamentals remain strong. See the latest FSU analysis for more details and an annotated graph.
>>> FEATURED STOCK ARTICLE : Finding Support Recently at 50-Day Moving Average Line - 3/29/2023 |
View all notes |
Set NEW NOTE alert |
Company Profile |
SEC
News |
Chart |
Request a new note
C
A
S
I |
|
|
|
THESE ARE NOT BUY RECOMMENDATIONS!
Comments contained in the body of this report are technical
opinions only. The material herein has been obtained
from sources believed to be reliable and accurate, however,
its accuracy and completeness cannot be guaranteed.
This site is not an investment advisor, hence it does
not endorse or recommend any securities or other investments.
Any recommendation contained in this report may not
be suitable for all investors and it is not to be deemed
an offer or solicitation on our part with respect to
the purchase or sale of any securities. All trademarks,
service marks and trade names appearing in this report
are the property of their respective owners, and are
likewise used for identification purposes only.
This report is a service available
only to active Paid Premium Members.
You may opt-out of receiving report notifications
at any time. Questions or comments may be submitted
by writing to Premium Membership Services 665 S.E. 10 Street, Suite 201 Deerfield Beach, FL 33441-5634 or by calling 1-800-965-8307
or 954-785-1121.
|
|
|