You are not logged in.
This means you
CAN ONLY VIEW reports that were published prior to Sunday, March 16, 2025.
You
MUST UPGRADE YOUR MEMBERSHIP if you want to see any current reports.
AFTER MARKET UPDATE - MONDAY, APRIL 3RD, 2023
Previous After Market Report Next After Market Report >>>
|
|
|
|
DOW |
+327.00 |
33,601.15 |
+0.98% |
|
Volume |
950,787,097 |
-20% |
|
Volume |
4,796,519,100 |
-12% |
|
NASDAQ |
-32.45 |
12,189.45 |
-0.27% |
|
Advancers |
1,514 |
52% |
|
Advancers |
2,149 |
48% |
|
S&P 500 |
+15.20 |
4,124.51 |
+0.37% |
|
Decliners |
1,424 |
48% |
|
Decliners |
2,348 |
52% |
|
Russell 2000 |
-0.17 |
1,802.31 |
-0.01% |
|
52 Wk Highs |
58 |
|
|
52 Wk Highs |
102 |
|
|
S&P 600 |
+0.64 |
1,182.31 |
+0.05% |
|
52 Wk Lows |
11 |
|
|
52 Wk Lows |
131 |
|
|
 |
Major Averages Ended Mixed With Less Leadership
Kenneth J. Gruneisen - Passed the CAN SLIM® Master's Exam
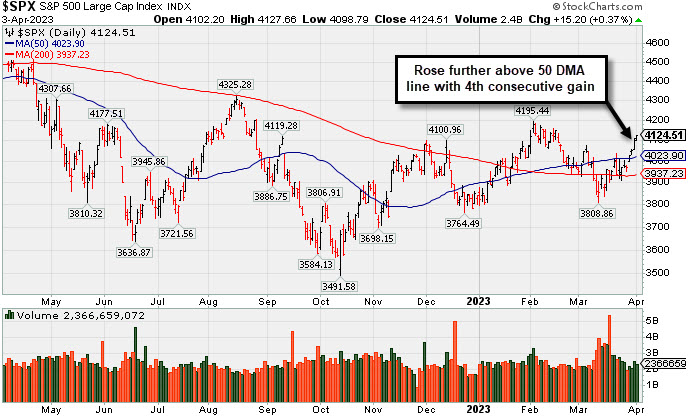
The Dow added 327 points (1%) while the Nasdaq Composite declined 0.3%. The S&P 500 gained 0.4%. Volume totals reported were lighter than the prior session on the NYSE and on the Nasdaq exchange, indicative of less buying demand from the institutional crowd. Breadth was fairly even as advancers led decliners by a narrow margin on the NYSE and decliners led advancers by a narrow margin on the Nasdaq exchange. There were 28 high-ranked companies from the Leaders List that hit a new 52-week high and were listed on the BreakOuts Page, versus the total of 49 on the prior session. New 52-week highs outnumbered new 52-week lows on the NYSE, but on the Nasdaq exchange new 52-week lows still outnumbered new highs. The major indices are in a new confirmed uptrend (M criteria). Appropriate new buying efforts may be considered under the fact-based investment system.
PICTURED: The S&P 500 Index posted 4th consecutive gain and rose further above its 50-day moving average (DMA) line.
Seven of the eleven sectors finished in positive territory as U.S. equities finished mixed on Monday. The second quarter of 2023 started with oil headlining the news. The Energy sector gained 4.9% as oil stocks surged following OPEC+’s (Organization of the Petroleum Exporting Countries and their allies) global production cuts.
On the data front, March’s finalized S&P Global U.S. Manufacturing Purchasing Managers’ Index was closely in line with expectations, coming in at 49.2. Meanwhile, March’s Institute for Supply Management (ISM) Manufacturing Index and ISM Manufacturing Prices Paid Index missed estimates, staying in contractionary territory at 46.3 and 49.2, respectively. March’s ISM Manufacturing Index notched its lowest level in nearly three years as demand continues to decline.
Treasuries strengthened, with the yield on the 10-year note down seven basis points (0.07%) to 3.41%, while the 30-year bond yield fell three basis points (0.03%) to 3.63%. The yield on the two-year note, which is more sensitive to changes in Federal Reserve policy, shed six basis points (0.06%) to 3.97%. In commodities, West Texas Intermediate (WTI) crude climbed 6.3% to $80.43/barrel as oil prices are on track for their largest gain in approximately a year. Today’s jump comes after OPEC+’s announcement to cut output by 1.16 million barrels per day. A handful of countries volunteered to start cuts in May through the end of 2023. Many analysts estimate this production cut may drive prices toward the $100 mark. In the metals complex, gold rallies 0.8% to its highest level in nearly a year as nervous investors seek a perceived safe haven.
|
 Kenneth J. Gruneisen started out as a licensed stockbroker in August 1987, a couple of months prior to the historic stock market crash that took the Dow Jones Industrial Average down -22.6% in a single day. He has published daily fact-based fundamental and technical analysis on high-ranked stocks online for two decades. Through FACTBASEDINVESTING.COM, Kenneth provides educational articles, news, market commentary, and other information regarding proven investment systems that work in good times and bad.
Comments contained in the body of this report are technical opinions only and are not necessarily those of Gruneisen Growth Corp. The material herein has been obtained from sources believed to be reliable and accurate, however, its accuracy and completeness cannot be guaranteed. Our firm, employees, and customers may effect transactions, including transactions contrary to any recommendation herein, or have positions in the securities mentioned herein or options with respect thereto. Any recommendation contained in this report may not be suitable for all investors and it is not to be deemed an offer or solicitation on our part with respect to the purchase or sale of any securities. |
|
 |
Energy-Linked Groups Rose as Financials and Techs Fell
Kenneth J. Gruneisen - Passed the CAN SLIM® Master's Exam
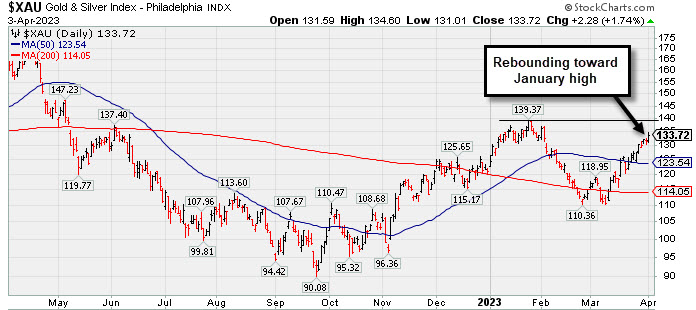
The Broker/Dealer Index ($XBD -1.84%) led the Bank Index ($BKX -0.55%) lower while the Retail Index ($RLX +0.09%) finished flat. The tech sectoi had a negative bias as the Semiconductor Index ($SOX -0.94%) and Networking Index ($NWX -0.64%) both lost ground while the Biotech Index ($BTK +0.17%) inched higher. The Oil Services Index ($OSX +6.09%) and Integrated Oil Index ($XOI +4.98%) both posted standout gains.
PICTURED: The Gold & Silver Index ($XAU +1.74%) is rebounding toward its January high.
| Oil Services |
$OSX |
83.65 |
+4.80 |
+6.09% |
-0.25% |
| Integrated Oil |
$XOI |
1,818.04 |
+86.24 |
+4.98% |
+1.72% |
| Semiconductor |
$SOX |
3,200.43 |
-30.44 |
-0.94% |
+26.39% |
| Networking |
$NWX |
846.18 |
-5.44 |
-0.64% |
+8.03% |
| Broker/Dealer |
$XBD |
453.09 |
-8.49 |
-1.84% |
+0.88% |
| Retail |
$RLX |
2,993.84 |
+2.70 |
+0.09% |
+8.71% |
| Gold & Silver |
$XAU |
133.72 |
+2.28 |
+1.74% |
+10.64% |
| Bank |
$BKX |
81.59 |
-0.45 |
-0.55% |
-19.10% |
| Biotech |
$BTK |
5,316.95 |
+9.24 |
+0.17% |
+0.68% |
|
|
|
 |
Featured Stocks
Kenneth J. Gruneisen - Passed the CAN SLIM® Master's Exam
|
|
|
Color Codes Explained :
Y - Better candidates highlighted by our
staff of experts.
G - Previously featured
in past reports as yellow but may no longer be buyable under the
guidelines.
***Last / Change / Volume data in this table is the closing quote data***
|
|
|
THESE ARE NOT BUY RECOMMENDATIONS!
Comments contained in the body of this report are technical
opinions only. The material herein has been obtained
from sources believed to be reliable and accurate, however,
its accuracy and completeness cannot be guaranteed.
This site is not an investment advisor, hence it does
not endorse or recommend any securities or other investments.
Any recommendation contained in this report may not
be suitable for all investors and it is not to be deemed
an offer or solicitation on our part with respect to
the purchase or sale of any securities. All trademarks,
service marks and trade names appearing in this report
are the property of their respective owners, and are
likewise used for identification purposes only.
This report is a service available
only to active Paid Premium Members.
You may opt-out of receiving report notifications
at any time. Questions or comments may be submitted
by writing to Premium Membership Services 665 S.E. 10 Street, Suite 201 Deerfield Beach, FL 33441-5634 or by calling 1-800-965-8307
or 954-785-1121.
|
|
|