You are not logged in.
This means you
CAN ONLY VIEW reports that were published prior to Monday, April 21, 2025.
You
MUST UPGRADE YOUR MEMBERSHIP if you want to see any current reports.
AFTER MARKET UPDATE - MONDAY, MARCH 27TH, 2023
Previous After Market Report Next After Market Report >>>
|
|
|
|
DOW |
+194.55 |
32,432.08 |
+0.60% |
|
Volume |
912,328,134 |
-7% |
|
Volume |
4,281,521,600 |
-0% |
|
NASDAQ |
-55.12 |
11,768.84 |
-0.47% |
|
Advancers |
2,168 |
74% |
|
Advancers |
2,593 |
58% |
|
S&P 500 |
+6.54 |
3,977.53 |
+0.16% |
|
Decliners |
761 |
26% |
|
Decliners |
1,887 |
42% |
|
Russell 2000 |
+18.75 |
1,753.67 |
+1.08% |
|
52 Wk Highs |
34 |
|
|
52 Wk Highs |
63 |
|
|
S&P 600 |
+11.68 |
1,151.91 |
+1.02% |
|
52 Wk Lows |
34 |
|
|
52 Wk Lows |
147 |
|
|
Recent commentaries have noted an ongoing "market correction". No new buying efforts are to be made based on the (M criteria) of the fact-based investment system. Disciplined investors know to reduce market exposure by selling any weakening stocks on a case-by-case basis.
|
 |
Breadth Positive While Major Indices Closed Mixed
Kenneth J. Gruneisen - Passed the CAN SLIM® Master's Exam
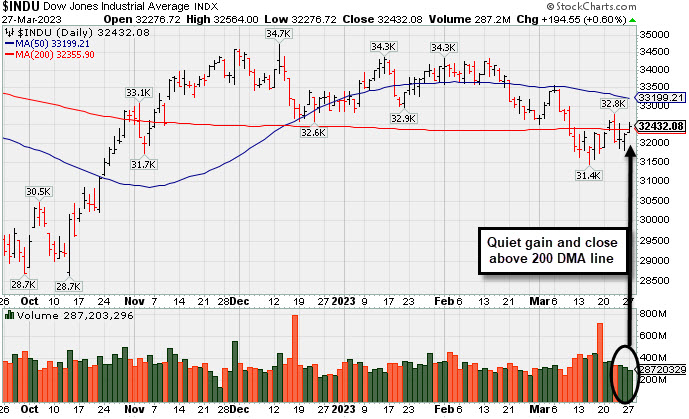
The Dow climbed 194 points (0.6%), while the S&P 500 added 0.2%. Meanwhile, the Nasdaq Composite fell 0.5%, weighed down by a rout in Technology shares. Volume totals reported were lighter than the prior session on the NYSE and near the prior total on the Nasdaq exchange. Breadth was positive as advancers led decliners by almost a 3-1 margin on the NYSE and by almost a 3-2 margin on the Nasdaq exchange. Leadership improved as there were 14 high-ranked companies from the Leaders List that hit a new 52-week high and were listed on the BreakOuts Page, versus the total of 6 on the prior session. New 52-week lows matched new 52-week highs on the NYSE while new lows outnumbered new highs on the Nasdaq exchange. The major indices are in a market correction (M criteria). Disciplined investors know that in a market correction it is best to avoid new buying efforts and raise safe cash.
PICTURED: The Dow Jones Industrial Average posted a 3rd consecutive small gain with light volume. Disciplined investors are watching for a solid follow-through day to confirm a new uptrend.
U.S. equities finished mixed Monday as concerns over potential contagion stemming from the recent banking crisis eased. Regional banks led shares higher today following a report which suggested U.S. authorities are weighing the possibility of expanding an emergency lending facility to allow First Republic Bank time to shore up its balance sheet.
On the data front, the Dallas Federal Reserve (Fed) Manufacturing Activity Index unexpectedly ticked lower in March, signaling economic activity is continuing to slow. In the central bank space, over the weekend, Minneapolis Fed President Neel Kashkari said the Fed is continuing to monitor the banking sector and indicated recent turmoil has brought the U.S. closer to a recession. Treasuries weakened, with the yield on the benchmark 10-year note up 13 basis points (0.13%) to 3.54%, while the 30-year bond yield climbed 13 basis points (0.13%) to 3.77%. The yield on the two-year note, which is more sensitive to changes in Fed policy, advanced 25 basis points (0.25%) to 4.02%. In commodities, West Texas Intermediate (WTI) crude jumped 5.4% to $73.02/barrel following news Iraq was forced to halt some of its crude exports out of the Kurdistan region following an arbitration case ruling which said Iraq’s consent was required to ship the oil from Turkey. Also buoying prices was reports Russian President Vladimir Putin is planning to station nuclear weapons in Belarus.
|
 Kenneth J. Gruneisen started out as a licensed stockbroker in August 1987, a couple of months prior to the historic stock market crash that took the Dow Jones Industrial Average down -22.6% in a single day. He has published daily fact-based fundamental and technical analysis on high-ranked stocks online for two decades. Through FACTBASEDINVESTING.COM, Kenneth provides educational articles, news, market commentary, and other information regarding proven investment systems that work in good times and bad.
Comments contained in the body of this report are technical opinions only and are not necessarily those of Gruneisen Growth Corp. The material herein has been obtained from sources believed to be reliable and accurate, however, its accuracy and completeness cannot be guaranteed. Our firm, employees, and customers may effect transactions, including transactions contrary to any recommendation herein, or have positions in the securities mentioned herein or options with respect thereto. Any recommendation contained in this report may not be suitable for all investors and it is not to be deemed an offer or solicitation on our part with respect to the purchase or sale of any securities. |
|
 |
Financial and Energy-Linked Groups Led Gainers
Kenneth J. Gruneisen - Passed the CAN SLIM® Master's Exam
Financial shares posted influential gains on Monday as the Broker/Dealer Index ($XBD +1.75%) and Bank Index ($BKX +2.54%) both rose. Energy-linked groups also posted standout gains as the Oil Services Index ($OSX +4.32%) and Integrated Oil Index ($XOI +2.54%) both rose. The Gold & Silver Index ($XAU +0.21%) inched higher. The Retail Index ($RLX +0.06%) finished flat while the Networking Index ($NWX +0.14%) and Biotech Index ($BTK +0.44%) both edged higher, meanwhile, the Semiconductor Index ($SOX -1.21%) was a standout decliner.
PICTURED: The Integrated Oil Index ($XOI +2.54%) posted a solid gain rebounding toward its 200-day moving average (DMA) line. The recent low defines near-term support to watch above its September 2022 low.
| Oil Services |
$OSX |
75.86 |
+3.14 |
+4.32% |
-9.54% |
| Integrated Oil |
$XOI |
1,660.43 |
+41.14 |
+2.54% |
-7.10% |
| Semiconductor |
$SOX |
3,083.57 |
-37.69 |
-1.21% |
+21.78% |
| Networking |
$NWX |
819.80 |
+1.13 |
+0.14% |
+4.66% |
| Broker/Dealer |
$XBD |
448.16 |
+7.73 |
+1.75% |
-0.22% |
| Retail |
$RLX |
2,848.34 |
+1.73 |
+0.06% |
+3.43% |
| Gold & Silver |
$XAU |
127.29 |
+0.26 |
+0.21% |
+5.32% |
| Bank |
$BKX |
80.38 |
+1.99 |
+2.54% |
-20.30% |
| Biotech |
$BTK |
5,154.10 |
+22.54 |
+0.44% |
-2.40% |
|
|
|
 |
Featured Stocks
Kenneth J. Gruneisen - Passed the CAN SLIM® Master's Exam
|
|
|
Color Codes Explained :
Y - Better candidates highlighted by our
staff of experts.
G - Previously featured
in past reports as yellow but may no longer be buyable under the
guidelines.
***Last / Change / Volume data in this table is the closing quote data***
Symbol/Exchange
Company Name
Industry Group |
PRICE |
CHANGE
(%Change) |
Day High |
Volume
(% DAV)
(% 50 day avg vol) |
52 Wk Hi
% From Hi |
Featured
Date |
Price
Featured |
Pivot Featured |
|
Max Buy |
 GPK
-
NYSE
GPK
-
NYSE
Graphic Packaging
CONSUMER NON-DURABLES - Packaging and Containers
|
$24.82
|
+0.38
1.55% |
$24.95
|
2,514,339
75.80% of 50 DAV
50 DAV is 3,317,000
|
$25.17
-1.39%
|
10/25/2022
|
$22.75
|
PP = $24.17
|
|
MB = $25.38
|
 Most Recent Note - 3/27/2023 6:05:39 PM
Y - Posted a 3rd consecutive gain today with lighter volume, wedging back above the noted pivot point. Its 50 DMA line ($23.59) and recent low ($22.99 on 3/16/23) define important near-term support to watch. More damaging losses would raise greater concerns and trigger a technical sell signal.
>>> FEATURED STOCK ARTICLE : Found Encouraging Support Near 50-Day Moving Average Line - 3/21/2023 |
View all notes |
Set NEW NOTE alert |
Company Profile |
SEC
News |
Chart |
Request a new note
C
A
S
I |
STRL
-
NASDAQ
Sterling Infrastructure
MATERIALS and; CONSTRUCTION - Heavy Construction
|
$38.42
|
+0.39
1.03% |
$38.87
|
160,369
55.88% of 50 DAV
50 DAV is 287,000
|
$42.00
-8.52%
|
12/14/2022
|
$32.41
|
PP = $33.72
|
|
MB = $35.41
|
Most Recent Note - 3/23/2023 5:23:52 PM
G - Pulled back today for a 2nd consecutive loss with below-average volume. Its 50 DMA line ($36.79) defines important near-term support to watch.
>>> FEATURED STOCK ARTICLE : Posting Quiet Gains Just Above 50-Day Moving Average Line - 3/20/2023 |
View all notes |
Set NEW NOTE alert |
Company Profile |
SEC
News |
Chart |
Request a new note
C
A
S
I |
PERI
-
NASDAQ
Perion Network
Comml Svcs-Advertising
|
$39.10
|
+0.82
2.14% |
$39.54
|
814,063
103.83% of 50 DAV
50 DAV is 784,000
|
$39.53
-1.09%
|
1/25/2023
|
$31.79
|
PP = $33.19
|
|
MB = $34.85
|
Most Recent Note - 3/27/2023 6:06:56 PM
G - Perched at its all-time high with today's 5th consecutive gain. Found support when recently consolidating above its 50 DMA line ($33.69) and the prior high ($33) which define important near-term support.
>>> FEATURED STOCK ARTICLE : Consolidating in an Orderly Manner Above Old High and 50 DMA Line - 3/15/2023 |
View all notes |
Set NEW NOTE alert |
Company Profile |
SEC
News |
Chart |
Request a new note
C
A
S
I |
ALGM
-
NASDAQ
Allegro MicroSystems
Elec-Semiconductor Mfg
|
$46.12
|
-0.22
-0.47% |
$47.38
|
1,156,882
67.77% of 50 DAV
50 DAV is 1,707,000
|
$48.30
-4.51%
|
1/31/2023
|
$37.80
|
PP = $38.38
|
|
MB = $40.30
|
Most Recent Note - 3/23/2023 5:29:25 PM
G - Posted a gain today with +20% above average volume for a new all-time high. Wedging higher and getting more extended from the previously noted base. Its 50 DMA line ($41.24) defines initial support above the prior high in the $38 area. See the latest FSU analysis for more details and an annotated graph.
>>> FEATURED STOCK ARTICLE : Extended From Prior Base and Perched Near All-Time High - 3/22/2023 |
View all notes |
Set NEW NOTE alert |
Company Profile |
SEC
News |
Chart |
Request a new note
C
A
S
I |
FIX
-
NYSE
Comfort Systems USA
MATERIALS and CONSTRUCTION - General Contractors
|
$139.71
|
+1.82
1.32% |
$141.45
|
160,411
62.91% of 50 DAV
50 DAV is 255,000
|
$152.13
-8.16%
|
2/23/2023
|
$136.52
|
PP = $128.78
|
|
MB = $135.22
|
Most Recent Note - 3/23/2023 5:30:58 PM
G - Consolidating well above its 50 DMA line ($130) and the prior high in the $128 area defining important support to watch. Fundamentals remain strong.
>>> FEATURED STOCK ARTICLE : Consolidating Above Support at Prior High and 50-Day Moving Average - 3/16/2023 |
View all notes |
Set NEW NOTE alert |
Company Profile |
SEC
News |
Chart |
Request a new note
C
A
S
I |
Symbol/Exchange
Company Name
Industry Group |
PRICE |
CHANGE
(%Change) |
Day High |
Volume
(% DAV)
(% 50 day avg vol) |
52 Wk Hi
% From Hi |
Featured
Date |
Price
Featured |
Pivot Featured |
|
Max Buy |
KOF
-
NYSE
Coca-Cola Femsa ADR
FOOD and BEVERAGE - Beverages - Soft Drinks
|
$78.45
|
-0.21
-0.27% |
$79.61
|
159,517
91.15% of 50 DAV
50 DAV is 175,000
|
$79.35
-1.13%
|
3/7/2023
|
$76.63
|
PP = $77.11
|
|
MB = $80.97
|
Most Recent Note - 3/27/2023 6:09:09 PM
Y - Touched a new all-time high today but reversed into the red for a small loss with light volume. Highlighted in yellow with pivot point cited based on its 1/24/23 high plus 10 cents in the 3/07/23 mid-day report. Gains above the pivot point must be backed by at least +40% above average volume to trigger a proper technical buy signal.
>>> FEATURED STOCK ARTICLE : Gain for Best-Ever Close With Near Average Volume - 3/24/2023 |
View all notes |
Set NEW NOTE alert |
Company Profile |
SEC
News |
Chart |
Request a new note
C
A
S
I |
ANET
-
NYSE
Arista Networks
Computer-Networking
|
$167.96
|
-0.98
-0.58% |
$171.13
|
1,942,596
75.09% of 50 DAV
50 DAV is 2,587,000
|
$171.44
-2.03%
|
3/8/2023
|
$147.59
|
PP = $148.67
|
|
MB = $156.10
|
Most Recent Note - 3/23/2023 5:30:22 PM
G - Hit another new all-time high today. Very extended from any sound base after an impressive spurt of volume-driven gains. Prior highs in the $148-145 area define initial support to watch above its 50 DMA line ($136.91). Broader market weakness (M criteria) has been noted as a "correction" that has raised concerns.
>>> FEATURED STOCK ARTICLE : Arista Challenging All-Time High - 3/8/2023 |
View all notes |
Set NEW NOTE alert |
Company Profile |
SEC
News |
Chart |
Request a new note
C
A
S
I |
CLH
-
NYSE
Clean Harbors
Pollution Control
|
$132.28
|
+1.17
0.89% |
$134.44
|
342,332
84.53% of 50 DAV
50 DAV is 405,000
|
$140.69
-5.98%
|
3/10/2023
|
$136.89
|
PP = $136.74
|
|
MB = $143.58
|
Most Recent Note - 3/27/2023 6:07:59 PM
Y - Posted a gain today with below-average volume. Fundamentals remain strong. Its 50 DMA line ($131.99) defines important near-term support to watch.
>>> FEATURED STOCK ARTICLE : Pullback to Support Marked Secondary Buy Point; Market Concerns Rose - 3/10/2023 |
View all notes |
Set NEW NOTE alert |
Company Profile |
SEC
News |
Chart |
Request a new note
C
A
S
I |
|
|
|
THESE ARE NOT BUY RECOMMENDATIONS!
Comments contained in the body of this report are technical
opinions only. The material herein has been obtained
from sources believed to be reliable and accurate, however,
its accuracy and completeness cannot be guaranteed.
This site is not an investment advisor, hence it does
not endorse or recommend any securities or other investments.
Any recommendation contained in this report may not
be suitable for all investors and it is not to be deemed
an offer or solicitation on our part with respect to
the purchase or sale of any securities. All trademarks,
service marks and trade names appearing in this report
are the property of their respective owners, and are
likewise used for identification purposes only.
This report is a service available
only to active Paid Premium Members.
You may opt-out of receiving report notifications
at any time. Questions or comments may be submitted
by writing to Premium Membership Services 665 S.E. 10 Street, Suite 201 Deerfield Beach, FL 33441-5634 or by calling 1-800-965-8307
or 954-785-1121.
|
|
|