You are not logged in.
This means you
CAN ONLY VIEW reports that were published prior to Thursday, April 17, 2025.
You
MUST UPGRADE YOUR MEMBERSHIP if you want to see any current reports.
AFTER MARKET UPDATE - FRIDAY, MARCH 17TH, 2023
Previous After Market Report Next After Market Report >>>
|
|
|
|
DOW |
-384.57 |
31,861.98 |
-1.19% |
|
Volume |
3,926,633,900 |
+211% |
|
Volume |
7,779,592,600 |
+43% |
|
NASDAQ |
-86.76 |
11,630.51 |
-0.74% |
|
Advancers |
474 |
17% |
|
Advancers |
1,184 |
27% |
|
S&P 500 |
-43.64 |
3,916.64 |
-1.10% |
|
Decliners |
2,342 |
83% |
|
Decliners |
3,247 |
73% |
|
Russell 2000 |
-45.35 |
1,725.89 |
-2.56% |
|
52 Wk Highs |
13 |
|
|
52 Wk Highs |
35 |
|
|
S&P 600 |
-32.19 |
1,133.88 |
-2.76% |
|
52 Wk Lows |
199 |
|
|
52 Wk Lows |
342 |
|
|
Recent commentaries have noted an ongoing "market correction". No new buying efforts are to be made based on the (M criteria) of the fact-based investment system. Disciplined investors know to reduce market exposure by selling any weakening stocks on a case-by-case basis.
|
 |
Breadth Negative as Market Correction Brings More Damage
Kenneth J. Gruneisen - Passed the CAN SLIM® Master's Exam
The Dow shed 384 points (1.2%) while the Nasdaq Composite slid 0.7%. The S&P 500 shed 1.1% with all sectors finishing in negative territory. For the week, the Dow fell 0.2%, while the Nasdaq Composite and S&P 500 climbed 4.4% and 1.5%, respectively. Volume totals were higher than the prior session on the NYSE and on the Nasdaq exchange, inflated by options expirations, and indicating heavier selling coming from the institutional crowd. Breadth was clearly negative as decliners led advancers by almost a 5-1 margin on the NYSE and by nearly 3-1 on the Nasdaq exchange. There were 7 high-ranked companies from the Leaders List that hit a new 52-week high and were listed on the BreakOuts Page, versus 9 on the prior session. New 52-week lows totals expanded and soldly outnumbered shrinking new 52-week highs totals on the NYSE and on the Nasdaq exchange. The major indices are in a market correction (M criteria). Disciplined investors know that in a market correction it is best to avoid new buying efforts and raise safe cash.
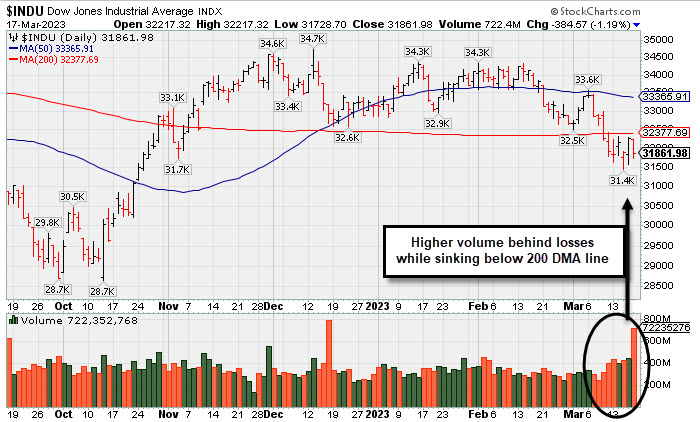
PICTURED: The Dow Jones Industrial Average had higher volume behind losses while sinking below its 200-day moving average (DMA) line. The October low defines the next important chart support levels to watch as the market correction continues. Disciplined investors are watching for a solid follow-through day to confirm a new uptrend.
U.S. equities finished lower Friday amid continuing worries over the state of the banking sector. Investors were nervous heading into the weekend as they tried to assess how this week’s events will impact the economy. Next week, the Federal Reserve (Fed) is scheduled to have a monetary policy meeting, and traders speculated whether they will hike rates or pause due to the uncertainty.
On the data front, a preliminary reading for the University of Michigan Consumer Sentiment Index showed sentiment ticked lower in March, reflecting consumer uncertainty over the economic outlook. Meanwhile, the short-term inflation expectations component of the report eased to 3.8%, while the long-term expectations component ticked lower to 2.8%. Treasuries strengthened, with the yield on the benchmark 10-year note shedding 15 basis points (0.15%) to 3.42%, while the 30-year bond yield dipped 10 basis points (0.10%) to 3.61%. The yield on the two-year note, which is more sensitive to changes in Fed policy, slid 31 basis points (0.31%) to 3.85%. Over in the commodity pits, West Texas Intermediate (WTI) crude fell 3.1% to $66.24/barrel to hover near a 15-month low amid concerns over the economic outlook. For the week, the domestic benchmark tumbled 13.4%.
|
 Kenneth J. Gruneisen started out as a licensed stockbroker in August 1987, a couple of months prior to the historic stock market crash that took the Dow Jones Industrial Average down -22.6% in a single day. He has published daily fact-based fundamental and technical analysis on high-ranked stocks online for two decades. Through FACTBASEDINVESTING.COM, Kenneth provides educational articles, news, market commentary, and other information regarding proven investment systems that work in good times and bad.
Comments contained in the body of this report are technical opinions only and are not necessarily those of Gruneisen Growth Corp. The material herein has been obtained from sources believed to be reliable and accurate, however, its accuracy and completeness cannot be guaranteed. Our firm, employees, and customers may effect transactions, including transactions contrary to any recommendation herein, or have positions in the securities mentioned herein or options with respect thereto. Any recommendation contained in this report may not be suitable for all investors and it is not to be deemed an offer or solicitation on our part with respect to the purchase or sale of any securities. |
|
 |
Financial and Energy Indexes Sank; Gold & Silver Index Rallied
Kenneth J. Gruneisen - Passed the CAN SLIM® Master's Exam
The Bank Index ($BKX -5.25%) was a standout decliner on Friday, creating a big drag on the major averages. The Broker/Dealer Index ($XBD -2.18%) also sank and the Retail Index ($RLX -0.91%) edged lower. Commodity-linked groups were mixed as the Gold & Silver Index ($XAU +4.83%) posted a standout gain while the Oil Services Index ($OSX -2.98%) and Integrated Oil Index ($XOI -1.47%) both lost ground. The Biotech Index ($BTK -2.17%) led the tech sector's retreat while the Networking Index ($NWX -1.22%) also lost gound.
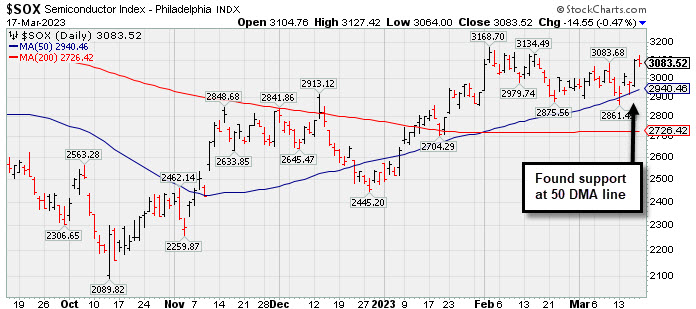
PICTURED: The Semiconductor Index ($SOX -0.47%) ended the session lower. This week it found support at its 50-day moving average (DMA) line.
| Oil Services |
$OSX |
72.43 |
-2.23 |
-2.98% |
-13.63% |
| Integrated Oil |
$XOI |
1,592.89 |
-23.74 |
-1.47% |
-10.87% |
| Semiconductor |
$SOX |
3,083.52 |
-14.55 |
-0.47% |
+21.78% |
| Networking |
$NWX |
816.05 |
-10.06 |
-1.22% |
+4.18% |
| Broker/Dealer |
$XBD |
443.27 |
-9.86 |
-2.18% |
-1.30% |
| Retail |
$RLX |
2,878.72 |
-26.49 |
-0.91% |
+4.53% |
| Gold & Silver |
$XAU |
123.86 |
+5.71 |
+4.83% |
+2.49% |
| Bank |
$BKX |
78.80 |
-4.37 |
-5.25% |
-21.86% |
| Biotech |
$BTK |
5,105.47 |
-113.37 |
-2.17% |
-3.33% |
|
|
|
 |
Featured Stocks
Kenneth J. Gruneisen - Passed the CAN SLIM® Master's Exam
|
|
|
Color Codes Explained :
Y - Better candidates highlighted by our
staff of experts.
G - Previously featured
in past reports as yellow but may no longer be buyable under the
guidelines.
***Last / Change / Volume data in this table is the closing quote data***
Symbol/Exchange
Company Name
Industry Group |
PRICE |
CHANGE
(%Change) |
Day High |
Volume
(% DAV)
(% 50 day avg vol) |
52 Wk Hi
% From Hi |
Featured
Date |
Price
Featured |
Pivot Featured |
|
Max Buy |
 GPK
-
NYSE
GPK
-
NYSE
Graphic Packaging Hldg
CONSUMER NON-DURABLES - Packaging and Containers
|
$23.31
|
-0.34
-1.44% |
$23.87
|
2,812,822
85.97% of 50 DAV
50 DAV is 3,272,000
|
$25.17
-7.39%
|
10/25/2022
|
$22.75
|
PP = $24.17
|
|
MB = $25.38
|
Most Recent Note - 3/15/2023 5:46:25 PM
Y - Sputtering below the noted pivot point and testing support at its 50 DMA line ($23.32) with today's volume-driven loss. More damaging losses would raise greater concerns and trigger a technical sell signal. Broader market weakness (M criteria) has been noted as a "correction" that has raised concerns.
>>> FEATURED STOCK ARTICLE : Quietly Lingering Near High With Strong Fundamentals - 2/27/2023 |
View all notes |
Set NEW NOTE alert |
Company Profile |
SEC
News |
Chart |
Request a new note
C
A
S
I |
STRL
-
NASDAQ
Sterling Infrastructure
MATERIALS and; CONSTRUCTION - Heavy Construction
|
$36.93
|
-1.04
-2.74% |
$37.93
|
483,869
169.18% of 50 DAV
50 DAV is 286,000
|
$42.00
-12.07%
|
12/14/2022
|
$32.41
|
PP = $33.72
|
|
MB = $35.41
|
Most Recent Note - 3/15/2023 12:48:30 PM
G - Abruptly slumping further from its all-time high with today's big loss. Its 50 DMA line ($36.13) and prior highs in the $34-33 area define important near-term support to watch.
>>> FEATURED STOCK ARTICLE : Sterling Perched Near High, Extended From Prior Base - 2/24/2023 |
View all notes |
Set NEW NOTE alert |
Company Profile |
SEC
News |
Chart |
Request a new note
C
A
S
I |
PERI
-
NASDAQ
Perion Networks Ltd
Comml Svcs-Advertising
|
$35.50
|
+0.04
0.11% |
$35.59
|
459,115
59.94% of 50 DAV
50 DAV is 766,000
|
$37.18
-4.52%
|
1/25/2023
|
$31.79
|
PP = $33.19
|
|
MB = $34.85
|
Most Recent Note - 3/15/2023 5:42:23 PM
Y - A spurt of losses has been backed by below average volume while consolidating above its 50 DMA line ($32.28) and the prior high ($33) which define important near-term support. See the latest FSU analysis for more details and a new annotated graph.
>>> FEATURED STOCK ARTICLE : Consolidating in an Orderly Manner Above Old High and 50 DMA Line - 3/15/2023 |
View all notes |
Set NEW NOTE alert |
Company Profile |
SEC
News |
Chart |
Request a new note
C
A
S
I |
ALGM
-
NASDAQ
Allegro Microsystems Inc
Elec-Semiconductor Mfg
|
$45.10
|
-0.93
-2.02% |
$46.46
|
2,755,200
173.39% of 50 DAV
50 DAV is 1,589,000
|
$47.67
-5.39%
|
1/31/2023
|
$37.80
|
PP = $38.38
|
|
MB = $40.30
|
Most Recent Note - 3/14/2023 1:09:51 PM
G - Posting a solid gain today after another noted "negative reversal" and 3 volume-driven losses from its all-time high. It is extended from the previously noted base. Its 50 DMA line ($39) and prior high in the $38 area define important support to watch on pullbacks.
>>> FEATURED STOCK ARTICLE : Holding its Ground After Rallying From Previously Noted Base - 3/1/2023 |
View all notes |
Set NEW NOTE alert |
Company Profile |
SEC
News |
Chart |
Request a new note
C
A
S
I |
FIX
-
NYSE
Comfort Systems U S A
MATERIALS and CONSTRUCTION - General Contractors
|
$134.43
|
-4.59
-3.30% |
$137.74
|
821,560
345.19% of 50 DAV
50 DAV is 238,000
|
$152.13
-11.63%
|
2/23/2023
|
$136.52
|
PP = $128.78
|
|
MB = $135.22
|
Most Recent Note - 3/16/2023 6:02:54 PM
G - Consolidating above the prior high in the $128 area and its 50 DMA line ($127.65) defining important support to watch. Fundamentals remain strong. See the latest FSU analysis for more details and a new annotated graph.
>>> FEATURED STOCK ARTICLE : Consolidating Above Support at Prior High and 50-Day Moving Average - 3/16/2023 |
View all notes |
Set NEW NOTE alert |
Company Profile |
SEC
News |
Chart |
Request a new note
C
A
S
I |
Symbol/Exchange
Company Name
Industry Group |
PRICE |
CHANGE
(%Change) |
Day High |
Volume
(% DAV)
(% 50 day avg vol) |
52 Wk Hi
% From Hi |
Featured
Date |
Price
Featured |
Pivot Featured |
|
Max Buy |
KOF
-
NYSE
Coca Cola Femsa Sab Ads
FOOD and BEVERAGE - Beverages - Soft Drinks
|
$74.62
|
-0.96
-1.27% |
$75.45
|
103,836
60.72% of 50 DAV
50 DAV is 171,000
|
$79.16
-5.74%
|
3/7/2023
|
$76.63
|
PP = $77.11
|
|
MB = $80.97
|
Most Recent Note - 3/14/2023 1:19:27 PM
Y - Still perched near its 52-week high after 3 losses with near average volume. Highlighted in yellow with pivot point cited based on its 1/24/23 high plus 10 cents in the 3/07/23 mid-day report. Gains above the pivot point must be backed by at least +40% above average volume to trigger a proper technical buy signal.
>>> FEATURED STOCK ARTICLE : Mexican Coke Bottler Hits New Multi-Year High - 3/7/2023 |
View all notes |
Set NEW NOTE alert |
Company Profile |
SEC
News |
Chart |
Request a new note
C
A
S
I |
ANET
-
NYSE
"Arista Networks, Inc"
Computer-Networking
|
$163.26
|
+0.58
0.36% |
$164.24
|
4,640,884
185.55% of 50 DAV
50 DAV is 2,501,100
|
$164.26
-0.61%
|
3/8/2023
|
$147.59
|
PP = $148.67
|
|
MB = $156.10
|
Most Recent Note - 3/16/2023 12:25:06 PM
Y - Powering into new all-time high territory with today's big gain adding to recent volume-driven gains. Highlighted in yellow in the 3/08/23 mid-day report with pivot point cited based on its 12/27/21 high plus 10 cents. Fundamentals remain strong after it reported Dec '22 quarterly earnings +72% on +55% sales revenues versus the year-ago period. Broader market weakness (M criteria) has been noted as a "correction" that has raised concerns.
>>> FEATURED STOCK ARTICLE : Arista Challenging All-Time High - 3/8/2023 |
View all notes |
Set NEW NOTE alert |
Company Profile |
SEC
News |
Chart |
Request a new note
C
A
S
I |
CLH
-
NYSE
Clean Harbors Inc
Pollution Control
|
$134.32
|
-1.66
-1.22% |
$136.57
|
745,239
194.58% of 50 DAV
50 DAV is 383,000
|
$140.69
-4.53%
|
3/10/2023
|
$136.89
|
PP = $136.74
|
|
MB = $143.58
|
Most Recent Note - 3/15/2023 5:44:31 PM
Y - Suffered another volume-driven loss today, slumping after a noted "negative reversal" on 3/09/23 at an all-time high. Fundamentals remain strong. Its 50 DMA line ($129) defines important near-term support to watch.
>>> FEATURED STOCK ARTICLE : Pullback to Support Marked Secondary Buy Point; Market Concerns Rose - 3/10/2023 |
View all notes |
Set NEW NOTE alert |
Company Profile |
SEC
News |
Chart |
Request a new note
C
A
S
I |
|
|
|
THESE ARE NOT BUY RECOMMENDATIONS!
Comments contained in the body of this report are technical
opinions only. The material herein has been obtained
from sources believed to be reliable and accurate, however,
its accuracy and completeness cannot be guaranteed.
This site is not an investment advisor, hence it does
not endorse or recommend any securities or other investments.
Any recommendation contained in this report may not
be suitable for all investors and it is not to be deemed
an offer or solicitation on our part with respect to
the purchase or sale of any securities. All trademarks,
service marks and trade names appearing in this report
are the property of their respective owners, and are
likewise used for identification purposes only.
This report is a service available
only to active Paid Premium Members.
You may opt-out of receiving report notifications
at any time. Questions or comments may be submitted
by writing to Premium Membership Services 665 S.E. 10 Street, Suite 201 Deerfield Beach, FL 33441-5634 or by calling 1-800-965-8307
or 954-785-1121.
|
|
|