You are not logged in.
This means you
CAN ONLY VIEW reports that were published prior to Sunday, March 30, 2025.
You
MUST UPGRADE YOUR MEMBERSHIP if you want to see any current reports.
AFTER MARKET UPDATE - WEDNESDAY, JANUARY 19TH, 2022
Previous After Market Report Next After Market Report >>>
|
|
|
|
DOW |
-339.82 |
35,028.65 |
-0.96% |
|
Volume |
942,101,686 |
-10% |
|
Volume |
4,590,839,300 |
-8% |
|
NASDAQ |
-166.64 |
14,340.26 |
-1.15% |
|
Advancers |
1,008 |
31% |
|
Advancers |
1,498 |
33% |
|
S&P 500 |
-44.35 |
4,532.76 |
-0.97% |
|
Decliners |
2,254 |
69% |
|
Decliners |
3,009 |
67% |
|
Russell 2000 |
-33.44 |
2,062.78 |
-1.60% |
|
52 Wk Highs |
50 |
|
|
52 Wk Highs |
38 |
|
|
S&P 600 |
-23.50 |
1,380.60 |
-1.67% |
|
52 Wk Lows |
312 |
|
|
52 Wk Lows |
769 |
|
|
Damaging losses for the major averages with higher volume on Tuesday signaled a more serious "market correction" taking hold (M criteria). Greater caution is advised until strength returns. Disciplined investors know to avoid new buying efforts and to raise cash by selling faltering stocks on a case-by-case basis.
|
 |
Major Averages Fell With Lighter Volume Totals
Kenneth J. Gruneisen - Passed the CAN SLIM® Master's Exam
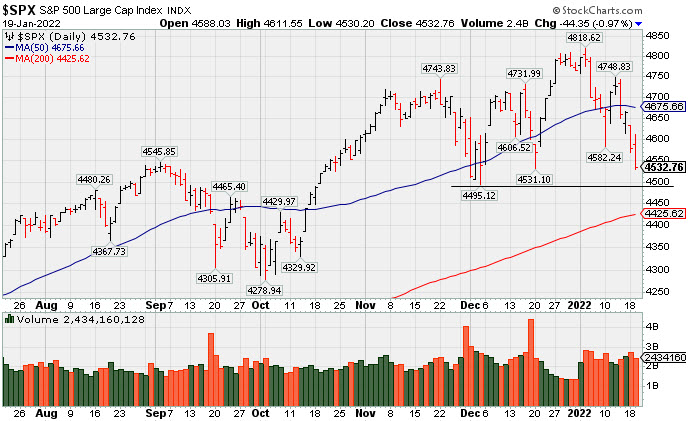
The S&P 500 shed 1%, slipping below its 100-day moving average, a closely watched technical level. The Nasdaq Composite fell 1.2%, dropping into correction territory, (defined as a 10% drawdown from its November peak). The tech-heavy benchmark is positioned for its worst month since March 2020 (-8.3% month-to-date). The Dow lost 339 points for its fourth straight daily decline, while the small-cap Russell 2000 slumped roughly 1.4%. Volume totals reported were lighter than the prior session on the NYSE and on the Nasdaq exchange, a hint suggesting less distributional pressure or selling was from the institutional crowd. Breadth was negative as decliners led advancers by more than a 2-1 margin on the NYSE and on the Nasdaq exchange. There were 16 high-ranked companies from the Leaders List that hit new 52-week highs and were listed on the BreakOuts Page, one third of the total of 49 on the prior session. New 52-week lows outnumbered new 52-week highs by about 6-1 on the NYSE and by 20-1 on the Nasdaq exchange. The market averages (M criteria) have seen damaging losses noted that signaled a more serious market correction. Greater caution is suggested until noted strength returns. PICTURED: The S&P 500 Index slumped further below its 50-day moving average (DMA) line. Prior lows and the 200 DMA line define the next important chart support levels to watch.
U.S. stocks finished lower on Wednesday as jitters surrounding the prospect of tighter monetary policy overshadowed corporate earnings. The major averages fluctuated between gains and losses throughout the session as lingering inflationary concerns and a backdrop of higher Treasury yields continued to pressure sentiment.
Nine of 11 S&P 500 sectors closed in negative territory, with Consumer Discretionary, Financials, and Tech the worst performers. Consumer Staples bucked the downtrend, with Procter & Gamble Co. (PG +3.36%) rose following a boost to its organic growth forecast. In bank earnings, Morgan Stanley (MS +1.83%) rose after topping consensus profit estimates amid an active quarter for dealmaking and surprise increase in equities-trading revenue. Meanwhile, Bank of America Corp. (BAC +0.39%) inched higher as a rebound in its loan growth helped fuel a bottom line beat. In other corporate news, Take-Two Interactive Software Inc. (TTWO +6.05%) rose following an analyst upgrade.
Treasuries strengthened, with the yield on the 10-year note down four basis points (0.04%) to 1.84%. On the data front, housing starts posted a surprise increase in December, while building permits unexpectedly surged 9.1% during the period, the largest advance since January 2021. In commodities, West Texas Intermediate crude gained 1.2% to $86.47/barrel, a more than seven-year high. |
 Kenneth J. Gruneisen started out as a licensed stockbroker in August 1987, a couple of months prior to the historic stock market crash that took the Dow Jones Industrial Average down -22.6% in a single day. He has published daily fact-based fundamental and technical analysis on high-ranked stocks online for two decades. Through FACTBASEDINVESTING.COM, Kenneth provides educational articles, news, market commentary, and other information regarding proven investment systems that work in good times and bad.
Comments contained in the body of this report are technical opinions only and are not necessarily those of Gruneisen Growth Corp. The material herein has been obtained from sources believed to be reliable and accurate, however, its accuracy and completeness cannot be guaranteed. Our firm, employees, and customers may effect transactions, including transactions contrary to any recommendation herein, or have positions in the securities mentioned herein or options with respect thereto. Any recommendation contained in this report may not be suitable for all investors and it is not to be deemed an offer or solicitation on our part with respect to the purchase or sale of any securities. |
|
 |
Gold & Silver Index Posts Standout Gain on Widely Negative Session
Kenneth J. Gruneisen - Passed the CAN SLIM® Master's Exam
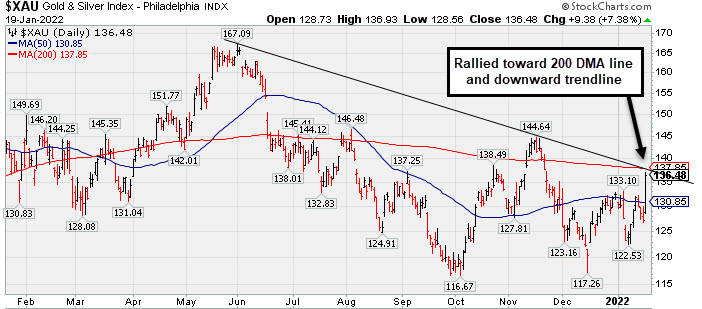
The Bank Index ($BKX -3.14%), Broker/Dealer Index ($XBD -0.96%), and Retail Index ($RLX -1.22%) unanimously slumped and weighed on the major averages. The Gold & Silver Index ($XAU +7.38%) was a standout gainer. Meanwhile, the Oil Services Index ($OSX -1.39%) and Integrated Oil Index and ($XOI -0.54%) both ended lower. The tech sector had a negative bias as the Semiconductor Index ($SOX -3.09%) led the retreat while the Networking Index ($NWX -1.32%) followed and the Biotech Index ($BTK -0.68%) also edged lower.
PICTURED: The Gold & Silver Index ($XAU +7.38%) posted a big gain as it rallied toward its 200-day moving average (DMA) line and multi-month downward trendline.
| Oil Services |
$OSX |
63.38 |
-0.89 |
-1.39% |
+20.21% |
| Integrated Oil |
$XOI |
1,380.61 |
-7.55 |
-0.54% |
+17.18% |
| Semiconductor |
$SOX |
3,612.19 |
-115.05 |
-3.09% |
-8.46% |
| Networking |
$NWX |
889.59 |
-11.89 |
-1.32% |
-8.39% |
| Broker/Dealer |
$XBD |
470.96 |
-4.58 |
-0.96% |
-3.27% |
| Retail |
$RLX |
3,883.24 |
-47.98 |
-1.22% |
-8.12% |
| Gold & Silver |
$XAU |
136.48 |
+9.38 |
+7.38% |
+3.04% |
| Bank |
$BKX |
139.07 |
-4.51 |
-3.14% |
+5.18% |
| Biotech |
$BTK |
5,008.73 |
-34.41 |
-0.68% |
-9.24% |
|
|
|
 |
Stalled and Slumped Well Below 50 DMA Line
Kenneth J. Gruneisen - Passed the CAN SLIM® Master's Exam
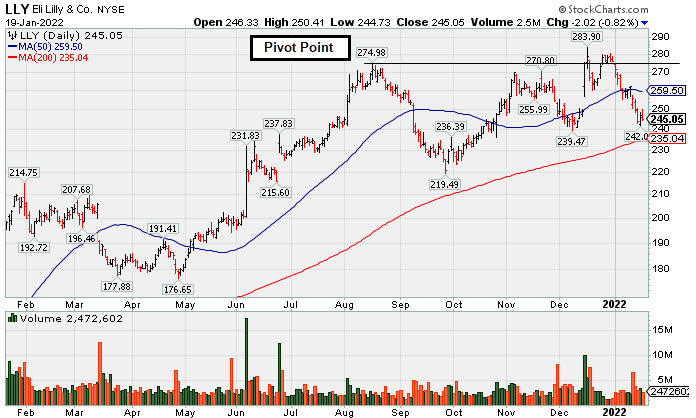
Eli Lilly & Co (LLY -$2.02 or -0.82% to $245.05) has not rebounded after slumping well below its 50-day moving average (DMA) line ($259.50) with recent volume-driven losses raising concerns and triggering a technical sell signal. A rebound above the 50 DMA line is needed for its outlook to improve.
This giant Medical - Diversified firm has stalled and faltered after briefly rising from a choppy 17-week consolidation. LLY was highlighted in yellow in the 12/16/21 mid-day report (read here) with pivot point cited based on its 8/17/21 high plus 10 cents. It was covered in greater detail that evening with an annotated graph under the headline, "Eli Lilly & Co Powered to New Highs With Volume".
LLY has an Earnings Per Share Rating of 93. It reported Sep '21 quarterly earnings +38% on +18% sales revenues versus the year ago period, and 3 of the past 4 quarterly comparisons were above the +25% minimum earnings guideline (C criteria). Annual earnings (A criteria) improved steadily since a downturn in FY '14.
The number of top-rated funds owning its shares rose from 3,055 in Dec '20 to 3,367 in Dec '21, a reassuring sign concerning the I criteria. Its current Up/Down Volume Ratio of 0.7 is an unbiased indication its shares have been under distributional pressure over the past 50 days. It has a Timeliness Rating of C and a Sponsorship Rating of B. There are 956.6 million shares outstanding, making it an unlikely sprinter, while it is also well-recognized already by the institutional crowd. |
|
|
Color Codes Explained :
Y - Better candidates highlighted by our
staff of experts.
G - Previously featured
in past reports as yellow but may no longer be buyable under the
guidelines.
***Last / Change / Volume data in this table is the closing quote data***
Symbol/Exchange
Company Name
Industry Group |
PRICE |
CHANGE
(%Change) |
Day High |
Volume
(% DAV)
(% 50 day avg vol) |
52 Wk Hi
% From Hi |
Featured
Date |
Price
Featured |
Pivot Featured |
|
Max Buy |
 BLDR
-
NYSE
BLDR
-
NYSE
Builders Firstsource Inc
Bldg-Constr Prds/Misc
|
$72.63
|
-3.32
-4.37% |
$76.89
|
3,111,821
111.82% of 50 DAV
50 DAV is 2,783,000
|
$86.48
-16.02%
|
8/12/2021
|
$52.38
|
PP = $54.09
|
|
MB = $56.79
|
Most Recent Note - 1/18/2022 5:10:02 PM
G - Testing its 50 DMA line ($75.91) with today's 3rd consecutive loss. The prior low ($72.60 on 12/20/21) defines the next important near-term support to watch. Reported Sep '21 quarterly earnings +308% on +140% sales revenues versus the year ago period.
>>> FEATURED STOCK ARTICLE : Pulling Back After Getting Very Extended From Any Sound Base - 1/10/2022 |
View all notes |
Set NEW NOTE alert |
Company Profile |
SEC
News |
Chart |
Request a new note
C
A
S
I |
KFRC
-
NASDAQ
Kforce Inc
Comml Svcs-Staffing
|
$70.75
|
-0.25
-0.35% |
$71.77
|
116,787
98.97% of 50 DAV
50 DAV is 118,000
|
$81.47
-13.16%
|
9/10/2021
|
$59.53
|
PP = $64.48
|
|
MB = $67.70
|
 Most Recent Note - 1/19/2022 4:03:18 PM
G - Holding its ground stubbornly for the past week above the 1/11/22 low ($68.37). A rebound above its 50 DMA line ($75) still is needed for its outlook to improve. Recently reported Sep '21 quarterly earnings +8% on +10% sales revenues versus the year ago period, below the +25% minimum earnings guideline (C criteria), raising fundamental concerns.
>>> FEATURED STOCK ARTICLE : Consolidating Above its 50-Day Moving Average Line - 12/29/2021 |
View all notes |
Set NEW NOTE alert |
Company Profile |
SEC
News |
Chart |
Request a new note
C
A
S
I |
REGN
-
NASDAQ
Regeneron Pharmaceutical
DRUGS - Biotechnology
|
$618.11
|
+6.89
1.13% |
$628.05
|
649,144
88.44% of 50 DAV
50 DAV is 734,000
|
$686.62
-9.98%
|
12/13/2021
|
$647.95
|
PP = $686.72
|
|
MB = $721.06
|
Most Recent Note - 1/18/2022 5:15:27 PM
G - Pulled back for a 3rd consecutive loss today with ever- increasing volume. A rebound above the 50 DMA line ($632.77) still is needed for its outlook to improve. Prior lows and its 200 DMA line ($584) define the next important support.
>>> FEATURED STOCK ARTICLE : Regeneron Still Lingering Below 50-Day Moving Average Line - 1/11/2022 |
View all notes |
Set NEW NOTE alert |
Company Profile |
SEC
News |
Chart |
Request a new note
C
A
S
I |
LLY
-
NYSE
Eli Lilly & Co
Medical-Diversified
|
$245.05
|
-2.02
-0.82% |
$250.41
|
2,472,526
79.35% of 50 DAV
50 DAV is 3,116,000
|
$283.91
-13.69%
|
12/16/2021
|
$279.28
|
PP = $275.97
|
|
MB = $289.77
|
Most Recent Note - 1/18/2022 5:06:24 PM
G - Posted a gain today with lighter volume, halting its slide after slumping well below its 50 DMA line ($260) with recent volume-driven losses raising concerns and triggering a technical sell signal. A prompt rebound above the 50 DMA line is needed for its outlook to improve. See the latest FSU analysis for more details and a new annotated graph.
>>> FEATURED STOCK ARTICLE : Stalled and Slumped Well Below 50 DMA Line - 1/19/2022 |
View all notes |
Set NEW NOTE alert |
Company Profile |
SEC
News |
Chart |
Request a new note
C
A
S
I |
CAMT
-
NASDAQ
Camtek Ltd
ELECTRONICS - Scientific and Technical Instrum
|
$38.39
|
-2.09
-5.16% |
$41.70
|
540,196
195.02% of 50 DAV
50 DAV is 277,000
|
$49.60
-22.60%
|
11/9/2021
|
$45.43
|
PP = $46.11
|
|
MB = $48.42
|
Most Recent Note - 1/19/2022 3:36:21 PM
Suffering a 2nd consecutive big loss today with higher volume raising serious concerns while undercutting the recent low and testing its 200 DMA line ($38.71). A rebound above the 50 DMA line is needed for its outlook to improve. It will be dropped from the Featured Stocks list tonight.
>>> FEATURED STOCK ARTICLE : Recent Low and 200 DMA Line Define Near-Term Support - 1/14/2022 |
View all notes |
Set NEW NOTE alert |
Company Profile |
SEC
News |
Chart |
Request a new note
C
A
S
I |
Symbol/Exchange
Company Name
Industry Group |
PRICE |
CHANGE
(%Change) |
Day High |
Volume
(% DAV)
(% 50 day avg vol) |
52 Wk Hi
% From Hi |
Featured
Date |
Price
Featured |
Pivot Featured |
|
Max Buy |
AMD
-
NASDAQ
Advanced Micro Devices
ELECTRONICS - Semiconductor - Broad Line
|
$128.27
|
-3.66
-2.77% |
$134.57
|
69,368,672
112.28% of 50 DAV
50 DAV is 61,783,000
|
$164.46
-22.01%
|
10/27/2021
|
$124.91
|
PP = $122.59
|
|
MB = $128.72
|
Most Recent Note - 1/19/2022 3:38:37 PM
Suffering yet another loss today with higher volume. It will be dropped from the Featured Stocks list tonight. A rebound above its 50 DMA line ($144.47) is needed for its outlook to improve. Fundamentals remain strong after it reported Sep '21 quarterly earnings +78% on +54% sales revenues versus the year ago period.
>>> FEATURED STOCK ARTICLE : Violation of 50-Day Moving Average Triggered Technical Sell Signal - 1/5/2022 |
View all notes |
Set NEW NOTE alert |
Company Profile |
SEC
News |
Chart |
Request a new note
C
A
S
I |
UMC
-
NYSE
United Microelectrnc Adr
ELECTRONICS - Semiconductor - Integrated Cir
|
$11.21
|
-0.13
-1.15% |
$11.63
|
8,070,654
112.77% of 50 DAV
50 DAV is 7,157,000
|
$12.68
-11.59%
|
12/1/2021
|
$12.60
|
PP = $12.72
|
|
MB = $13.36
|
Most Recent Note - 1/19/2022 4:04:49 PM
Y - Recently consolidating near its 50 DMA line ($11.47). Any damaging losses below the prior lows ($10.86) would raise more serious concerns and trigger a technical sell signal. A gain and solid close above the pivot point may help clinch a proper new (or add-on) technical buy signal. Reported Sep '21 quarterly earnings +100% on +30% sales revenues versus the year ago period.
>>> FEATURED STOCK ARTICLE : Testing Support and Perched Not Far From Prior Highs - 1/4/2022 |
View all notes |
Set NEW NOTE alert |
Company Profile |
SEC
News |
Chart |
Request a new note
C
A
S
I |
TITN
-
NASDAQ
Titan Machinery Inc
SPECIALTY RETAIL
|
$31.88
|
-1.58
-4.72% |
$33.86
|
179,208
96.87% of 50 DAV
50 DAV is 185,000
|
$38.58
-17.37%
|
11/23/2021
|
$36.22
|
PP = $35.34
|
|
MB = $37.11
|
Most Recent Note - 1/18/2022 5:18:12 PM
G - Pulled back today with lighter volume still testing support near its 50 DMA line ($33.24). It faces resistance due to overhead supply up to the $38 level. Reported Oct '21 quarterly earnings +81% on +26% sales revenues over the year ago period, its 4th strong quarterly comparison.
>>> FEATURED STOCK ARTICLE : Recently Found Support at 50-Day Moving Average Line - 12/31/2021 |
View all notes |
Set NEW NOTE alert |
Company Profile |
SEC
News |
Chart |
Request a new note
C
A
S
I |
CLFD
-
NASDAQ
Clearfield Inc
TELECOMMUNICATIONS - Cables / Satalite Equipment
|
$55.66
|
-10.27
-15.58% |
$64.56
|
761,079
434.90% of 50 DAV
50 DAV is 175,000
|
$86.71
-35.81%
|
12/16/2021
|
$72.76
|
PP = $72.10
|
|
MB = $75.71
|
Most Recent Note - 1/19/2022 3:26:30 PM
Suffering a damaging volume-driven loss today, its 4th consecutive loss, and it will be dropped from the Featured Stocks list tonight. A rebound above the 50 DMA line ($69.77) is needed for its outlook to improve. Fundamentals remain strong after it reported Sep '21 quarterly earnings +141% on +66% sales revenues above the year ago period.
>>> FEATURED STOCK ARTICLE : Negative Reversal After Hitting a New All Time High - 12/30/2021 |
View all notes |
Set NEW NOTE alert |
Company Profile |
SEC
News |
Chart |
Request a new note
C
A
S
I |
POOL
-
NASDAQ
Pool Corp
WHOLESALE - Basic Materials Wholesale
|
$490.66
|
-3.25
-0.66% |
$504.35
|
224,609
83.19% of 50 DAV
50 DAV is 270,000
|
$582.27
-15.73%
|
12/27/2021
|
$555.44
|
PP = $582.37
|
|
MB = $611.49
|
Most Recent Note - 1/19/2022 3:28:47 PM
Recently halted its slide above its 200 DMA line ($477.50) after damaging volume-driven losses. It will be dropped from the Featured Stocks list tonight. A rebound above the 50 DMA line is ($546) is needed for its outlook to improve. Fundamentals remain strong.
>>> FEATURED STOCK ARTICLE : Forming New Base After Finding Prompt Support at 50 DMA - 12/27/2021 |
View all notes |
Set NEW NOTE alert |
Company Profile |
SEC
News |
Chart |
Request a new note
C
A
S
I |
Symbol/Exchange
Company Name
Industry Group |
PRICE |
CHANGE
(%Change) |
Day High |
Volume
(% DAV)
(% 50 day avg vol) |
52 Wk Hi
% From Hi |
Featured
Date |
Price
Featured |
Pivot Featured |
|
Max Buy |
SMPL
-
NASDAQ
Simply Good Foods Co
Food-Confectionery
|
$36.67
|
-0.23
-0.62% |
$37.45
|
546,796
111.14% of 50 DAV
50 DAV is 492,000
|
$43.17
-15.06%
|
12/22/2021
|
$40.04
|
PP = $41.45
|
|
MB = $43.52
|
Most Recent Note - 1/18/2022 5:16:54 PM
G - Suffered a big loss today with above average volume while slumping further below its 50 DMA line ($39.09) raising greater concerns. Its 200 DMA line ($36.33) and prior low ($35.60 on 12/02/21) define the next important near-term support. Reported Nov '21 quarterly earnings +48% on +22% sales revenues versus the year ago period.
>>> FEATURED STOCK ARTICLE : Formed New 5-Week Base and Perched Near Pivot Point - 12/22/2021 |
View all notes |
Set NEW NOTE alert |
Company Profile |
SEC
News |
Chart |
Request a new note
C
A
S
I |
HLI
-
NYSE
Houlihan Lokey Inc Cl A
Finance-Invest Bnk/Bkrs
|
$104.35
|
-2.65
-2.48% |
$108.11
|
365,067
97.09% of 50 DAV
50 DAV is 376,000
|
$122.62
-14.90%
|
1/12/2022
|
$118.49
|
PP = $119.99
|
|
MB = $125.99
|
Most Recent Note - 1/18/2022 5:21:14 PM
G - Color code is changed to green after violating its 50 DMA line with today's 3rd consecutive volume-drive loss triggering a technical sell signal. A prompt rebound above the 50 DMA line is needed for its outlook to improve. Reported Sep '21 quarterly earnings +128% on +95% sales revenues versus the year ago period, marking its 4th quarterly comparison above the +25% minimum earnings guideline (C criteria). Completed a new Public Offering on 5/20/20.
>>> FEATURED STOCK ARTICLE : Powerful Volume-Driven Gain for New High - 1/12/2022 |
View all notes |
Set NEW NOTE alert |
Company Profile |
SEC
News |
Chart |
Request a new note
C
A
S
I |
AVTR
-
NYSE
Avantor Inc
Medical-Research Eqp/Svc
|
$37.15
|
+0.22
0.60% |
$37.89
|
3,479,282
93.16% of 50 DAV
50 DAV is 3,734,800
|
$44.37
-16.27%
|
12/27/2021
|
$41.96
|
PP = $44.47
|
|
MB = $46.69
|
Most Recent Note - 1/19/2022 3:32:28 PM
G - Met resistance near its 50 DMA line recently when rebounding, and then finding support near its 200 DMA line ($37.13) and prior low. Its Relative Strength Rating has slumped to 76, below the 80+ minimum guideline for buy candidates. A rebound above the 50 DMA line ($39.29) is needed for its outlook to improve. Reported Sep '21 quarterly earnings +46% above the year ago period.
>>> FEATURED STOCK ARTICLE : Rebounding With Volume-Driven Gains - 12/21/2021 |
View all notes |
Set NEW NOTE alert |
Company Profile |
SEC
News |
Chart |
Request a new note
C
A
S
I |
|
|
|
THESE ARE NOT BUY RECOMMENDATIONS!
Comments contained in the body of this report are technical
opinions only. The material herein has been obtained
from sources believed to be reliable and accurate, however,
its accuracy and completeness cannot be guaranteed.
This site is not an investment advisor, hence it does
not endorse or recommend any securities or other investments.
Any recommendation contained in this report may not
be suitable for all investors and it is not to be deemed
an offer or solicitation on our part with respect to
the purchase or sale of any securities. All trademarks,
service marks and trade names appearing in this report
are the property of their respective owners, and are
likewise used for identification purposes only.
This report is a service available
only to active Paid Premium Members.
You may opt-out of receiving report notifications
at any time. Questions or comments may be submitted
by writing to Premium Membership Services 665 S.E. 10 Street, Suite 201 Deerfield Beach, FL 33441-5634 or by calling 1-800-965-8307
or 954-785-1121.
|
|
|