You are not logged in.
This means you
CAN ONLY VIEW reports that were published prior to Tuesday, April 8, 2025.
You
MUST UPGRADE YOUR MEMBERSHIP if you want to see any current reports.
AFTER MARKET UPDATE - TUESDAY, JANUARY 18TH, 2022
Previous After Market Report Next After Market Report >>>
|
|
|
|
DOW |
-543.34 |
35,368.47 |
-1.51% |
|
Volume |
1,042,803,452 |
+17% |
|
Volume |
4,971,549,400 |
+15% |
|
NASDAQ |
-386.86 |
14,506.90 |
-2.60% |
|
Advancers |
514 |
16% |
|
Advancers |
818 |
18% |
|
S&P 500 |
-85.72 |
4,577.13 |
-1.84% |
|
Decliners |
2,782 |
84% |
|
Decliners |
3,686 |
82% |
|
Russell 2000 |
-66.23 |
2,096.23 |
-3.06% |
|
52 Wk Highs |
97 |
|
|
52 Wk Highs |
89 |
|
|
S&P 600 |
-36.53 |
1,351.74 |
-2.63% |
|
52 Wk Lows |
299 |
|
|
52 Wk Lows |
817 |
|
|
Damaging losses for the major averages with higher volume on Tuesday had the look of a more serious "market correction" taking hold. Greater caution is advised until strength returns.
|
 |
Major Indices Show More Worrisome Weakness
Kenneth J. Gruneisen - Passed the CAN SLIM® Master's Exam
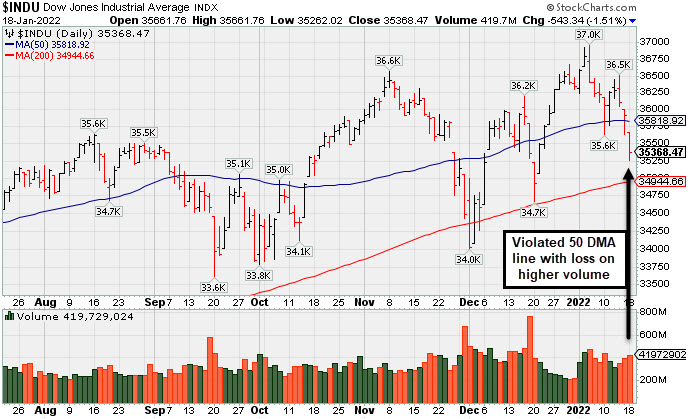
The Dow slumped 543 points, posting its biggest one-day drawdown since November. The S&P 500 retreated 1.8% to its lowest point in nearly a month. The Nasdaq Composite tumbled 2.6% to a trough not seen since mid-October, nearing correction territory with the tech-heavy index closing 9.7% below its most recent November 19 record. Volume totals reported were higher than the prior session on the NYSE and on the Nasdaq exchange, indicative of distributional pressure or an increase in selling from the institutional crowd. Breadth was negative as decliners led advancers by more than a 5-1 margin on the NYSE and more than 4-1 on the Nasdaq exchange. There were 49 high-ranked companies from the Leaders List that hit new 52-week highs and were listed on the BreakOuts Page, versus the total of 41 on the prior session. New 52-week lows outnumbered new 52-week highs by about 3-1 on the NYSE and by 9-1 on the Nasdaq exchange. The market averages (M criteria) have seen their latest uptrend come under pressure, and Tuesday's losses had the look of a more serious market correction. Greater caution is suggested until noted strength returns. PICTURED: The Dow Jones Industrial Average slumped below its 50-day moving average (DMA) line with a loss backed by higher volume.
U.S. stocks finished broadly lower on Tuesday as investors monitored a persistent back-up in Treasury yields. Growth-related shares came under pressure as Treasuries extended their recent rout amid ongoing inflationary concerns. The yield on the 10-year note jumped 10 basis points (0.10%) to 1.88%, while the two-year Treasury note yield spiked eight basis points (0.08%) to 1.04%, its highest level since February 2020. Market participants are bracing for tighter monetary policy ahead of the Federal Reserve’s January 25-26 meeting. On the data front, the Empire Manufacturing survey unexpectedly slipped into contractionary territory.
Ten of 11 S&P 500 sectors closed in negative territory. Technology stocks lagged the most with chipmakers leading the rout. Financials also underperformed after a big drop in shares of Goldman Sachs Group Inc. (GS -6.97%) since its latest profit tally fell short of estimates amid a drop in trading revenue. The investment bank also became the latest company to flag higher compensation costs, inciting worries of persisting inflation. Meanwhile, the Energy sector narrowly bucked the downtrend with West Texas Intermediate crude rallying 2.4% to $85.79/barrel, settling at the highest level since October 2014. In other corporate news, Activision Blizzard, Inc. (ATVI +25.88%) rose after Microsoft Corp. (MSFT -2.43%) announced it would acquire the video game maker in a $68.7 billion all-cash deal. |
 Kenneth J. Gruneisen started out as a licensed stockbroker in August 1987, a couple of months prior to the historic stock market crash that took the Dow Jones Industrial Average down -22.6% in a single day. He has published daily fact-based fundamental and technical analysis on high-ranked stocks online for two decades. Through FACTBASEDINVESTING.COM, Kenneth provides educational articles, news, market commentary, and other information regarding proven investment systems that work in good times and bad.
Comments contained in the body of this report are technical opinions only and are not necessarily those of Gruneisen Growth Corp. The material herein has been obtained from sources believed to be reliable and accurate, however, its accuracy and completeness cannot be guaranteed. Our firm, employees, and customers may effect transactions, including transactions contrary to any recommendation herein, or have positions in the securities mentioned herein or options with respect thereto. Any recommendation contained in this report may not be suitable for all investors and it is not to be deemed an offer or solicitation on our part with respect to the purchase or sale of any securities. |
|
 |
Financial, Retail, Tech, and Commodity-Linked Groups Fell
Kenneth J. Gruneisen - Passed the CAN SLIM® Master's Exam
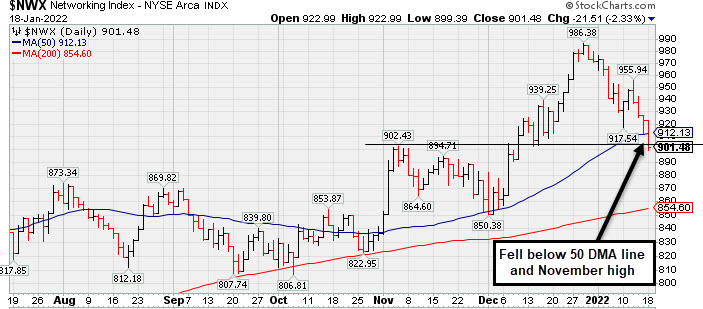
The tech sector saw unanimous losses from the Semiconductor Index ($SOX -4.44%), Biotech Index ($BTK -4.05%), and. The Broker/Dealer Index ($XBD -3.55%) and Bank Index ($BKX -2.40%) created a drag on the major averages as both outpaced the Retail Index ($RLX -1.86%) to the downside. The Gold & Silver Index ($XAU -1.12%) and Oil Services Index ($OSX -1.20%) while the Integrated Oil Index ($XOI +0.38%) eked out a small gain.
PICTURED: The Networking Index ($NWX -2.33%) sank below its 50-day moving average (DMA) line and fell below its November high.
| Oil Services |
$OSX |
64.27 |
-0.78 |
-1.20% |
+21.91% |
| Integrated Oil |
$XOI |
1,388.16 |
+5.19 |
+0.38% |
+17.82% |
| Semiconductor |
$SOX |
3,727.24 |
-173.37 |
-4.44% |
-5.55% |
| Networking |
$NWX |
901.48 |
-21.51 |
-2.33% |
-7.17% |
| Broker/Dealer |
$XBD |
475.54 |
-17.52 |
-3.55% |
-2.33% |
| Retail |
$RLX |
3,913.22 |
-74.23 |
-1.86% |
-7.41% |
| Gold & Silver |
$XAU |
127.10 |
-1.44 |
-1.12% |
-4.04% |
| Bank |
$BKX |
143.58 |
-3.53 |
-2.40% |
+8.59% |
| Biotech |
$BTK |
5,043.14 |
-212.97 |
-4.05% |
-8.61% |
|
|
|
 |
Recent Slump Below 50-Day Moving Average Hurt Outlook
Kenneth J. Gruneisen - Passed the CAN SLIM® Master's Exam
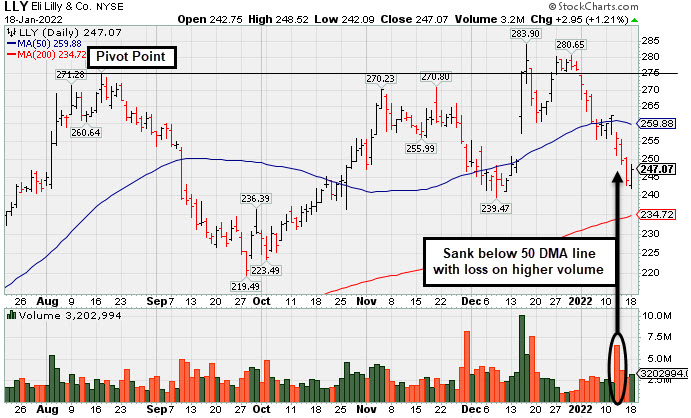
Eli Lilly & Co (LLY +$2.95 or +1.21% to $247.07) posted a gain today with lighter volume. It recently slumped well below its 50-day moving average (DMA) line ($260) with volume-driven losses raising greater concerns and triggering a technical sell signal. A rebound above the 50 DMA line is needed for its outlook to improve. Its Relative Strength Rating has slumped to 84.
LLY was highlighted in yellow in the 12/16/21 mid-day report (read here) with pivot point cited based on its 8/17/21 high plus 10 cents. It was shown in this FSU section that evening in greater detail with an annotated graph under the headline, "Eli Lilly & Co Powered to New Highs With Volume".
LLY has an Earnings Per Share Rating of 93. It reported Sep '21 quarterly earnings +38% on +18% sales revenues versus the year ago period, and 3 of the past 4 quarterly comparisons were above the +25% minimum earnings guideline (C criteria). Annual earnings (A criteria) improved steadily since a downturn in FY '14.
The number of top-rated funds owning its shares rose from 3,055 in Dec '20 to 3,467 in Dec '21, a reassuring sign concerning the I criteria. Its current Up/Down Volume Ratio of 0.7 is an unbiased indication its shares have been under distributional pressure over the past 50 days. It has a Timeliness Rating of C and a Sponsorship Rating of B. However, there are 956.6 million shares outstanding, making it an unlikely sprinter, while it is also well-recognized already by the institutional crowd. |
|
|
Color Codes Explained :
Y - Better candidates highlighted by our
staff of experts.
G - Previously featured
in past reports as yellow but may no longer be buyable under the
guidelines.
***Last / Change / Volume data in this table is the closing quote data***
Symbol/Exchange
Company Name
Industry Group |
PRICE |
CHANGE
(%Change) |
Day High |
Volume
(% DAV)
(% 50 day avg vol) |
52 Wk Hi
% From Hi |
Featured
Date |
Price
Featured |
Pivot Featured |
|
Max Buy |
 BLDR
-
NYSE
BLDR
-
NYSE
Builders Firstsource Inc
Bldg-Constr Prds/Misc
|
$75.95
|
-2.73
-3.47% |
$77.74
|
2,462,217
88.47% of 50 DAV
50 DAV is 2,783,000
|
$86.48
-12.18%
|
8/12/2021
|
$52.38
|
PP = $54.09
|
|
MB = $56.79
|
 Most Recent Note - 1/18/2022 5:10:02 PM
G - Testing its 50 DMA line ($75.91) with today's 3rd consecutive loss. The prior low ($72.60 on 12/20/21) defines the next important near-term support to watch. Reported Sep '21 quarterly earnings +308% on +140% sales revenues versus the year ago period.
>>> FEATURED STOCK ARTICLE : Pulling Back After Getting Very Extended From Any Sound Base - 1/10/2022 |
View all notes |
Set NEW NOTE alert |
Company Profile |
SEC
News |
Chart |
Request a new note
C
A
S
I |
KFRC
-
NASDAQ
Kforce Inc
Comml Svcs-Staffing
|
$71.00
|
-1.44
-1.99% |
$71.78
|
122,970
104.21% of 50 DAV
50 DAV is 118,000
|
$81.47
-12.85%
|
9/10/2021
|
$59.53
|
PP = $64.48
|
|
MB = $67.70
|
Most Recent Note - 1/13/2022 5:57:17 PM
G - Posted a gain today with lighter volume. A rebound above its 50 DMA line ($75) is needed for its outlook to improve. Recently reported Sep '21 quarterly earnings +8% on +10% sales revenues versus the year ago period, below the +25% minimum earnings guideline (C criteria), raising fundamental concerns.
>>> FEATURED STOCK ARTICLE : Consolidating Above its 50-Day Moving Average Line - 12/29/2021 |
View all notes |
Set NEW NOTE alert |
Company Profile |
SEC
News |
Chart |
Request a new note
C
A
S
I |
REGN
-
NASDAQ
Regeneron Pharmaceutical
DRUGS - Biotechnology
|
$611.22
|
-4.02
-0.65% |
$612.39
|
973,431
132.62% of 50 DAV
50 DAV is 734,000
|
$686.62
-10.98%
|
12/13/2021
|
$647.95
|
PP = $686.72
|
|
MB = $721.06
|
Most Recent Note - 1/18/2022 5:15:27 PM
G - Pulled back for a 3rd consecutive loss today with ever- increasing volume. A rebound above the 50 DMA line ($632.77) still is needed for its outlook to improve. Prior lows and its 200 DMA line ($584) define the next important support.
>>> FEATURED STOCK ARTICLE : Regeneron Still Lingering Below 50-Day Moving Average Line - 1/11/2022 |
View all notes |
Set NEW NOTE alert |
Company Profile |
SEC
News |
Chart |
Request a new note
C
A
S
I |
LLY
-
NYSE
Eli Lilly & Co
Medical-Diversified
|
$247.07
|
+2.95
1.21% |
$248.52
|
3,199,020
102.66% of 50 DAV
50 DAV is 3,116,000
|
$283.91
-12.98%
|
12/16/2021
|
$279.28
|
PP = $275.97
|
|
MB = $289.77
|
Most Recent Note - 1/18/2022 5:06:24 PM
G - Posted a gain today with lighter volume, halting its slide after slumping well below its 50 DMA line ($260) with recent volume-driven losses raising concerns and triggering a technical sell signal. A prompt rebound above the 50 DMA line is needed for its outlook to improve. See the latest FSU analysis for more details and a new annotated graph.
>>> FEATURED STOCK ARTICLE : Eli Lilly & Co Powered to New Highs With Volume - 12/16/2021 |
View all notes |
Set NEW NOTE alert |
Company Profile |
SEC
News |
Chart |
Request a new note
C
A
S
I |
CAMT
-
NASDAQ
Camtek Ltd
ELECTRONICS - Scientific and Technical Instrum
|
$40.48
|
-2.59
-6.01% |
$43.03
|
448,353
161.86% of 50 DAV
50 DAV is 277,000
|
$49.60
-18.39%
|
11/9/2021
|
$45.43
|
PP = $46.11
|
|
MB = $48.42
|
Most Recent Note - 1/18/2022 5:22:45 PM
G - Suffered a big loss today with higher volume raising greater concerns. A rebound above the 50 DMA line ($44.27) is needed for its outlook to improve. Recent low and its 200 DMA line define the next important support level in the $39 area.
>>> FEATURED STOCK ARTICLE : Recent Low and 200 DMA Line Define Near-Term Support - 1/14/2022 |
View all notes |
Set NEW NOTE alert |
Company Profile |
SEC
News |
Chart |
Request a new note
C
A
S
I |
Symbol/Exchange
Company Name
Industry Group |
PRICE |
CHANGE
(%Change) |
Day High |
Volume
(% DAV)
(% 50 day avg vol) |
52 Wk Hi
% From Hi |
Featured
Date |
Price
Featured |
Pivot Featured |
|
Max Buy |
AMD
-
NASDAQ
Advanced Micro Devices
ELECTRONICS - Semiconductor - Broad Line
|
$131.93
|
-4.95
-3.62% |
$136.39
|
56,179,816
90.93% of 50 DAV
50 DAV is 61,783,000
|
$164.46
-19.78%
|
10/27/2021
|
$124.91
|
PP = $122.59
|
|
MB = $128.72
|
Most Recent Note - 1/14/2022 5:25:56 PM
G - Posted a solid volume-driven gain today. A rebound above its 50 DMA line ($144.70) is needed for its outlook to improve. Fundamentals remain strong after it reported Sep '21 quarterly earnings +78% on +54% sales revenues versus the year ago period.
>>> FEATURED STOCK ARTICLE : Violation of 50-Day Moving Average Triggered Technical Sell Signal - 1/5/2022 |
View all notes |
Set NEW NOTE alert |
Company Profile |
SEC
News |
Chart |
Request a new note
C
A
S
I |
UMC
-
NYSE
United Microelectrnc Adr
ELECTRONICS - Semiconductor - Integrated Cir
|
$11.34
|
-0.35
-2.99% |
$11.57
|
7,474,259
104.43% of 50 DAV
50 DAV is 7,157,000
|
$12.68
-10.57%
|
12/1/2021
|
$12.60
|
PP = $12.72
|
|
MB = $13.36
|
Most Recent Note - 1/14/2022 5:31:33 PM
Y - Rose above its 50 DMA line ($11.45) with 2 consecutive volume-driven gains helping its outlook improve and its color code is changed to yellow. Any damaging losses below the prior lows ($10.86) would raise more serious concerns and trigger a technical sell signal. A gain and solid close above the pivot point may help clinch a proper new (or add-on) technical buy signal. Reported Sep '21 quarterly earnings +100% on +30% sales revenues versus the year ago period.
>>> FEATURED STOCK ARTICLE : Testing Support and Perched Not Far From Prior Highs - 1/4/2022 |
View all notes |
Set NEW NOTE alert |
Company Profile |
SEC
News |
Chart |
Request a new note
C
A
S
I |
ENTG
-
NASDAQ
Entegris Inc
ELECTRONICS - Semiconductor Equipment and Mate
|
$127.48
|
-6.14
-4.60% |
$133.29
|
976,504
79.65% of 50 DAV
50 DAV is 1,226,000
|
$158.00
-19.32%
|
8/4/2021
|
$125.33
|
PP = $126.51
|
|
MB = $132.84
|
Most Recent Note - 1/18/2022 5:12:44 PM
Sank near its 200 DMA line with today's loss and its Relative Strength Rating has slumped to 79. It will be dropped from the Featured Stocks list tonight. A rebound above the 50 DMA line ($142.91) still is needed for its outlook to improve. Fundamentals remain strong after it recently reported Sep '21 quarterly earnings +37% on +20% sales revenues versus the year ago period.
>>> FEATURED STOCK ARTICLE : Still Below 50-Day Moving Average - 1/3/2022 |
View all notes |
Set NEW NOTE alert |
Company Profile |
SEC
News |
Chart |
Request a new note
C
A
S
I |
DHI
-
NYSE
D R Horton Inc
MATERIALS and CONSTRUCTION - Residential Construction
|
$93.42
|
-5.11
-5.19% |
$97.47
|
3,718,739
119.65% of 50 DAV
50 DAV is 3,108,000
|
$110.45
-15.42%
|
12/6/2021
|
$104.40
|
PP = $106.99
|
|
MB = $112.34
|
Most Recent Note - 1/18/2022 5:25:14 PM
Pulled back further today with above average volume as it closed below its 200 DMA line ($94.42) triggering a technical sell signal. It will be dropped from the Featured Stocks list tonight. A rebound above the 50 DMA line ($101.75) is needed to help its outlook improve.
>>> FEATURED STOCK ARTICLE : Pullback Testing Support at 50-Day Moving Average Line - 1/6/2022 |
View all notes |
Set NEW NOTE alert |
Company Profile |
SEC
News |
Chart |
Request a new note
C
A
S
I |
TITN
-
NASDAQ
Titan Machinery Inc
SPECIALTY RETAIL
|
$33.46
|
-0.58
-1.70% |
$33.92
|
134,353
72.62% of 50 DAV
50 DAV is 185,000
|
$38.58
-13.27%
|
11/23/2021
|
$36.22
|
PP = $35.34
|
|
MB = $37.11
|
Most Recent Note - 1/18/2022 5:18:12 PM
G - Pulled back today with lighter volume still testing support near its 50 DMA line ($33.24). It faces resistance due to overhead supply up to the $38 level. Reported Oct '21 quarterly earnings +81% on +26% sales revenues over the year ago period, its 4th strong quarterly comparison.
>>> FEATURED STOCK ARTICLE : Recently Found Support at 50-Day Moving Average Line - 12/31/2021 |
View all notes |
Set NEW NOTE alert |
Company Profile |
SEC
News |
Chart |
Request a new note
C
A
S
I |
Symbol/Exchange
Company Name
Industry Group |
PRICE |
CHANGE
(%Change) |
Day High |
Volume
(% DAV)
(% 50 day avg vol) |
52 Wk Hi
% From Hi |
Featured
Date |
Price
Featured |
Pivot Featured |
|
Max Buy |
CLFD
-
NASDAQ
Clearfield Inc
TELECOMMUNICATIONS - Cables / Satalite Equipment
|
$65.93
|
-1.91
-2.82% |
$67.52
|
190,513
108.86% of 50 DAV
50 DAV is 175,000
|
$86.71
-23.96%
|
12/16/2021
|
$72.76
|
PP = $72.10
|
|
MB = $75.71
|
Most Recent Note - 1/14/2022 5:24:26 PM
G - Following a noted "negative reversal" on the prior session it violated its 50 DMA line ($69.82) with today's damaging loss raising more serious concerns. A prompt rebound above the 50 DMA line is needed for its outlook to improve. Reported Sep '21 quarterly earnings +141% on +66% sales revenues above the year ago period.
>>> FEATURED STOCK ARTICLE : Negative Reversal After Hitting a New All Time High - 12/30/2021 |
View all notes |
Set NEW NOTE alert |
Company Profile |
SEC
News |
Chart |
Request a new note
C
A
S
I |
POOL
-
NASDAQ
Pool Corp
WHOLESALE - Basic Materials Wholesale
|
$493.91
|
-0.19
-0.04% |
$497.58
|
348,858
129.21% of 50 DAV
50 DAV is 270,000
|
$582.27
-15.18%
|
12/27/2021
|
$555.44
|
PP = $582.37
|
|
MB = $611.49
|
Most Recent Note - 1/12/2022 1:00:19 PM
G - Halted its slide above its 200 DMA line ($475) after a damaging streak of 6 losses. A rebound above the 50 DMA line is ($547) is needed for its outlook to improve. Fundamentals remain strong.
>>> FEATURED STOCK ARTICLE : Forming New Base After Finding Prompt Support at 50 DMA - 12/27/2021 |
View all notes |
Set NEW NOTE alert |
Company Profile |
SEC
News |
Chart |
Request a new note
C
A
S
I |
SMPL
-
NASDAQ
Simply Good Foods Co
Food-Confectionery
|
$36.90
|
-2.25
-5.75% |
$38.73
|
691,010
140.45% of 50 DAV
50 DAV is 492,000
|
$43.17
-14.52%
|
12/22/2021
|
$40.04
|
PP = $41.45
|
|
MB = $43.52
|
Most Recent Note - 1/18/2022 5:16:54 PM
G - Suffered a big loss today with above average volume while slumping further below its 50 DMA line ($39.09) raising greater concerns. Its 200 DMA line ($36.33) and prior low ($35.60 on 12/02/21) define the next important near-term support. Reported Nov '21 quarterly earnings +48% on +22% sales revenues versus the year ago period.
>>> FEATURED STOCK ARTICLE : Formed New 5-Week Base and Perched Near Pivot Point - 12/22/2021 |
View all notes |
Set NEW NOTE alert |
Company Profile |
SEC
News |
Chart |
Request a new note
C
A
S
I |
HLI
-
NYSE
Houlihan Lokey Inc Cl A
Finance-Invest Bnk/Bkrs
|
$107.00
|
-7.96
-6.92% |
$113.44
|
631,140
167.86% of 50 DAV
50 DAV is 376,000
|
$122.62
-12.74%
|
1/12/2022
|
$118.49
|
PP = $119.99
|
|
MB = $125.99
|
Most Recent Note - 1/18/2022 5:21:14 PM
G - Color code is changed to green after violating its 50 DMA line with today's 3rd consecutive volume-drive loss triggering a technical sell signal. A prompt rebound above the 50 DMA line is needed for its outlook to improve. Reported Sep '21 quarterly earnings +128% on +95% sales revenues versus the year ago period, marking its 4th quarterly comparison above the +25% minimum earnings guideline (C criteria). Completed a new Public Offering on 5/20/20.
>>> FEATURED STOCK ARTICLE : Powerful Volume-Driven Gain for New High - 1/12/2022 |
View all notes |
Set NEW NOTE alert |
Company Profile |
SEC
News |
Chart |
Request a new note
C
A
S
I |
AVTR
-
NYSE
Avantor Inc
Medical-Research Eqp/Svc
|
$36.93
|
-0.78
-2.07% |
$37.71
|
4,438,176
119.71% of 50 DAV
50 DAV is 3,707,500
|
$44.37
-16.77%
|
12/27/2021
|
$41.96
|
PP = $44.47
|
|
MB = $46.69
|
Most Recent Note - 1/13/2022 6:10:08 PM
G - Met resistance near its 50 DMA line and slumped toward its 200 DMA line ($36.88) and prior low. A rebound above the 50 DMA line ($39.38) is needed for its outlook to improve. Reported Sep '21 quarterly earnings +46% above the year ago period.
>>> FEATURED STOCK ARTICLE : Rebounding With Volume-Driven Gains - 12/21/2021 |
View all notes |
Set NEW NOTE alert |
Company Profile |
SEC
News |
Chart |
Request a new note
C
A
S
I |
Symbol/Exchange
Company Name
Industry Group |
PRICE |
CHANGE
(%Change) |
Day High |
Volume
(% DAV)
(% 50 day avg vol) |
52 Wk Hi
% From Hi |
Featured
Date |
Price
Featured |
Pivot Featured |
|
Max Buy |
|
|
|
THESE ARE NOT BUY RECOMMENDATIONS!
Comments contained in the body of this report are technical
opinions only. The material herein has been obtained
from sources believed to be reliable and accurate, however,
its accuracy and completeness cannot be guaranteed.
This site is not an investment advisor, hence it does
not endorse or recommend any securities or other investments.
Any recommendation contained in this report may not
be suitable for all investors and it is not to be deemed
an offer or solicitation on our part with respect to
the purchase or sale of any securities. All trademarks,
service marks and trade names appearing in this report
are the property of their respective owners, and are
likewise used for identification purposes only.
This report is a service available
only to active Paid Premium Members.
You may opt-out of receiving report notifications
at any time. Questions or comments may be submitted
by writing to Premium Membership Services 665 S.E. 10 Street, Suite 201 Deerfield Beach, FL 33441-5634 or by calling 1-800-965-8307
or 954-785-1121.
|
|
|