You are not logged in.
This means you
CAN ONLY VIEW reports that were published prior to Monday, March 31, 2025.
You
MUST UPGRADE YOUR MEMBERSHIP if you want to see any current reports.
AFTER MARKET UPDATE - THURSDAY, JANUARY 20TH, 2022
Previous After Market Report Next After Market Report >>>
|
|
|
|
DOW |
-313.26 |
34,715.39 |
-0.89% |
|
Volume |
941,529,291 |
-0% |
|
Volume |
5,026,826,300 |
+9% |
|
NASDAQ |
-186.23 |
14,154.02 |
-1.30% |
|
Advancers |
813 |
25% |
|
Advancers |
1,172 |
27% |
|
S&P 500 |
-50.03 |
4,482.73 |
-1.10% |
|
Decliners |
2,426 |
75% |
|
Decliners |
3,216 |
73% |
|
Russell 2000 |
-38.75 |
2,024.04 |
-1.88% |
|
52 Wk Highs |
32 |
|
|
52 Wk Highs |
26 |
|
|
S&P 600 |
-28.13 |
1,300.11 |
-2.12% |
|
52 Wk Lows |
264 |
|
|
52 Wk Lows |
682 |
|
|
Damaging losses for the major averages recently signaled a market correction (M criteria). Greater caution is advised until strength returns. Disciplined investors know to avoid new buying efforts and to raise cash by selling faltering stocks on a case-by-case basis.
|
 |
Indices Erased Early Gains With Abrupt Afternoon Selloff
Kenneth J. Gruneisen - Passed the CAN SLIM® Master's Exam
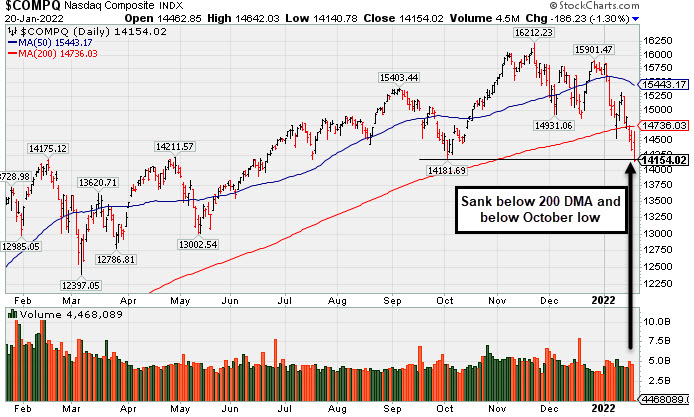
The S&P 500 erased a gain of 1.5% to end 1.1% lower, while the Dow fell 313 points, extending its losing streak to five days. The Nasdaq Composite wiped out an early session advance of 2% to close down 1.3%, now 11.9% from its most recent November 19 record. Volume totals reported were near the prior session on the NYSE and higher on the Nasdaq exchange, indicating an increase in distributional pressure or selling from the institutional crowd. Breadth was negative as decliners led advancers by a 3-1 margin on the NYSE and on the Nasdaq exchange. There were 5 high-ranked companies from the Leaders List that hit new 52-week highs and were listed on the BreakOuts Page, versus the total of 16 on the prior session. New 52-week lows totals expanded and outnumbered new 52-week highs by 8-1 on the NYSE and by 26-1 on the Nasdaq exchange. The market averages (M criteria) have seen damaging losses noted that signaled a more serious market correction. Greater caution is suggested until noted strength returns. PICTURED: The Nasdaq Composite Index slumped further below its 200-day moving average (DMA) line and below the October low. It is positioned for its worst month since March 2020 (-9.5% month-to-date).
U.S. stocks finished firmly lower on Thursday as an attempt at a relief rally once again faded into the close. Concerns over tighter monetary policy in light of persistent inflation have sparked a rout in growth-related names. Treasuries continued to stabilize, however, with the yield on the 10-year note down two basis points (0.02%) to 1.82%. In commodities, a rally in oil prices stalled, with West Texas Intermediate crude dipping 0.1% to $86.90/barrel after the first buildup in domestic stockpiles in eight weeks.
Ten of 11 S&P 500 sectors ended in negative territory, with the Consumer Discretionary group leading the downturn. Technology shares also lagged amid weakness in chipmakers. In earnings, Travelers Companies (TRV +3.19%) rose as the insurer’s profit tally dwarfed analyst estimates to hit a record. In other corporate news, Peloton Interactive, Inc. (PTON -23.93%) dove on reports the company was pausing production of its bikes and treadmills due to a “significant reduction” in demand.
Also dampening the mood was mixed economic data. Weekly initial jobless claims increased to a three-week high of 286,000. Meanwhile, existing home sales fell 4.6% in December as supply hit an all-time low. Separately, the Philadelphia Federal Reserve Business Outlook improved more than projected this month. |
 Kenneth J. Gruneisen started out as a licensed stockbroker in August 1987, a couple of months prior to the historic stock market crash that took the Dow Jones Industrial Average down -22.6% in a single day. He has published daily fact-based fundamental and technical analysis on high-ranked stocks online for two decades. Through FACTBASEDINVESTING.COM, Kenneth provides educational articles, news, market commentary, and other information regarding proven investment systems that work in good times and bad.
Comments contained in the body of this report are technical opinions only and are not necessarily those of Gruneisen Growth Corp. The material herein has been obtained from sources believed to be reliable and accurate, however, its accuracy and completeness cannot be guaranteed. Our firm, employees, and customers may effect transactions, including transactions contrary to any recommendation herein, or have positions in the securities mentioned herein or options with respect thereto. Any recommendation contained in this report may not be suitable for all investors and it is not to be deemed an offer or solicitation on our part with respect to the purchase or sale of any securities. |
|
 |
Retail, Bank, Tech, and Commodity-Linked Groups Fell
Kenneth J. Gruneisen - Passed the CAN SLIM® Master's Exam
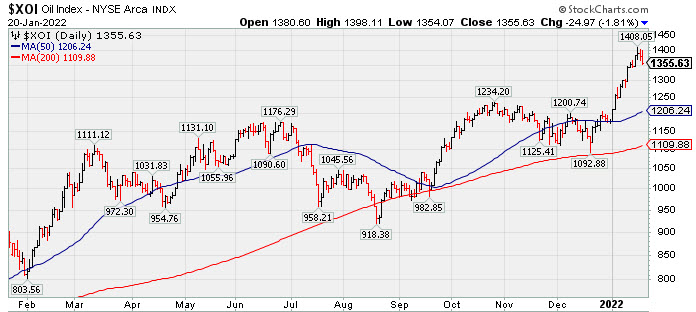
The Retail Index ($RLX -2.85%) slumped and the Bank Index ($BKX -1.65%) also fell while the Broker/Dealer Index ($XBD -0.16%) did a better job of holding its ground. The Semiconductor Index ($SOX -3.25%) outpaced the Biotech Index ($BTK -0.96%) and Networking Index ($NWX -1.32%) to the downside. Commodity-linked groups also had a negative bias as the Gold & Silver Index ($XAU -1.89%), Oil Services Index ($OSX -1.40%), and Integrated Oil Index ($XOI -1.81%) suffered unanimous losses.
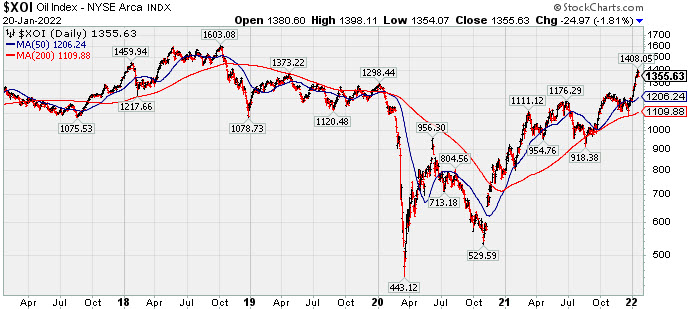
PICTURED: The 1-year graph of the Integrated Oil Index ($XOI -1.81%) shows it perched near is 52-week high. PICTURED: The 5-year graph illustrates the deep 2020 pullback and the choppy rebound toward the 2018 high.
| Oil Services |
$OSX |
62.49 |
-0.89 |
-1.40% |
+18.53% |
| Integrated Oil |
$XOI |
1,355.63 |
-24.97 |
-1.81% |
+15.06% |
| Semiconductor |
$SOX |
3,494.75 |
-117.43 |
-3.25% |
-11.44% |
| Networking |
$NWX |
877.86 |
-11.72 |
-1.32% |
-9.60% |
| Broker/Dealer |
$XBD |
470.21 |
-0.74 |
-0.16% |
-3.42% |
| Retail |
$RLX |
3,772.38 |
-110.86 |
-2.85% |
-10.74% |
| Gold & Silver |
$XAU |
133.90 |
-2.58 |
-1.89% |
+1.10% |
| Bank |
$BKX |
136.77 |
-2.30 |
-1.65% |
+3.44% |
| Biotech |
$BTK |
4,960.67 |
-48.06 |
-0.96% |
-10.11% |
|
|
|
 |
Met Resistance at 50-Day Moving Average Line
Kenneth J. Gruneisen - Passed the CAN SLIM® Master's Exam
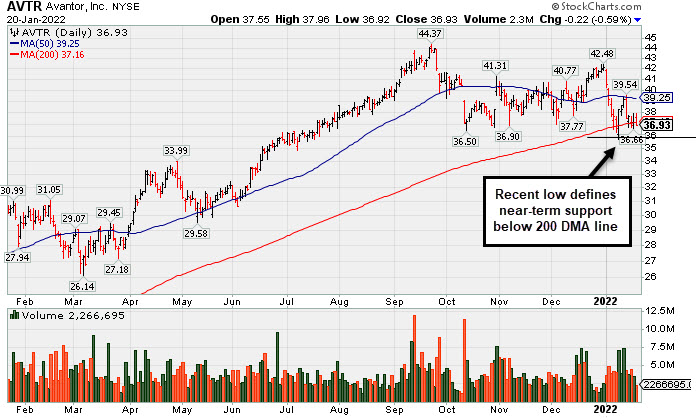
Avantor Inc (AVTR -$0.22 or -0.59% to $36.93) met resistance near its 50-day moving average (DMA) line recently when rebounding, and yet it has still been finding support near its 200 DMA line ($37.16) and prior low. Its Relative Strength Rating has slumped to 77, below the 80+ minimum guideline for buy candidates. A rebound above the 50 DMA line ($39.25) is needed for its outlook to improve.
It has an Earnings Per Share Rating of 97 based on strong fundamentals. The Sep '21 quarter marked its 5th consecutive quarterly comparison with earnings above the year ago period by at least the +25% minimum guideline (C criteria). Annual earnings growth has been strong (A criteria). Bullish action came after it reported Sep '21 quarterly earnings +46% above the year ago period.
AVTR traded up as much as +34.7% after highlighted in the 6/10/21 mid-day report (read here) yellow with pivot point cited based on its 4/29/21 high plus 10 cents. It completed a Secondary Offering on 9/13/21. It was last shown in this FSU section on 12/21/21 with an annotated graph included with additional analysis under the headline, "Rebounding With Volume-Driven Gains".
Following its $14 IPO on 5/17/19 it completed Secondary Offerings on 5/21/20, 8/21/20 and 11/09/20. The high-ranked Medical-Research Eqp/Svc firm has seen the number of top-rated funds owning its shares rise from 562 in Jun '20 to 1,308 in Dec '21 a reassuring sign concerning the I criteria. Its current Up/Down Volume ratio of 1.3 is an unbiased indication its shares have been under accumulation over the past 50 days. It has a Timeliness Rating of B and a Sponsorship Rating of B.
|
|
|
Color Codes Explained :
Y - Better candidates highlighted by our
staff of experts.
G - Previously featured
in past reports as yellow but may no longer be buyable under the
guidelines.
***Last / Change / Volume data in this table is the closing quote data***
Symbol/Exchange
Company Name
Industry Group |
PRICE |
CHANGE
(%Change) |
Day High |
Volume
(% DAV)
(% 50 day avg vol) |
52 Wk Hi
% From Hi |
Featured
Date |
Price
Featured |
Pivot Featured |
|
Max Buy |
 BLDR
-
NYSE
BLDR
-
NYSE
Builders Firstsource Inc
Bldg-Constr Prds/Misc
|
$69.74
|
-2.89
-3.98% |
$74.17
|
3,141,745
115.25% of 50 DAV
50 DAV is 2,726,000
|
$86.48
-19.36%
|
8/12/2021
|
$52.38
|
PP = $54.09
|
|
MB = $56.79
|
 Most Recent Note - 1/20/2022 5:33:36 PM
G - Violated its 50 DMA line ($76) and prior low ($72.60 on 12/20/21) triggering technical sell signals during a streak of 5 consecutive losses marked by increasing volume. A rebound above the 50 DMA line is needed for its outlook to improve. Reported Sep '21 quarterly earnings +308% on +140% sales revenues versus the year ago period.
>>> FEATURED STOCK ARTICLE : Pulling Back After Getting Very Extended From Any Sound Base - 1/10/2022 |
View all notes |
Set NEW NOTE alert |
Company Profile |
SEC
News |
Chart |
Request a new note
C
A
S
I |
KFRC
-
NASDAQ
Kforce Inc
Comml Svcs-Staffing
|
$68.18
|
-2.57
-3.63% |
$71.36
|
99,614
85.14% of 50 DAV
50 DAV is 117,000
|
$81.47
-16.31%
|
9/10/2021
|
$59.53
|
PP = $64.48
|
|
MB = $67.70
|
Most Recent Note - 1/20/2022 5:36:06 PM
Slumped below the 1/11/22 low ($68.37) with today's 3rd consecutive loss. A rebound above its 50 DMA line ($74.80) is needed for its outlook to improve. It will be dropped from the Featured Stocks list tonight. Recently reported Sep '21 quarterly earnings +8% on +10% sales revenues versus the year ago period, below the +25% minimum earnings guideline (C criteria), raising fundamental concerns.
>>> FEATURED STOCK ARTICLE : Consolidating Above its 50-Day Moving Average Line - 12/29/2021 |
View all notes |
Set NEW NOTE alert |
Company Profile |
SEC
News |
Chart |
Request a new note
C
A
S
I |
REGN
-
NASDAQ
Regeneron Pharmaceutical
DRUGS - Biotechnology
|
$614.38
|
-3.73
-0.60% |
$622.29
|
765,480
109.04% of 50 DAV
50 DAV is 702,000
|
$686.62
-10.52%
|
12/13/2021
|
$647.95
|
PP = $686.72
|
|
MB = $721.06
|
Most Recent Note - 1/18/2022 5:15:27 PM
G - Pulled back for a 3rd consecutive loss today with ever- increasing volume. A rebound above the 50 DMA line ($632.77) still is needed for its outlook to improve. Prior lows and its 200 DMA line ($584) define the next important support.
>>> FEATURED STOCK ARTICLE : Regeneron Still Lingering Below 50-Day Moving Average Line - 1/11/2022 |
View all notes |
Set NEW NOTE alert |
Company Profile |
SEC
News |
Chart |
Request a new note
C
A
S
I |
LLY
-
NYSE
Eli Lilly & Co
Medical-Diversified
|
$243.13
|
-1.92
-0.78% |
$247.95
|
2,647,041
86.14% of 50 DAV
50 DAV is 3,073,000
|
$283.91
-14.36%
|
12/16/2021
|
$279.28
|
PP = $275.97
|
|
MB = $289.77
|
Most Recent Note - 1/18/2022 5:06:24 PM
G - Posted a gain today with lighter volume, halting its slide after slumping well below its 50 DMA line ($260) with recent volume-driven losses raising concerns and triggering a technical sell signal. A prompt rebound above the 50 DMA line is needed for its outlook to improve. See the latest FSU analysis for more details and a new annotated graph.
>>> FEATURED STOCK ARTICLE : Stalled and Slumped Well Below 50 DMA Line - 1/19/2022 |
View all notes |
Set NEW NOTE alert |
Company Profile |
SEC
News |
Chart |
Request a new note
C
A
S
I |
UMC
-
NYSE
United Microelectrnc Adr
ELECTRONICS - Semiconductor - Integrated Cir
|
$11.13
|
-0.08
-0.71% |
$11.65
|
9,457,562
131.36% of 50 DAV
50 DAV is 7,200,000
|
$12.68
-12.22%
|
12/1/2021
|
$12.60
|
PP = $12.72
|
|
MB = $13.36
|
Most Recent Note - 1/19/2022 4:04:49 PM
Y - Recently consolidating near its 50 DMA line ($11.47). Any damaging losses below the prior lows ($10.86) would raise more serious concerns and trigger a technical sell signal. A gain and solid close above the pivot point may help clinch a proper new (or add-on) technical buy signal. Reported Sep '21 quarterly earnings +100% on +30% sales revenues versus the year ago period.
>>> FEATURED STOCK ARTICLE : Testing Support and Perched Not Far From Prior Highs - 1/4/2022 |
View all notes |
Set NEW NOTE alert |
Company Profile |
SEC
News |
Chart |
Request a new note
C
A
S
I |
Symbol/Exchange
Company Name
Industry Group |
PRICE |
CHANGE
(%Change) |
Day High |
Volume
(% DAV)
(% 50 day avg vol) |
52 Wk Hi
% From Hi |
Featured
Date |
Price
Featured |
Pivot Featured |
|
Max Buy |
TITN
-
NASDAQ
Titan Machinery Inc
SPECIALTY RETAIL
|
$30.91
|
-0.97
-3.04% |
$32.67
|
178,124
95.77% of 50 DAV
50 DAV is 186,000
|
$38.58
-19.88%
|
11/23/2021
|
$36.22
|
PP = $35.34
|
|
MB = $37.11
|
Most Recent Note - 1/20/2022 5:39:00 PM
G - Sank well below its 50 DMA line ($33.25) with today's 3rd consecutive loss testing the prior low ($30.27 on 12/20/21). A rebound above the 50 DMA line is needed for its outlook to improve. It faces resistance due to overhead supply up to the $38 level. Fundamentals remain strong.
>>> FEATURED STOCK ARTICLE : Recently Found Support at 50-Day Moving Average Line - 12/31/2021 |
View all notes |
Set NEW NOTE alert |
Company Profile |
SEC
News |
Chart |
Request a new note
C
A
S
I |
SMPL
-
NASDAQ
Simply Good Foods Co
Food-Confectionery
|
$36.45
|
-0.22
-0.60% |
$37.61
|
429,755
85.95% of 50 DAV
50 DAV is 500,000
|
$43.17
-15.57%
|
12/22/2021
|
$40.04
|
PP = $41.45
|
|
MB = $43.52
|
Most Recent Note - 1/18/2022 5:16:54 PM
G - Suffered a big loss today with above average volume while slumping further below its 50 DMA line ($39.09) raising greater concerns. Its 200 DMA line ($36.33) and prior low ($35.60 on 12/02/21) define the next important near-term support. Reported Nov '21 quarterly earnings +48% on +22% sales revenues versus the year ago period.
>>> FEATURED STOCK ARTICLE : Formed New 5-Week Base and Perched Near Pivot Point - 12/22/2021 |
View all notes |
Set NEW NOTE alert |
Company Profile |
SEC
News |
Chart |
Request a new note
C
A
S
I |
HLI
-
NYSE
Houlihan Lokey Inc Cl A
Finance-Invest Bnk/Bkrs
|
$104.07
|
-0.28
-0.27% |
$107.73
|
356,722
93.38% of 50 DAV
50 DAV is 382,000
|
$122.62
-15.13%
|
1/12/2022
|
$118.49
|
PP = $119.99
|
|
MB = $125.99
|
Most Recent Note - 1/18/2022 5:21:14 PM
G - Color code is changed to green after violating its 50 DMA line with today's 3rd consecutive volume-drive loss triggering a technical sell signal. A prompt rebound above the 50 DMA line is needed for its outlook to improve. Reported Sep '21 quarterly earnings +128% on +95% sales revenues versus the year ago period, marking its 4th quarterly comparison above the +25% minimum earnings guideline (C criteria). Completed a new Public Offering on 5/20/20.
>>> FEATURED STOCK ARTICLE : Powerful Volume-Driven Gain for New High - 1/12/2022 |
View all notes |
Set NEW NOTE alert |
Company Profile |
SEC
News |
Chart |
Request a new note
C
A
S
I |
AVTR
-
NYSE
Avantor Inc
Medical-Research Eqp/Svc
|
$36.93
|
-0.22
-0.59% |
$37.96
|
2,266,695
61.51% of 50 DAV
50 DAV is 3,684,800
|
$44.37
-16.77%
|
12/27/2021
|
$41.96
|
PP = $44.47
|
|
MB = $46.69
|
Most Recent Note - 1/20/2022 5:31:01 PM
G - Met resistance near its 50 DMA line recently when rebounding. Finding support near its 200 DMA line ($37.13) and prior low. Its Relative Strength Rating has slumped to 77, below the 80+ minimum guideline for buy candidates. A rebound above the 50 DMA line ($39.29) is needed for its outlook to improve. Reported Sep '21 quarterly earnings +46% above the year ago period. See the latest FSU analysis for more details and a new annotated graph.
>>> FEATURED STOCK ARTICLE : Met Resistance at 50-Day Moving Average Line - 1/20/2022 |
View all notes |
Set NEW NOTE alert |
Company Profile |
SEC
News |
Chart |
Request a new note
C
A
S
I |
|
|
|
THESE ARE NOT BUY RECOMMENDATIONS!
Comments contained in the body of this report are technical
opinions only. The material herein has been obtained
from sources believed to be reliable and accurate, however,
its accuracy and completeness cannot be guaranteed.
This site is not an investment advisor, hence it does
not endorse or recommend any securities or other investments.
Any recommendation contained in this report may not
be suitable for all investors and it is not to be deemed
an offer or solicitation on our part with respect to
the purchase or sale of any securities. All trademarks,
service marks and trade names appearing in this report
are the property of their respective owners, and are
likewise used for identification purposes only.
This report is a service available
only to active Paid Premium Members.
You may opt-out of receiving report notifications
at any time. Questions or comments may be submitted
by writing to Premium Membership Services 665 S.E. 10 Street, Suite 201 Deerfield Beach, FL 33441-5634 or by calling 1-800-965-8307
or 954-785-1121.
|
|
|