Technical and Fundamental Concerns Hurt Outlook - Friday, December 3, 2021
S V B Financial Group (SIVB -$37.63 or -5.28% to $674.57) slumped well below its 50 DMA line ($707) with another volume-driven loss on Friday hurting its technical stance again. It will be dropped from the Featured Stocks list tonight. Recently it reported Sep '21 quarterly earnings -14% on +43% sales revenues versus the year ago period, below the +25% minimum earnings guideline (C criteria), raising fundamental concerns. Its current Earnings Per Share Rating is 86.
SIVB has a great annual earnings history (A criteria). It completed new Public Offerings on 8/11/21 and on 3/24/21. It was last shown in this FSU section on 10/29/21 with an annotated graph under the headline, "Latest Quarter Raised Fundamental Concerns". The number of top-rated funds owning its shares rose from 761 in Mar '17 to 1,892 in Sep '21, a reassuring sign concerning the I criteria. Its current Up/Down Volume Ratio of 1.3 is an unbiased indication its shares have been under slight accumulation over the past 50 days. It currently has a Timeliness rating of B and a Sponsorship Rating of B. There are only 58.7 million shares outstanding (S criteria) which can contribute to greater price volatility in the event of institutional buying or selling.
Charts courtesy wwwstockcharts.com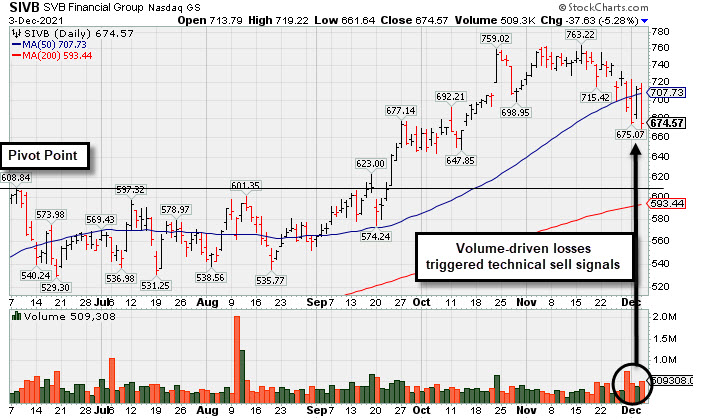
Latest Quarter Raised Fundamental Concerns - Friday, October 29, 2021
S V B Financial Group (SIVB +$6.91 or +0.97% to $717.40) is very extended from the previously noted base. Recently it reported Sep '21 quarterly earnings -14% on +43% sales revenues versus the year ago period, below the +25% minimum earnings guideline (C criteria), raising fundamental concerns. Its 50-day moving average (DMA) line ($636) defines important near-term support to watch on pullbacks.
Its Earnings Per Share Rating has slumped to 85. Jun '21 quarterly earnings rose +106% on +69% sales revenues versus the year ago period, but that capped a streak of 4 strong comparisons above the +25% minimum guideline (C criteria) of the fact-based investment system's guidelines. It has a great annual earnings history (A criteria).
SIVB completed new Public Offerings on 8/11/21 and on 3/24/21. It was last shown in this FSU section on 9/28/21 with an annotated graph under the headline, "Pullback After 5 Straight Gains into New High Territory". The number of top-rated funds owning its shares rose from 761 in Mar '17 to 1,864 in Sep '21, a reassuring sign concerning the I criteria. Its current Up/Down Volume Ratio of 1.9 is an unbiased indication its shares have been under slight accumulation over the past 50 days. It currently has a Timeliness rating of B and a Sponsorship Rating of A. There are only 56.4 million shares outstanding (S criteria) which can contribute to greater price volatility in the event of institutional buying or selling.
Charts courtesy wwwstockcharts.com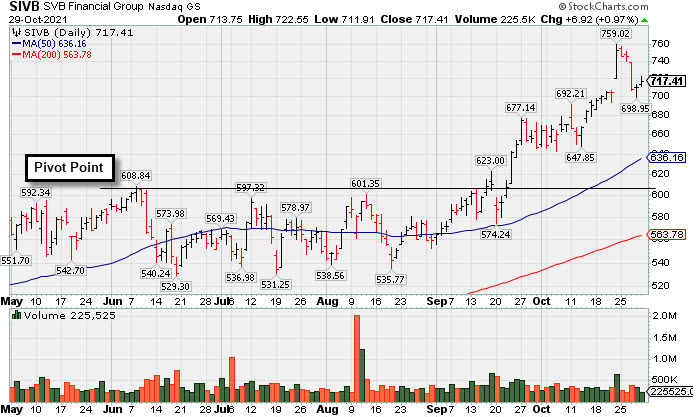
Pullback After 5 Straight Gains into New High Territory - Tuesday, September 28, 2021
S V B Financial Group (SIVB -$20.41 or -3.03% to $654.00) pulled back today after 5 consecutive gains into new all-time high territory. Its color code was changed to green after rallying above its "max buy" level. Its 50-day moving average (DMA) line ($580) defies important near-term support to watch.
Its Earnings Per Share Rating is 99. Recently it reported Jun '21 quarterly earnings +106% on +69% sales revenues versus the year ago period, its 4th strong comparison above the +25% minimum guideline (C criteria) of the fact-based investment system's guidelines. It has a great annual earnings history (A criteria).
SIVB completed new Public Offerings on 8/11/21 and on 3/24/21. It was last shown in this FSU section on 8/09/21 with an annotated graph under the headline, "Consolidating Near Prior Highs Facing Little Resistance". The number of top-rated funds owning its shares rose from 761 in Mar '17 to 1,836 in Jun '21, a reassuring sign concerning the I criteria. Its current Up/Down Volume Ratio of 1.3 is an unbiased indication its shares have been under slight accumulation over the past 50 days. It currently has a Timeliness rating of A and a Sponsorship Rating of A. There are only 56.4 million shares outstanding (S criteria) which can contribute to greater price volatility in the event of institutional buying or selling.
Charts courtesy wwwstockcharts.com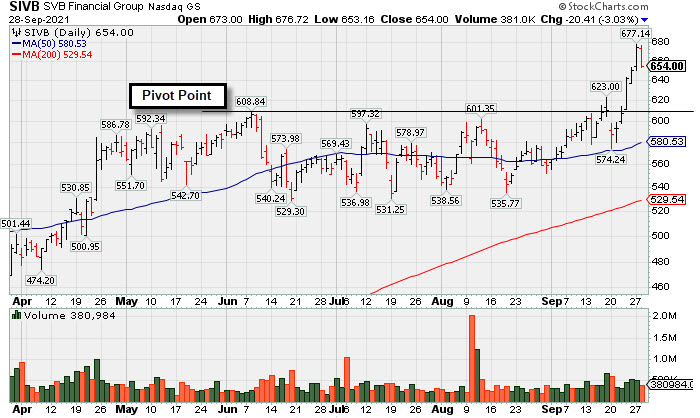
Consolidating Near Prior Highs Facing Little Resistance - Monday, August 9, 2021
S V B Financial Group (SIVB -$2.68 or -0.45% to $587.02) pulled back today with lighter volume. Last week's rebound above its 50-day moving average (DMA) line ($566.50) helped its outlook improve. A new pivot point was cited based on its 6/08/21 high plus 10 cents. Subsequent gains above the pivot point backed by at least +40% above average volume may trigger a new technical buy signal. Prior lows in the $531-529 area define important near-term support to watch.
Its Earnings Per Share Rating is 99. Recently it reported Jun '21 quarterly earnings +106% on +69% sales revenues versus the year ago period, its 4th strong comparison above the +25% minimum guideline (C criteria) of the fact-based investment system's guidelines. It has a great annual earnings history (A criteria).
SIVB was last shown in this FSU section on 6/25/21 with an annotated graph under the headline, "Consolidating Near 50-Day Average After Distributional Pressure". The company completed a new Public Offering on 3/24/21. The number of top-rated funds owning its shares rose from 761 in Mar '17 to 1,834 in Jun '21, a reassuring sign concerning the I criteria. Its current Up/Down Volume Ratio of 1.1 is an unbiased indication its shares have been under slight accumulation over the past 50 days. It has earned a Timeliness rating of B and a Sponsorship Rating of B. There are only 53.8 million shares outstanding (S criteria) which can contribute to greater price volatility in the event of institutional buying or selling.
Charts courtesy wwwstockcharts.com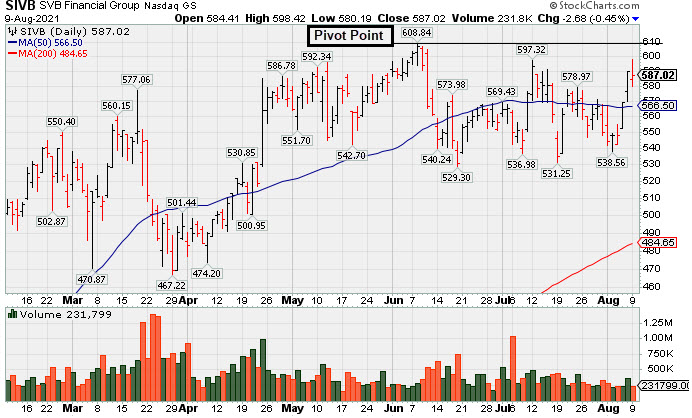
Consolidating Near 50-Day Average After Distributional Pressure - Friday, June 25, 2021
S V B Financial Group (SIVB +$3.67 or +0.65% to $564.71) a has shown resilience after damaging volume-drive losses. It is consolidating near its 50-day moving average (DMA) line ($566). More damaging losses below the recent low ($529.30) would raise greater concerns and trigger a worrisome technical sell signal.
SIVB was highlighted in yellow in the 4/23/21 mid-day report (read here) with a pivot point cited based on its 3/18/21 high plus 10 cents. It wedged higher and then encountered distributional pressure since last shown in this FSU section on 5/20/21 with an annotated graph under the headline, "Sputtering Since Featured Without Confirming Gains".
Its Earnings Per Share Rating is 99. Earnings rose +293% on +64% sales revenues for the Mar '21 quarter versus the year ago period, its 3rd strong comparison above the +25% minimum guideline (C criteria) of the fact-based investment system's guidelines. It has a great annual earnings history (A criteria).
The company completed a new Public Offering on 3/24/21. The number of top-rated funds owning its shares rose from 761 in Mar '17 to 1,713 in Mar '21, a reassuring sign concerning the I criteria. Its current Up/Down Volume ratio of 1.4 is an unbiased indication its shares have been under accumulation over the past 50 days. It has earned a Timeliness rating of A and a Sponsorship Rating of B. There are only 53.8 million shares outstanding (S criteria) which can contribute to greater price volatility in the event of institutional buying or selling.
Charts courtesy wwwstockcharts.com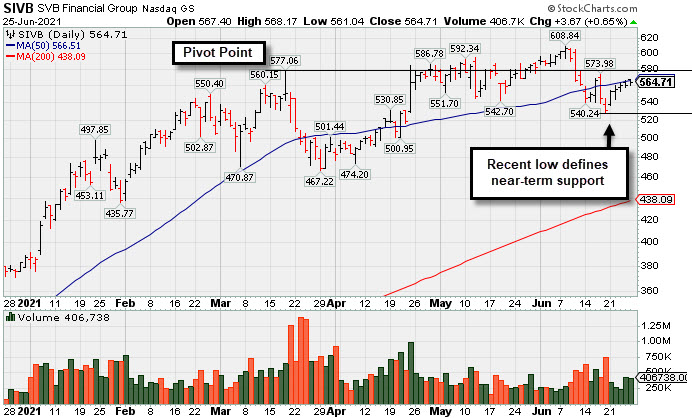
Sputtering Since Featured Without Confirming Gains - Thursday, May 20, 2021
S V B Financial Group (SIVB -$3.13 or -0.56% to $559.81) was highlighted in yellow in the 4/23/21 mid-day report (read here) with a pivot point cited based on its 3/18/21 high plus 10 cents. At that time it spiked up to touch a new all-time high with a volume-driven gain but did not close above the pivot point. Since then it did not produce confirming volume-driven gains for new highs to help clinch a proper technical buy signal. Meanwhile, its 50-day moving average (DMA) line ($535) defines important near-term support to watch.
SIVB was last shown in this FSU section on 4/23/21 with an annotated graph under the headline, "Hit New High But Closed Below Pivot Point". Bullish action came after it reported earnings +293% on +64% sales revenues for the Mar '21 quarter versus the year ago period, its 3rd strong comparison above the +25% minimum guideline (C criteria) of the fact-based investment system's guidelines. It has a great annual earnings history (A criteria).
The company completed a new Public Offering on 3/24/21. The number of top-rated funds owning its shares rose from 761 in Mar '17 to 1,679 in Mar '21, a reassuring sign concerning the I criteria. Its current Up/Down Volume ratio of 1.0 is an unbiased indication its shares have been neutral concerning accumulation/distribution over the past 50 days. It has earned a Timeliness rating of A and a Sponsorship Rating of B. There are only 53.8 million shares outstanding (S criteria) which can contribute to greater price volatility in the event of institutional buying or selling.
Charts courtesy wwwstockcharts.com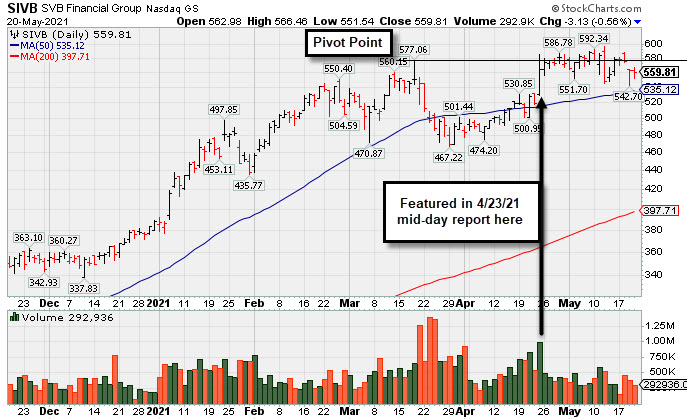
Hit New High But Closed Below Pivot Point - Friday, April 23, 2021
S V B Financial Group (SIVB +$45.23 or +8.72% to $564.22) was highlighted in yellow in the earlier mid-day report (read here) with a pivot point cited based on its 3/18/21 high plus 10 cents. It spiked up to touch a new all-time high with today's volume-driven gain but did not close above the pivot point. Confirming volume-driven gains for new highs may help clinch a proper technical buy signal.
Bullish action came after it reported earnings +293% on +64% sales revenues for the Mar '21 quarter versus the year ago period, its 3rd strong comparison above the +25% minimum guideline (C criteria) of the fact-based investment system's guidelines. It has a great annual earnings history (A criteria).
SIVB completed a new Public Offering on 3/24/21. It went through a deep consolidation and made impressive progress since dropped from the Featured Stocks list on 10/23/18 following its last appearance in this FSU section on 10/11/18 with an annotated graph under the headline, "Weak Action Amid Broader Market Declines".
The number of top-rated funds owning its shares rose from 761 in Mar '17 to 1,634 in Mar '21, a reassuring sign concerning the I criteria. Its current Up/Down Volume ratio of 0.8 is an unbiased indication its shares have been under slight distributional pressure over the past 50 days. It has earned a Timeliness rating of A and a Sponsorship Rating of B. There are only 53.9 million shares outstanding (S criteria) which can contribute to greater price volatility in the event of institutional buying or selling.
Charts courtesy wwwstockcharts.com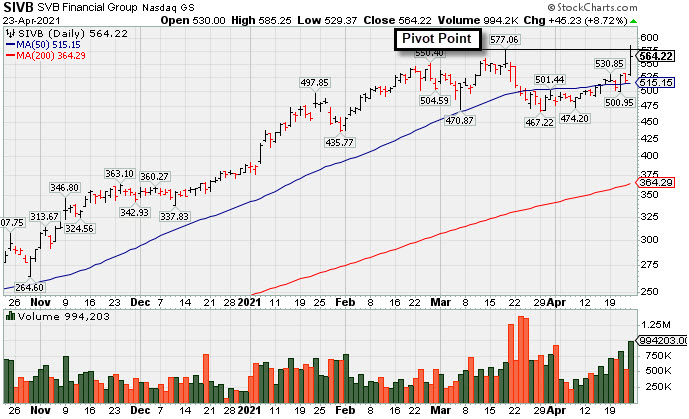
Weak Action Amid Broader Market Declines - Thursday, October 11, 2018
S V B Financial Group (SIVB -$8.25 or -2.74% to $292.89) slumped near its 200-day moving average (DMA) line ($287) earlier today before rebounding. It suffered a big volume-driven loss on the prior session. A rebound above the 50 DMA line ($319.83) is needed for its outlook to improve
Fundamentals remain strong. It reported financial results for the quarter ended June 30, 2018 and earnings rose +91% on +40% sales revenues versus the year ago period, marking its 6th consecutive comparison above the +25% minimum guideline (C criteria) of the fact-based investment system's guidelines. It has a great annual earnings history (A criteria).
SIVB last appeared in this FSU section on 8/27/18 with an annotated graph under the headline, "Bank Posted Quiet Gain for a Best-Ever Close". It was highlighted in yellow with pivot point cited based on its 1/24/18 high plus 10 cents in the 3/12/18 mid-day report (read here).
The number of top-rated funds owning its shares rose from 761 in Mar '17 to 1,366 in Jun '18, a reassuring sign concerning the I criteria. Its current Up/Down Volume ratio of 0.7 is an unbiased indication its shares have been under slight accumulation over the past 50 days. It has earned a Timeliness rating of A and a Sponsorship Rating of B. There are only 53.2 million shares outstanding (S criteria) which can contribute to greater price volatility in the event of institutional buying or selling.
Charts courtesy wwwstockcharts.com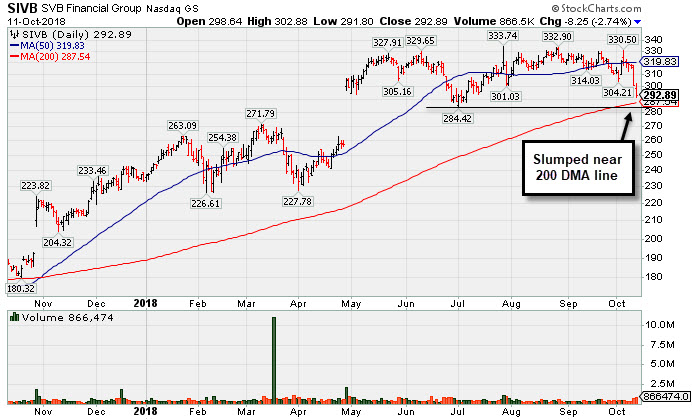
Bank Posted Quiet Gain for a Best-Ever Close - Monday, August 27, 2018
S V B Financial Group (SIVB +$4.71 or +1.44% to $331.24) posted a gain today on light volume for a best-ever close. It has met resistance in recent weeks near prior highs. Subsequent gains above the pivot point backed by at least +40% above average volume may trigger a convincing new (or add-on) technical buy signal. The 50-day moving average (DMA) line ($311) defines near-term support to watch on pullbacks.
Fundamentals remain strong. It reported financial results for the quarter ended June 30, 2018 and earnings rose +91% on +40% sales revenues versus the year ago period, marking its 6th consecutive comparison above the +25% minimum guideline (C criteria) of the fact-based investment system's guidelines. It has a great annual earnings history (A criteria).
SIVB last appeared in this FSU section on 7/10/18 with an annotated graph under the headline, "Still Sputtering Below 50-Day Moving Average". It was highlighted in yellow with pivot point cited based on its 1/24/18 high plus 10 cents in the 3/12/18 mid-day report (read here).
The number of top-rated funds owning its shares rose from 761 in Mar '17 to 1,252 in Jun '18, a reassuring sign concerning the I criteria. Its current Up/Down Volume ratio of 0.9 is an unbiased indication its shares have been under slight accumulation over the past 50 days. It has earned a Timeliness rating of B and a Sponsorship Rating of B. There are only 53 million shares outstanding (S criteria) which can contribute to greater price volatility in the event of institutional buying or selling.
Charts courtesy wwwstockcharts.com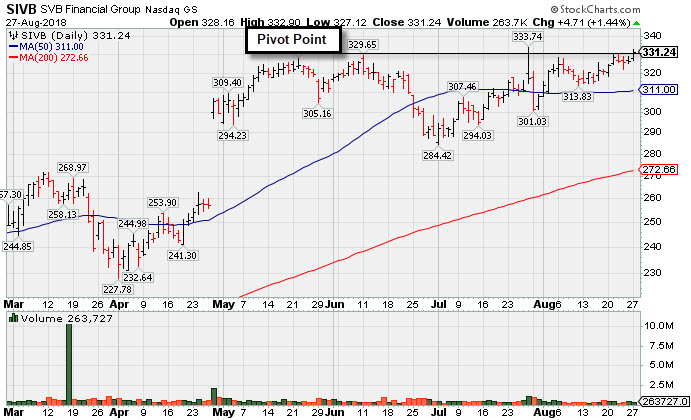
Still Sputtering Below 50-Day Moving Average - Tuesday, July 10, 2018
S V B Financial Group (SIVB -$2.33 or -0.77% to $301.92) has been sputtering after damaging losses. A rebound above the 50-day moving average (DMA) line ($312) is still needed for its outlook to improve. Fundamentals are strong.
There was a big "breakaway gap" for a new high on 4/27/18. Bullish action came after it reported financial results for the quarter ended March 31, 2018 and earnings rose +90% on +34% sales revenues versus the year ago period, marking its 5th consecutive comparison above the +25% minimum guideline (C criteria) of the fact-based investment system's guidelines. It has a great annual earnings history (A criteria).
SIVB was highlighted in yellow with pivot point cited based on its 1/24/18 high plus 10 cents in the 3/12/18 mid-day report (read here). It last appeared in this FSU section on 5/22/18 with an annotated graph under the headline, "Wedging Higher Following Big Breakaway Gap".
The number of top-rated funds owning its shares rose from 761 in Mar '17 to 1,143 in Mar '18, a reassuring sign concerning the I criteria. Its current Up/Down Volume ratio of 1.2 is an unbiased indication its shares have been under slight accumulation over the past 50 days. It has earned a Timeliness rating of B and a Sponsorship Rating of B. There are only 53 million shares outstanding (S criteria) which can contribute to greater price volatility in the event of institutional buying or selling.
Charts courtesy wwwstockcharts.com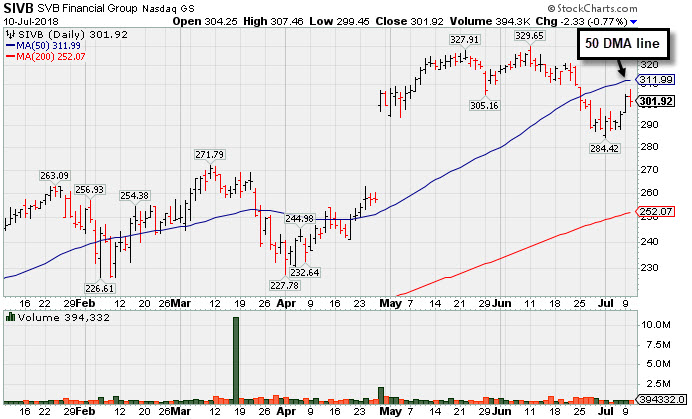
Wedging Higher Following Big Breakaway Gap - Tuesday, May 22, 2018
S V B Financial Group (SIVB +$2.11 or +0.65% to $324.31) has been stubbornly holding its ground and quietly edging higher after a big "breakaway gap" for a new high on 4/27/18. Bullish action came after it reported financial results for the quarter ended March 31, 2018 and earnings rose +90% on +34% sales revenues versus the year ago period, marking its 5th consecutive comparison above the +25% minimum guideline (C criteria) of the fact-based investment system's guidelines. It has a great annual earnings history (A criteria).
SIVB was highlighted in yellow with pivot point cited based on its 1/24/18 high plus 10 cents in the 3/12/18 mid-day report (read here). It last appeared in this FSU section on 4/12/18 with an annotated graph under the headline, "Rebounded Above its 50-Day Moving Average".
The number of top-rated funds owning its shares rose from 761 in Mar '17 to 1,085 in Mar '18, a reassuring sign concerning the I criteria. Its current Up/Down Volut me ratio of 2.1 is an unbiased indication its shares have been under accumulation over the past 50 days. It has earned a Timeliness rating of A and a Sponsorship Rating of C. There are only 52.9 million shares outstanding (S criteria).
Charts courtesy wwwstockcharts.com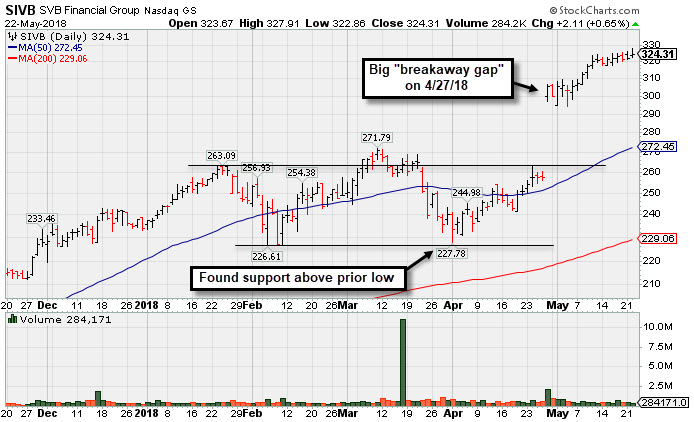
Rebounded Above its 50-Day Moving Average - Thursday, April 12, 2018
S V B Financial Group (SIVB +$6.97 or +2.86% to $250.56) found support when recently sputtering near the prior low ($226.61 on 2/06/18). Today's rebound above its downward sloping 50-day moving average (DMA) line ($249.19) helped its outlook improve.
SIVB was highlighted in yellow with pivot point cited based on its 1/24/18 high plus 10 cents in the 3/12/18 mid-day report (read here) and last appeared in this FSU section on 3/12/18 with an annotated graph under the headline, "Endured Distributional Pressure After Wedging Higher".
Recently it reported earnings +53% on +32% sales revenues for the Dec '17 quarter, marking its 4th consecutive comparison above the +25% minimum guideline (C criteria), helping it better match the fact-based investment system's guidelines. It has a great annual earnings history (A criteria).
The number of top-rated funds owning its shares rose from 761 in Mar '17 to 978 in Mar '18, a reassuring sign concerning the I criteria. Its current Up/Down Volume ratio of 2.0 is an unbiased indication its shares have been under accumulation over the past 50 days. It has earned a Timeliness rating of A and a Sponsorship Rating of C. There are only 52.9 million shares outstanding (S criteria).
Charts courtesy wwwstockcharts.com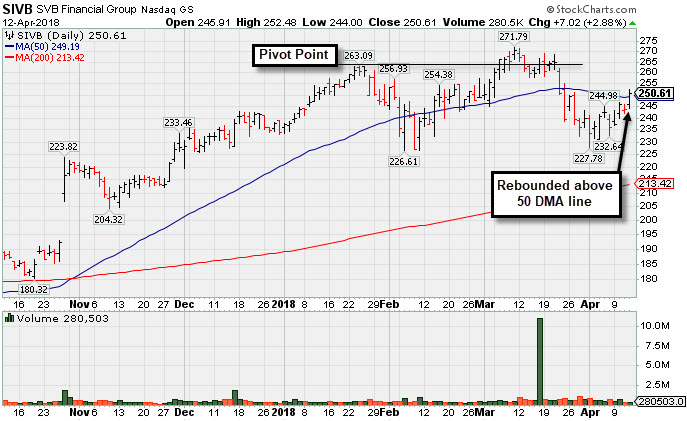
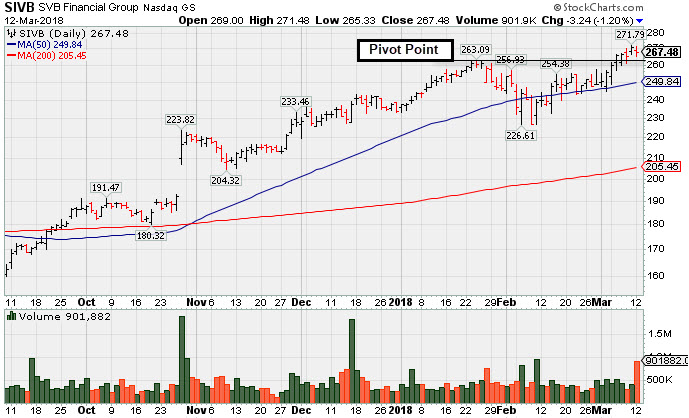
Endured Distributional Pressure After Wedging Higher - Monday, March 12, 2018
S V B Financial Group ( SIVB -$3.24 or -1.20% to $267.48) was highlighted in yellow with pivot point cited based on its 1/24/18 high plus 10 cents in the earlier mid-day report (read here). It wedged to new 52-week highs with recent gains lacking great volume conviction after a short flat base. Subsequent gains above the pivot point with at least +40% above average volume may clinch a proper technical buy signal.
Recently it reported earnings +53% on +32% sales revenues for the Dec '17 quarter, marking its 4th consecutive comparison above the +25% minimum guideline (C criteria), helping it better match the fact-based investment system's guidelines. It has a great annual earnings history (A criteria).
The number of top-rated funds owning its shares rose from 761 in Mar '17 to 984 in Dec '17, a reassuring sign concerning the I criteria. Its current Up/Down Volume ratio of 1.7 is an unbiased indication its shares have been under accumulation over the past 50 days. It has earned a Timeliness rating of A and a Sponsorship Rating of C. There are only 52.9 million shares outstanding (S criteria).
Charts courtesy wwwstockcharts.com