Relative Strength Fell and Lingering Below 50-Day Moving Average - Monday, March 4, 2024
Lululemon Athletica (LULU -$7.71 or -1.68% to $450.79) has been lingering below its 50-day moving average (DMA) line ($476) which is now downward sloping and may act as resistance. Its Relative Strength Rating has slumped to 77, below the 80+ minimum guideline for buy candidates. A rebound above the 50 DMA line is needed to help its outlook improve. It will be dropped from the Featured Stocks list tonight.
LULU was highlighted in yellow in the 12/08/23 mid-day report (read here) with pivot point cited based on its Nov '21 high plus 10 cents. It was last shown in detail in this FSU section on 2/02/24 with an annotated graph on under the headline, "Violation of 50-Day Moving Average Hurt Outlook".
LULU reported Oct '23 quarterly earnings +27% on +19% sales revenues versus the year-ago period. Three of the 4 latest quarterly comparisons were above the +25% minimum earnings guideline (C criteria). Annual earnings (A criteria) had a downturn in FY '21. It currently has a 98 Earnings Per Share Rating. Its Timeliness rating is B and Sponsorship rating is B.
The current Up/Down Volume Ratio of 0.6 is an unbiased indication its shares have been under distributional pressure over the past 50 days. The number of top-rated funds owning its shares rose from 2,104 in Mar '23 to 2,478 in Dec '23, a good sign concerning the I criteria.
Charts courtesy of www.stockcharts.com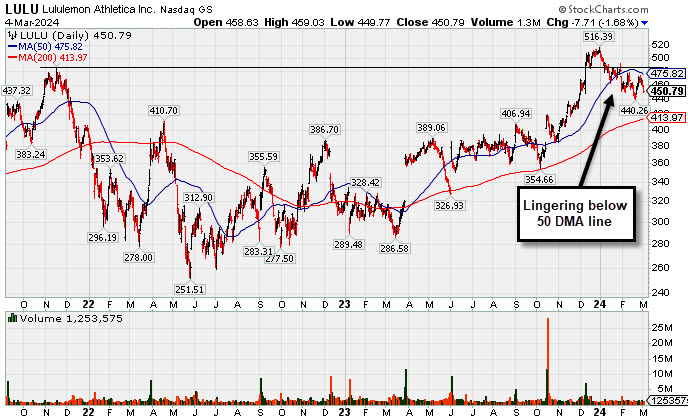
| Symbol/Exchange Company Name Industry Group | PRICE | CHANGE | Day High | Volume (% DAV) (% 50 day avg vol) | 52 Wk Hi | Featured Date | Price Featured | Pivot Featured |
| Max Buy | ||||||||
Arista Networks Computer-Networking | $287.94 | +0.20 0.07% | $291.29 | 2,000,591 50 DAV is 2,178,000 | $292.66 -1.61% | 10/31/2023 | $188.84 | PP = $198.80 |
| MB = $208.74 | ||||||||
| Most Recent Note - 3/1/2024 4:51:52 PM G - Posted a gain with +23% above average volume for a best-ever close, very extended from any sound base. Its 50 DMA line ($257.51) defines important near-term support to watch on pullbacks. See the latest FSU analysis for more details and a new annotated graph. >>> FEATURED STOCK ARTICLE : Best Ever Close for Arista Networks - 3/1/2024 | View all notes | Set NEW NOTE alert | Company Profile | SEC News | Chart | Request a new note | ||||||||
Novo Nordisk ADR Medical-Ethical Drugs | $127.95 | +3.72 2.99% | $128.77 | 6,806,385 50 DAV is 4,615,000 | $124.87 2.47% | 3/1/2024 | $124.23 | PP = $124.97 |
| MB = $131.22 | ||||||||
Y - Gapped up today hitting a new all-time high. Color code was recently changed to yellow after forming an advanced "3-weeks tight" base. Its 50 DMA line ($112.59) defines important near-term support to watch on pullbacks. >>> FEATURED STOCK ARTICLE : Extended From Any Sound Base After Volume-Driven Gains - 2/8/2024 | View all notes | Set NEW NOTE alert | Company Profile | SEC News | Chart | Request a new note | ||||||||
Axon Enterprise Security/Sfty | $319.79 | +5.54 1.76% | $325.63 | 927,159 50 DAV is 442,000 | $318.90 0.28% | 11/8/2023 | $127.84 | PP = $223.30 |
| MB = $234.47 | ||||||||
G - Very extended from any sound base and hitting another new all-time high today. Bullish action came after it reported Dec '23 quarterly earnings +60% on +29% sales revenues versus the year-ago period. Volume and volatility often increase near earnings news. Prior highs in the $260-262 area define initial support to watch along with its 50-day moving average (DMA) line ($262.58). >>> FEATURED STOCK ARTICLE : Reversal at All-Time High After 7 Consecutive Gains - 2/12/2024 | View all notes | Set NEW NOTE alert | Company Profile | SEC News | Chart | Request a new note | ||||||||
TransDigm Group Aerospace/Defense | $1,173.41 | -9.86 -0.83% | $1,189.53 | 262,252 50 DAV is 211,000 | $1,207.58 -2.83% | 12/12/2023 | $1,000.39 | PP = $1,013.18 |
| MB = $1,063.84 | ||||||||
| Most Recent Note - 2/27/2024 11:30:31 AM G - Pulling back today with below-average volume for a 2nd loss off of its all-time high. Its 50 DMA line ($1,068) defines near-term support to watch. >>> FEATURED STOCK ARTICLE : Transdigm Perched Near All-Time High - 2/14/2024 | View all notes | Set NEW NOTE alert | Company Profile | SEC News | Chart | Request a new note | ||||||||
The Bancorp Banks-Northeast | $42.09 | -2.02 -4.58% | $45.00 | 629,836 50 DAV is 419,000 | $47.11 -10.66% | 1/22/2024 | $40.87 | PP = $42.56 |
| MB = $44.69 | ||||||||
G - Suffered a big loss today with above-average volume, undercutting its pivot point and raising concerns while testing prior highs in the $42 area. Its 50 DMA line ($41.50) defines important near-term support to watch. Fundamentals remain strong. >>> FEATURED STOCK ARTICLE : Wedging Above "Max Buy" Level With Gains Lacking Great Volume - 2/27/2024 | View all notes | Set NEW NOTE alert | Company Profile | SEC News | Chart | Request a new note | ||||||||
| Symbol/Exchange Company Name Industry Group | PRICE | CHANGE | Day High | Volume (% DAV) (% 50 day avg vol) | 52 Wk Hi | Featured Date | Price Featured | Pivot Featured |
| Max Buy | ||||||||
Lululemon Athletica Retail-Apparel/Shoes/Acc | $450.79 | -7.71 -1.68% | $459.03 | 1,248,780 50 DAV is 1,182,000 | $516.39 -12.70% | 12/8/2023 | $490.61 | PP = $485.93 |
| MB = $510.23 | ||||||||
Relative Strength Rating has slumped to 77 while still lingering below its 50 DMA line ($476) which is now downward sloping and may act as resistance. A rebound above the 50 DMA line is needed to help its outlook improve. It will be dropped from the Featured Stocks list tonight. See the latest FSU analysis for more details and a new annotated graph. >>> FEATURED STOCK ARTICLE : Relative Strength Fell and Lingering Below 50-Day Moving Average - 3/4/2024 | View all notes | Set NEW NOTE alert | Company Profile | SEC News | Chart | Request a new note | ||||||||
CrowdStrike Holdings Computer Sftwr-Security | $313.81 | -0.79 -0.25% | $317.99 | 4,669,898 50 DAV is 3,236,000 | $338.45 -7.28% | 1/2/2024 | $246.42 | PP = $261.91 |
| MB = $275.01 | ||||||||
| Most Recent Note - 3/1/2024 12:25:18 PM G - Perched within striking distance of its all-time high, showing resilience after testing support near its 50 DMA line ($292) last week. Fundamentals remain strong. >>> FEATURED STOCK ARTICLE : Volume Totals Cooking While Stubbornly Perched at All-Time High - 2/6/2024 | View all notes | Set NEW NOTE alert | Company Profile | SEC News | Chart | Request a new note | ||||||||
e.l.f. Beauty Cosmetics/Personal Care | $208.96 | -8.44 -3.88% | $221.83 | 1,889,911 50 DAV is 1,462,000 | $217.71 -4.02% | 1/2/2024 | $138.23 | PP = $153.63 |
| MB = $161.31 | ||||||||
| Most Recent Note - 3/1/2024 4:53:14 PM G - Posted an 8th consecutive gain today for yet another new all-time high. Reported Dec '23 quarterly earnings +54% on +85% sales revenues versus the year-ago period, continuing its strong earnings track record. Its 50 DMA line ($163.47) defines important near-term support to watch. >>> FEATURED STOCK ARTICLE : Peched at All-Time High With Earnings News Due - 2/5/2024 | View all notes | Set NEW NOTE alert | Company Profile | SEC News | Chart | Request a new note | ||||||||
Coca Cola Femsa Sab Ads Beverages-Non-Alcoholic | $95.84 | -1.12 -1.16% | $96.97 | 151,002 50 DAV is 163,900 | $104.38 -8.18% | 1/12/2024 | $93.38 | PP = $99.34 |
| MB = $104.31 | ||||||||
| Most Recent Note - 2/29/2024 12:49:31 PM Y - Its 50 DMA line ($95.17) defines important near-term support to watch while still sputtering after a noted "negative reversal" on 2/20/24 at its all-time high. Reported Dec ''23 quarterly earnings -13% on +24% sales revenues versus the year-ago period, raising fundamental concerns. >>> FEATURED STOCK ARTICLE : Perched at High With Earnings News Due - 2/21/2024 | View all notes | Set NEW NOTE alert | Company Profile | SEC News | Chart | Request a new note | ||||||||
Paccar Trucks and Parts-Hvy Duty | $112.29 | -0.90 -0.80% | $114.22 | 1,742,033 50 DAV is 2,129,000 | $113.35 -0.94% | 1/23/2024 | $100.35 | PP = $98.57 |
| MB = $103.50 | ||||||||
| Most Recent Note - 3/1/2024 4:56:57 PM G - Hit another new all-time high with today''s gain backed by average volume, getting more extended from any sound base. Its 50 DMA line ($101.55) defines near-term support to watch on pullbacks. Fundamentals remain strong. >>> FEATURED STOCK ARTICLE : Extended From Any Sound Base After 7 Weekly Gains - 2/26/2024 | View all notes | Set NEW NOTE alert | Company Profile | SEC News | Chart | Request a new note | ||||||||
| Symbol/Exchange Company Name Industry Group | PRICE | CHANGE | Day High | Volume (% DAV) (% 50 day avg vol) | 52 Wk Hi | Featured Date | Price Featured | Pivot Featured |
| Max Buy | ||||||||
Hubbell Electrical-Power/Equipmt | $387.74 | +2.97 0.77% | $392.98 | 437,267 50 DAV is 390,000 | $385.35 0.62% | 1/30/2024 | $343.26 | PP = $336.83 |
| MB = $353.67 | ||||||||
| Most Recent Note - 2/28/2024 4:56:23 PM G - Posted a small gain with average volume for another new all-time high, getting more extended from the previously noted base. Prior high ($340) and its 50 DMA line define important support to watch on pullbacks. See the latest FSU analysis for more details and a new annotated graph. >>> FEATURED STOCK ARTICLE : Inched to New Highs With Average Volume - 2/28/2024 | View all notes | Set NEW NOTE alert | Company Profile | SEC News | Chart | Request a new note | ||||||||
Manhattan Associates Computer Sftwr-Enterprse | $254.99 | -1.76 -0.69% | $257.67 | 290,511 50 DAV is 351,000 | $258.91 -1.51% | 1/31/2024 | $240.57 | PP = $230.71 |
| MB = $242.25 | ||||||||
| Most Recent Note - 2/27/2024 11:27:26 AM G - Perched near its all-time high with light volume behind today''s 4th consecutive small gain. Prior highs in the $230 area define near-term support to watch on pullbacks. >>> FEATURED STOCK ARTICLE : Hovering Near All-Time High After Streak of Small Gains - 2/29/2024 | View all notes | Set NEW NOTE alert | Company Profile | SEC News | Chart | Request a new note | ||||||||
Tenable Holdings Computer Sftwr-Security | $47.76 | -0.34 -0.71% | $48.19 | 627,480 50 DAV is 986,600 | $53.50 -10.73% | 2/7/2024 | $49.50 | PP = $49.87 |
| MB = $52.36 | ||||||||
| Most Recent Note - 2/27/2024 11:32:02 AM G - Its Relative Strength rating has slumped to 71, well below the 80+ minimum guideline for buy candidates. Finding support recently above the 50 DMA line ($47.14). Fundamentals remain strong. >>> FEATURED STOCK ARTICLE : Gap Up Gain Followed Latest Earnings Report - 2/7/2024 | View all notes | Set NEW NOTE alert | Company Profile | SEC News | Chart | Request a new note | ||||||||
U.S. Lime & Minerals Bldg-Cement/Concrt/Ag | $265.26 | +11.37 4.48% | $266.09 | 15,518 50 DAV is 18,000 | $266.88 -0.61% | 2/9/2024 | $254.68 | PP = $265.09 |
| MB = $278.34 | ||||||||
Y - Posted a solid gain today with below-average volume for a best-ever close near its all-time high. Subsequent gains and a close above the pivot point backed by at least +40% above average volume may trigger a conviciing new technical buy signal. Through Dec ''23 its quarterly and annual earnings (C and A criteria) history has been strong, a good match with the fact-based investment system''s guidelines. Thinly traded firm has only 5.7 million shares outstanding (S criteria), which can contribute to greater price volatility in the event of institutional buying or selling. >>> FEATURED STOCK ARTICLE : Strong Finish for Thinly Traded U.S Lime & Minerals - 2/9/2024 | View all notes | Set NEW NOTE alert | Company Profile | SEC News | Chart | Request a new note | ||||||||
ServiceNow Computer Sftwr-Enterprse | $776.09 | +2.46 0.32% | $777.88 | 985,469 50 DAV is 1,152,000 | $815.32 -4.81% | 2/22/2024 | $771.75 | PP = $815.32 |
| MB = $856.09 | ||||||||
| Most Recent Note - 2/29/2024 12:50:59 PM Y - Still consolidating above its 50 DMA line. A valid secondary buy point exists up to +5% above the latest high after finding support at its 10 WMA line following an earlier breakout. Fundamentals remain strong. >>> FEATURED STOCK ARTICLE : Found Support With a Solid Gap Up from 10-Week Moving Average - 2/23/2024 | View all notes | Set NEW NOTE alert | Company Profile | SEC News | Chart | Request a new note | ||||||||
| Symbol/Exchange Company Name Industry Group | PRICE | CHANGE | Day High | Volume (% DAV) (% 50 day avg vol) | 52 Wk Hi | Featured Date | Price Featured | Pivot Featured |
| Max Buy | ||||||||
Synopsys Computer Sftwr-Design | $594.32 | +2.97 0.50% | $604.35 | 1,060,434 50 DAV is 1,427,000 | $629.38 -5.57% | 2/22/2024 | $600.65 | PP = $582.85 |
| MB = $611.99 | ||||||||
| Most Recent Note - 3/1/2024 4:58:45 PM Y - Posted a gain today with below-average volume for a best-ever close. A strong volume-driven gain and close above the pivot point is needed to clinch a proper technical buy signal. Found support recently at its 50 DMA line ($538). Reported Jan ''24 quarterly earnings +36% on +21% sales revenues versus the year-ago period, its 3rd strong quarter above the +25% minimum earnings guideline (C criteria). Annual earnings growth (A criteria) has been strong and steady. >>> FEATURED STOCK ARTICLE : Gapped Up for New High But Ended Near Session Low - 2/22/2024 | View all notes | Set NEW NOTE alert | Company Profile | SEC News | Chart | Request a new note | ||||||||
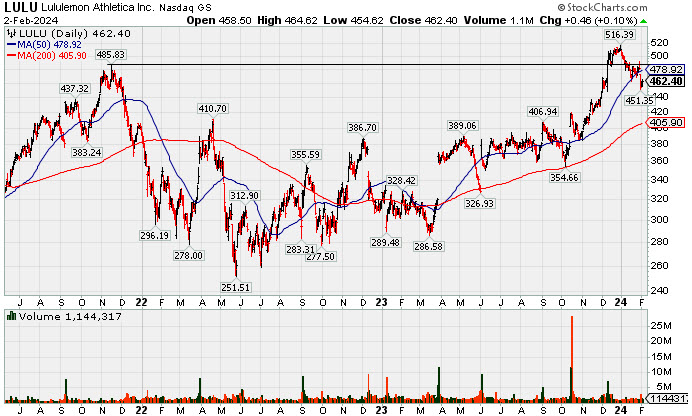
Violation of 50-Day Moving Average Hurt Outlook - Friday, February 2, 2024
Lululemon Athletica (LULU -$0.59 or -0.13% to $461.35) held its ground for the past 2 sessions after gapping down on 1/31/24 violating its 50-day moving average (DMA) line ($478.92) triggering a technical sell signal. The technical damage hurt the near-term outlook after it had already been sputtering. Only a prompt rebound above the 50 DMA line would help its outlook improve.
LULU was highlighted in yellow in the 12/08/23 mid-day report (read here) with pivot point cited based on its Nov '21 high plus 10 cents. It was shown in greater detail in this FSU section on 12/27/23 with an annotated graph on under the headline, "Perched at All-Time High With Volume Totals Cooling". Subsequent losses negated the breakout from a 2+ year base and raised noted concerns as it slumped back below $485.
LULU reported Oct '23 quarterly earnings +27% on +19% sales revenues versus the year-ago period. Three of the 4 latest quarterly comparisons were above the +25% minimum earnings guideline (C criteria). Annual earnings (A criteria) had a downturn in FY '21. It currently has a 98 Earnings Per Share Rating. Its Timeliness rating is A and Sponsorship rating is C.
The current Up/Down Volume Ratio of 1.4 is an unbiased indication its shares have been under accumulation over the past 50 days. The number of top-rated funds owning its shares rose from 2,104 in Mar '23 to 2,491 in Dec '23, a good sign concerning the I criteria.
Charts courtesy of www.stockcharts.com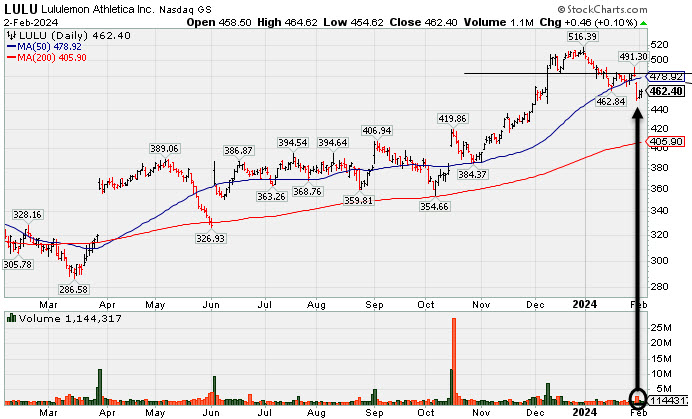
Perched at All-Time High With Volume Totals Cooling - Wednesday, December 27, 2023
Lululemon Athletica (LULU +$2.49 or +0.49% to $508.81) is hovering at its all-time high with light volume totals recently. Its 2021 high of $485 defines initial support to watch after its recent breakout from a 2+ year base.
LULU was highlighted in yellow in the 12/08/23 mid-day report (read here) with pivot point cited based on its Nov '21 high plus 10 cents. It hit new 52-week and all-time highs with a considerable gain backed by +222% above average volume triggering a technical buy signal. LULU was shown in greater detail in this FSU section that evening with an annotated graph on under the headline, "Lululemon Breaks Out to New All-Time High".
LULU reported Oct '23 quarterly earnings +27% on +19% sales revenues versus the year-ago period. Three of the 4 latest quarterly comparisons were above the +25% minimum earnings guideline (C criteria). Annual earnings (A criteria) had a downturn in FY '21. It currently has a 98 Earnings Per Share Rating. Its Timeliness rating is A and Sponsorship rating is C.
The current Up/Down Volume Ratio of 1.1 is an unbiased indication its shares have been under slight accumulation over the past 50 days. The number of top-rated funds owning its shares rose from 2,100 in Mar '23 to 2,209 in Sep '23, a good sign concerning the I criteria.
Charts courtesy of www.stockcharts.com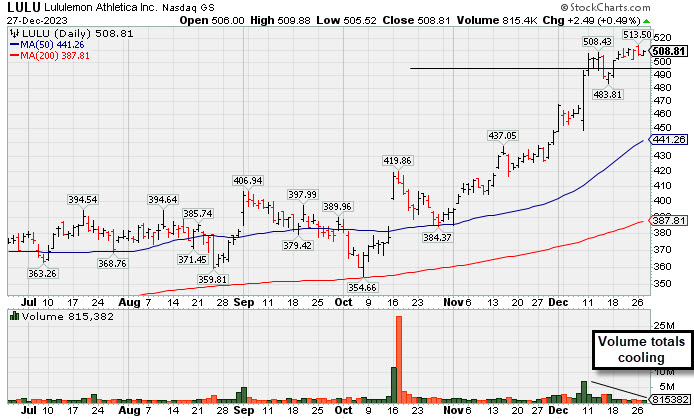
| Symbol/Exchange Company Name Industry Group | PRICE | CHANGE | Day High | Volume (% DAV) (% 50 day avg vol) | 52 Wk Hi | Featured Date | Price Featured | Pivot Featured |
| Max Buy | ||||||||
Arista Networks Computer-Networking | $237.76 | +0.23 0.10% | $239.00 | 604,355 50 DAV is 2,183,000 | $240.68 -1.21% | 10/31/2023 | $188.84 | PP = $198.80 |
| MB = $208.74 | ||||||||
| Most Recent Note - 12/26/2023 8:38:00 PM G - Hovering near its all-time high, extended from any sound base. Its 50 DMA line ($212) defines near-term support above the prior low in the $210 area. Fundamentals remain strong. See the latest FSU analysis for more details and a new annotated graph. >>> FEATURED STOCK ARTICLE : Extended From Base and Hovering at All-Time High - 12/26/2023 | View all notes | Set NEW NOTE alert | Company Profile | SEC News | Chart | Request a new note | ||||||||
Novo Nordisk ADR Medical-Ethical Drugs | $103.69 | +1.01 0.98% | $103.81 | 2,247,736 50 DAV is 4,237,000 | $105.69 -1.89% | 11/2/2023 | $100.97 | PP = $104.10 |
| MB = $109.31 | ||||||||
| Most Recent Note - 12/21/2023 4:58:05 PM Y - Posted a 4th consecutive gain today, wedging further above its 50 DMA line ($99.59) toward its high. Its 50 DMA line defines initial support above the recent low ($94.73 on 12/11/23) on pullbacks. >>> FEATURED STOCK ARTICLE : Managed a "Positive Reversal" but Still Below 50-Day Moving Average - 12/11/2023 | View all notes | Set NEW NOTE alert | Company Profile | SEC News | Chart | Request a new note | ||||||||
Qualys Computer Sftwr-Security | $201.61 | -1.47 -0.72% | $203.45 | 159,997 50 DAV is 372,000 | $206.35 -2.30% | 11/3/2023 | $167.50 | PP = $165.03 |
| MB = $173.28 | ||||||||
G - Pulled back today for a 2nd loss with light volume, consolidating after a streak of 10 consecutive gains for new all-time highs. It is very extended from any sound base. Its 50 DMA line ($177.60) defines initial support to watch. >>> FEATURED STOCK ARTICLE : Extended From Base Following Big Breakout - 12/12/2023 | View all notes | Set NEW NOTE alert | Company Profile | SEC News | Chart | Request a new note | ||||||||
Axon Enterprise Security/Sfty | $259.21 | +1.10 0.43% | $259.95 | 340,423 50 DAV is 444,000 | $260.69 -0.57% | 11/8/2023 | $127.84 | PP = $223.30 |
| MB = $234.47 | ||||||||
| Most Recent Note - 12/21/2023 5:01:37 PM G - Posted a gain today with lighter volume for a best-ever close. On pullbacks, the prior highs in the $229-231 area define near-term support to watch above its 50-day moving average (DMA) line ($225.62). >>> FEATURED STOCK ARTICLE : Axon Enterprise Hits New High With 6th Straight Gain - 12/13/2023 | View all notes | Set NEW NOTE alert | Company Profile | SEC News | Chart | Request a new note | ||||||||
TransDigm Group Aerospace/Defense | $1,007.99 | -0.98 -0.10% | $1,012.44 | 148,269 50 DAV is 228,000 | $1,015.72 -0.76% | 12/12/2023 | $1,000.39 | PP = $1,013.18 |
| MB = $1,063.84 | ||||||||
| Most Recent Note - 12/26/2023 8:41:22 PM Y - Posted a 3rd consecutive gain backed by light volume for its second-best ever close. The new pivot point cited was based on its 11/14/23 high plus 10 cents, however, gains above the pivot point were not backed by the +40% above-average volume necessary to trigger a proper new technical buy signal. Fundamentals remain strong. Recent lows in the $950 area define near-term support to watch on pullbacks. >>> FEATURED STOCK ARTICLE : Volume-Driven Loss Breaks Streak of 6 Straight Gains - 12/14/2023 | View all notes | Set NEW NOTE alert | Company Profile | SEC News | Chart | Request a new note | ||||||||
| Symbol/Exchange Company Name Industry Group | PRICE | CHANGE | Day High | Volume (% DAV) (% 50 day avg vol) | 52 Wk Hi | Featured Date | Price Featured | Pivot Featured |
| Max Buy | ||||||||
Palo Alto Networks Computer Sftwr-Security | $297.50 | -3.32 -1.10% | $300.89 | 1,821,896 50 DAV is 4,398,000 | $318.00 -6.45% | 11/13/2023 | $255.90 | PP = $266.00 |
| MB = $279.30 | ||||||||
G - Pulled back today with light volume and volume totals have been cooling while still consolidating near its all-time high. Prior highs in the $265 area define important support to watch along with its 50 DMA line ($270). Fundamentals remain strong. >>> FEATURED STOCK ARTICLE : Consolidating After Volume-Driven Gains for All-Time Highs - 12/15/2023 | View all notes | Set NEW NOTE alert | Company Profile | SEC News | Chart | Request a new note | ||||||||
United Rentals Comml Svcs-Leasing | $578.86 | -1.61 -0.28% | $582.41 | 488,383 50 DAV is 811,000 | $585.50 -1.13% | 12/1/2023 | $499.51 | PP = $488.73 |
| MB = $513.17 | ||||||||
| Most Recent Note - 12/21/2023 4:59:10 PM G - Posted a gain today with below-average volume, hovering near its all-time high. On pullbacks, the prior highs define near-term support to watch above its 50 DMA line ($467). >>> FEATURED STOCK ARTICLE : Perched Near All-Time High Following Volume-Driven Gains - 12/19/2023 | View all notes | Set NEW NOTE alert | Company Profile | SEC News | Chart | Request a new note | ||||||||
Amphastar Pharm Medical-Biomed/Biotech | $62.96 | +0.45 0.72% | $63.67 | 306,366 50 DAV is 421,000 | $67.66 -6.95% | 12/4/2023 | $60.84 | PP = $58.35 |
| MB = $61.27 | ||||||||
| Most Recent Note - 12/21/2023 4:55:41 PM Y - Posted a gain with light volume today. It is above the pivot point cited based on its 11/21/23 high after a cup-with-handle base. Volume totals have been cooling while consolidating. Little resistance remains due to overhead supply. Fundamentals remain strong. See the latest FSU analysis for more details and a new annotated graph. >>> FEATURED STOCK ARTICLE : Consolidating Above Pivot Point With Volume Cooling - 12/21/2023 | View all notes | Set NEW NOTE alert | Company Profile | SEC News | Chart | Request a new note | ||||||||
The Bancorp Banks-Northeast | $39.85 | -0.50 -1.24% | $40.30 | 321,920 50 DAV is 436,000 | $42.46 -6.15% | 12/4/2023 | $39.88 | PP = $41.62 |
| MB = $43.70 | ||||||||
| Most Recent Note - 12/22/2023 11:14:13 PM Y - Posted a small gain on lighter volume today after 2 "negative reversals" at its all-time high sputtering back below its pivot point. Subsequent gains and a strong close above the pivot point backed by at least +40% above average volume may trigger a proper technical buy signal. See the latest FSU analysis for more details and a new annotated graph. >>> FEATURED STOCK ARTICLE : Negative Reversals are Signs of Distributional Pressure - 12/22/2023 | View all notes | Set NEW NOTE alert | Company Profile | SEC News | Chart | Request a new note | ||||||||
lululemon athletica Retail-Apparel/Shoes/Acc | $508.81 | +2.49 0.49% | $509.88 | 815,440 50 DAV is 2,391,000 | $513.50 -0.91% | 12/8/2023 | $490.61 | PP = $485.93 |
| MB = $510.23 | ||||||||
Y - Hovering near its all-time high but still below its "max buy" level with volume totals cooling. Its 2021 high of $485 defines initial support to watch after its recent breakout from a 2+ year base. See the latest FSU analysis for more details and a new annotated graph. >>> FEATURED STOCK ARTICLE : Perched at All-Time High With Volume Totals Cooling - 12/27/2023 | View all notes | Set NEW NOTE alert | Company Profile | SEC News | Chart | Request a new note | ||||||||
| Symbol/Exchange Company Name Industry Group | PRICE | CHANGE | Day High | Volume (% DAV) (% 50 day avg vol) | 52 Wk Hi | Featured Date | Price Featured | Pivot Featured |
| Max Buy | ||||||||
Lululemon Breaks Out to New All-Time High - Friday, December 8, 2023
Lululemon Athletica (LULU +$24.97 or +5.37% to $489.64) was highlighted in yellow in the earlier mid-day report (read here) with pivot point cited based on its Nov '21 high plus 10 cents. It hit new 52-week and all-time highs with today's considerable gain backed by +222% above average volume triggering a technical buy signal, rallying from a 2-year long base. Its 200 DMA line acted as support in recent months.
LULU reported Oct '23 quarterly earnings +27% on +19% sales revenues versus the year-ago period. Three of the 4 latest quarterly comparisons were above the +25% minimum earnings guideline (C criteria). Annual earnings (A criteria) had a downturn in FY '21. It currently has a 98 Earnings Per Share Rating. Its Timeliness rating is A and Sponsorship rating is C.
The current Up/Down Volume Ratio of 1.0 is an unbiased indication its shares have been neutral concerning accumulation/distribution over the past 50 days. The number of top-rated funds owning its shares rose from 2,100 in Mar '23 to 2,204 in Sep '23, a good sign concerning the I criteria.
LULU was last shown in this FSU section with an annotated graph on 2/20/20 under the headline, "Perched at Record High After 4th Consecutive Gain on Light Volume". It then pulled back abruptly at the start of the pandemic but recovered and rallied impressively in the months that folllowed. LULU was first featured in yellow at $23.83 (split adjusted after 2:1 split effective 7/21/11) in the October 8, 2010 mid-day report (read here) and it traded up as much as +163.7% in a little more than 9 months.
Charts courtesy of www.stockcharts.com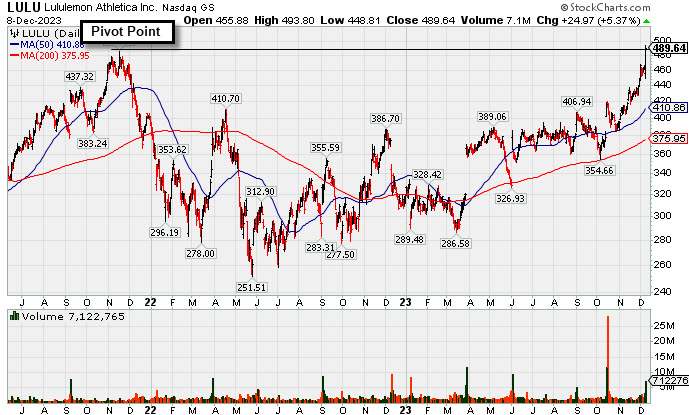
Perched at Record High After 4th Consecutive Gain on Light Volume - Thursday, February 20, 2020
Lululemon Athletica (LULU +$1.17 or +0.45% to $263.68) is extended from any sound base and it hit yet another new all-time high with today's 4th consecutive gain backed by light volume. Its 50-day moving average (DMA) line ($239) and prior low ($231.84 on 1/27/20) define important near-term support to watch. Fundamentals remain strong.
LULU was last shown in this FSU section was on 1/30/20 with an annotated graph under the headline, "Volume Totals Cooling While Hovering Near All-Time High". It reported earnings +28% on +23% sales revenues for the Oct '19 quarter. LULU has reported 8 consecutive quarterly earnings comparisons above the +25% minimum guideline (C criteria). It currently has a 96 Earnings Per Share Rating. Its Timeliness rating is A and Sponsorship rating is C.
The current Up/Down Volume Ratio of 1.0 is an unbiased indication its shares have been neutral concerning accumulation/distribution over the past 50 days. The number of top-rated funds owning its shares rose from 1,041 in Jun '18 to 1,468 in Dec '19, a good sign concerning the I criteria. It has a new CEO as of 8/20/18.
LULU was first featured in yellow at $23.83 (split adjusted after 2:1 split effective 7/21/11) in the October 8, 2010 mid-day report (read here) and it traded up as much as +163.7% in a little more than 9 months. As previously noted - "In a bullish market, many high-ranked leaders offer multiple opportunities to accumulate their shares under the fact-based system's strict guidelines. Patience may often allow another ideal base or secondary buy point to possibly develop and be noted."
Charts courtesy of www.stockcharts.com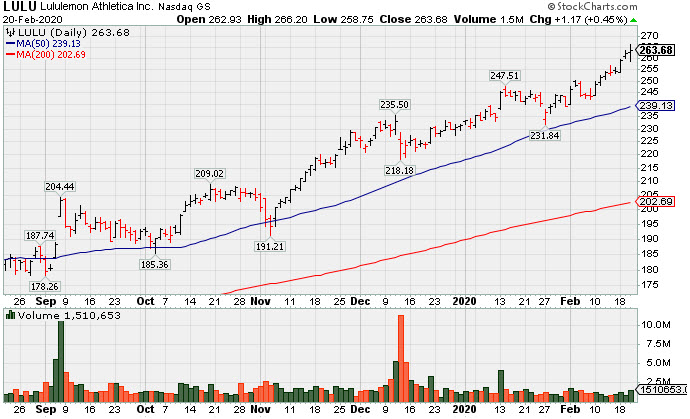
Volume Totals Cooling While Hovering Near All-Time High - Thursday, January 30, 2020
Lululemon Athletica (LULU +$0.11 or +0.05% to $243.77) is extended from any sound base and hovering near its all-time high with volume totals cooling. Its 50-day moving average (DMA) line ($231.34) and prior low ($218.18 on 12/12/19) define important near-term support to watch. Fundamentals remain strong.
LULU was last shown in this FSU section was on 1/09/20 with an annotated graph under the headline, "Perched at All-Time High After Gains Lacking Great Volume". It reported earnings +28% on +23% sales revenues for the Oct '19 quarter. LULU has reported 8 consecutive quarterly earnings comparisons above the +25% minimum guideline (C criteria). It currently has a 96 Earnings Per Share Rating. Its Timeliness rating is A and Sponsorship rating is C.
The current Up/Down Volume Ratio of 1.1 is an unbiased indication its shares have been under slight accumulation over the past 50 days. The number of top-rated funds owning its shares rose from 1,041 in Jun '18 to 1,454 in Dec '19, a good sign concerning the I criteria. It has a new CEO as of 8/20/18.
LULU was first featured in yellow at $23.83 (split adjusted after 2:1 split effective 7/21/11) in the October 8, 2010 mid-day report (read here) and it traded up as much as +163.7% in a little more than 9 months. As previously noted - "In a bullish market, many high-ranked leaders offer multiple opportunities to accumulate their shares under the fact-based system's strict guidelines. Patience may often allow another ideal base or secondary buy point to possibly develop and be noted."
Charts courtesy of www.stockcharts.com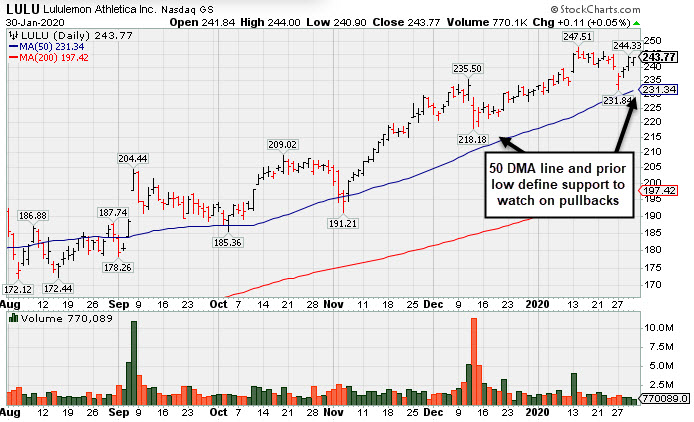
Perched at All-Time High After Gains Lacking Great Volume - Thursday, January 9, 2020
Lululemon Athletica (LULU-$1.37 or -0.58% to $235.90) reversed into the red today after recently wedging to new all-time highs with gains lacking great volume conviction. It is very extended from any sound base. Its 50-day moving average (DMA) line ($221.02) and prior low ($218.18 on 12/12/19) define important near-term support levels to watch on pullbacks.
LULU was last shown in this FSU section was on 12/17/19 with an annotated graph under the headline, "Retreated From High After Another Strong Earnings Report". It reported earnings +28% on +23% sales revenues for the Oct '19 quarter. LULU has reported 8 consecutive quarterly earnings comparisons above the +25% minimum guideline (C criteria). It currently has a 96 Earnings Per Share Rating. Its Timeliness rating is A and Sponsorship rating is C.
The current Up/Down Volume Ratio of 1.1 is an unbiased indication its shares have been under slight accumulation over the past 50 days. The number of top-rated funds owning its shares rose from 1,041 in Jun '18 to 1,443 in Sep '19, a good sign concerning the I criteria. It has a new CEO as of 8/20/18.
LULU was first featured in yellow at $23.83 (split adjusted after 2:1 split effective 7/21/11) in the October 8, 2010 mid-day report (read here) and it traded up as much as +163.7% in a little more than 9 months. As previously noted - "In a bullish market, many high-ranked leaders offer multiple opportunities to accumulate their shares under the fact-based system's strict guidelines. Patience may often allow another ideal base or secondary buy point to possibly develop and be noted."
Charts courtesy of www.stockcharts.com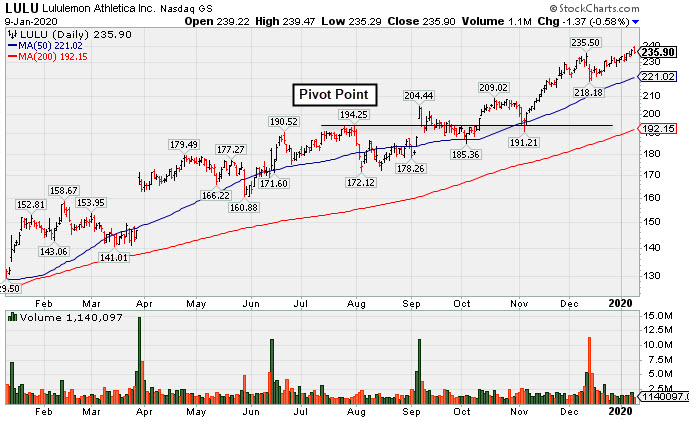
Retreated From High After Another Strong Earnings Report - Tuesday, December 17, 2019
Lululemon Athletica (LULU -$2.37 or -1.05% to $222.98) recently has suffered losses on heavy volume after it reported earnings +28% on +23% sales revenues for the Oct '19 quarter. It is very extended from any sound base. Its 50-day moving average (DMA) line ($212.49) and prior high in the $209 area define important near-term support levels to watch.
LULU was last shown in this FSU section was on 11/26/19 with an annotated graph under the headline, "New High Close Stretches Already Extended Leader". LULU has reported 8 consecutive quarterly earnings comparisons above the +25% minimum guideline (C criteria). It currently has a 96 Earnings Per Share Rating. Its Timeliness rating is A and Sponsorship rating is C.
The current Up/Down Volume Ratio of 1.2 is an unbiased indication its shares have been under slight accumulation over the past 50 days. The number of top-rated funds owning its shares rose from 1,041 in Jun '18 to 1,427 in Sep '19, a good sign concerning the I criteria. It has a new CEO as of 8/20/18.
LULU was first featured in yellow at $23.83 (split adjusted after 2:1 split effective 7/21/11) in the October 8, 2010 mid-day report (read here) and it traded up as much as +163.7% in a little more than 9 months. As previously noted - "In a bullish market, many high-ranked leaders offer multiple opportunities to accumulate their shares under the fact-based system's strict guidelines. Patience may often allow another ideal base or secondary buy point to possibly develop and be noted."
Charts courtesy of www.stockcharts.com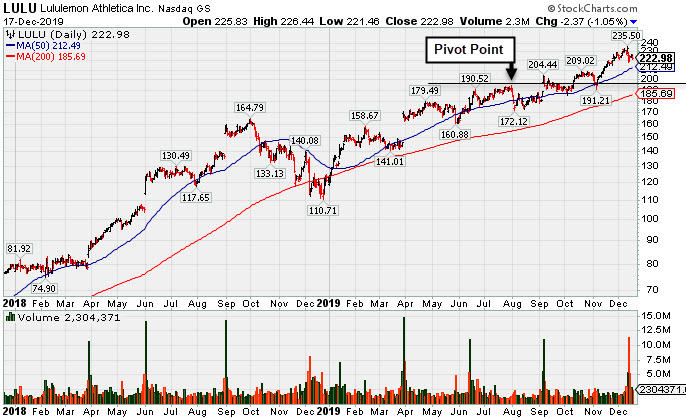
New High Close Stretches Already Extended Leader - Tuesday, November 26, 2019
Lululemon Athletica (LULU +$0.68 or +0.31% to $222.84) is extended from any sound base and managed a new all-time high close with today's gain. It found prompt support near its 50-day moving average (DMA) line ($202.73) on pullbacks during its ongoing ascent. The prior low ($191.21 on 11/05/19) defines the next important near-term support.
It was last shown in this FSU section was on 11/04/19 with an annotated graph under the headline, "Testing 50-Day Moving Average With Loss on Above Average Volume". LULU reported earnings +35% on +22% sales revenues for the Jul '19 quarter, marking its 7th consecutive quarterly comparison above the +25% minimum guideline (C criteria). Recent quarterly comparisons showed stronger sales revenues and earnings improvement helping it match with the fact-based investment system's fundamental guidelines. It has a new CEO as of 8/20/18. It currently has a 96 Earnings Per Share Rating. Its Timeliness rating is A and Sponsorship rating is C.
The number of top-rated funds owning its shares rose from 1,041 in Jun '18 to 1,421 in Sep '19, a good sign concerning the I criteria. LULU was first featured in yellow at $23.83 (split adjusted after 2:1 split effective 7/21/11) in the October 8, 2010 mid-day report (read here) and it traded up as much as +163.7% in a little more than 9 months. As previously noted - "In a bullish market, many high-ranked leaders offer multiple opportunities to accumulate their shares under the fact-based system's strict guidelines. Patience may often allow another ideal base or secondary buy point to possibly develop and be noted."
Charts courtesy of www.stockcharts.com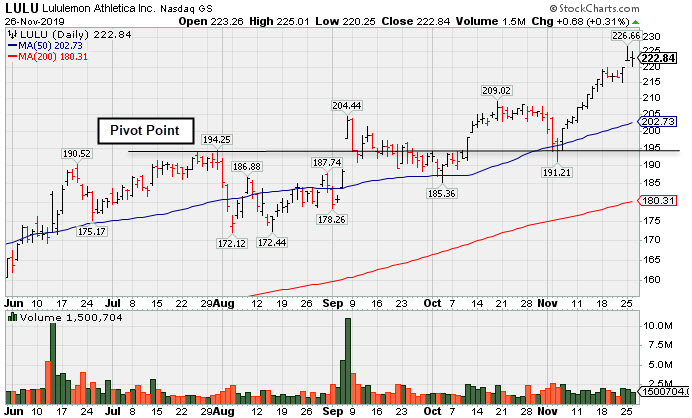
Testing 50-Day Moving Average With Loss on Above Average Volume - Monday, November 4, 2019
Lululemon Athletica (LULU -$4.21 or -2.10% to $196.48) pulled back for a 3rd consecutive loss today with higher volume while testing support at its 50-day moving average (DMA) line. More damaging losses may trigger a technical sell signal.
Recent gains into new high territory were lacking great volume conviction indicative of institutional buying demand. It was last shown in this FSU section was on 10/18/19 with an annotated graph under the headline, "LULU Stretches to Hit New Record High". The recent low ($185.36 on 10/03/19) defines important near-term support where any violation would raise serious concerns and trigger a worrisome technical sell signal.
LULU reported earnings +35% on +22% sales revenues for the Jul '19 quarter, marking its 7th consecutive quarterly comparison above the +25% minimum guideline (C criteria). Recent quarterly comparisons showed stronger sales revenues and earnings improvement helping it match with the fact-based investment system's fundamental guidelines. It has a new CEO as of 8/20/18. It currently has a 96 Earnings Per Share Rating. Its Timeliness rating is A and Sponsorship rating is C.
The number of top-rated funds owning its shares rose from 1,041 in Jun '18 to 1,432 in Sep '19, a good sign concerning the I criteria. LULU was first featured in yellow at $23.83 (split adjusted after 2:1 split effective 7/21/11) in the October 8, 2010 mid-day report (read here) and it traded up as much as +163.7% in a little more than 9 months. As previously noted - "In a bullish market, many high-ranked leaders offer multiple opportunities to accumulate their shares under the fact-based system's strict guidelines. Patience may often allow another ideal base or secondary buy point to possibly develop and be noted."
Charts courtesy of www.stockcharts.com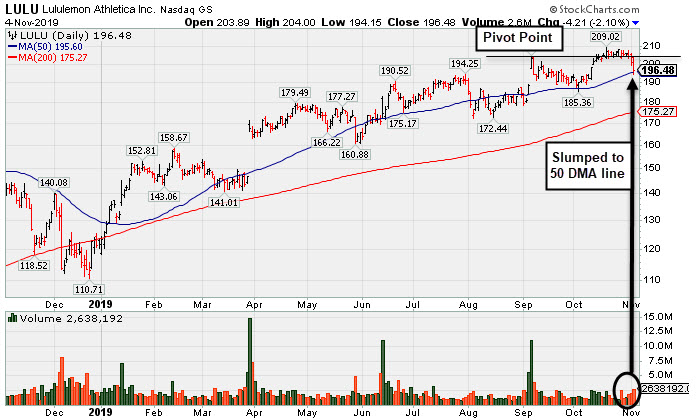
LULU Stretches to Hit New Record High - Friday, October 18, 2019
Lululemon Athletica (LULU +$2.15 or +1.05% to $207.11) hit a new all-time high with today's gain backed by +28% above average volume. Its color code was changed to green after rising above its "max buy" level. Disciplined investors avid chasing stocks extended more than +5% from a sound base.
It has shown bullish action since last shown in this FSU section was on 10/03/19 with an annotated graph under the headline, "Found Support After Undercutting 50-Day Moving Average". The 50-day moving average (DMA) line ($190.12) and the recent low ($185.36 on 10/03/19) define important near-term support where more damaging losses would raise serious concerns and trigger technical sell signals.
LULU reported earnings +35% on +22% sales revenues for the Jul '19 quarter, marking its 7th consecutive quarterly comparison above the +25% minimum guideline (C criteria). Recent quarterly comparisons showed stronger sales revenues and earnings improvement helping it match with the fact-based investment system's fundamental guidelines. It has a new CEO as of 8/20/18. It currently has a 96 Earnings Per Share Rating. Its Timeliness rating is A and Sponsorship rating is C.
The number of top-rated funds owning its shares rose from 1,041 in Jun '18 to 1,427 in Sep '19, a good sign concerning the I criteria. LULU was first featured in yellow at $23.83 (split adjusted after 2:1 split effective 7/21/11) in the October 8, 2010 mid-day report (read here) and it traded up as much as +163.7% in a little more than 9 months. As previously noted - "In a bullish market, many high-ranked leaders offer multiple opportunities to accumulate their shares under the fact-based system's strict guidelines. Patience may often allow another ideal base or secondary buy point to possibly develop and be noted."
Charts courtesy of www.stockcharts.com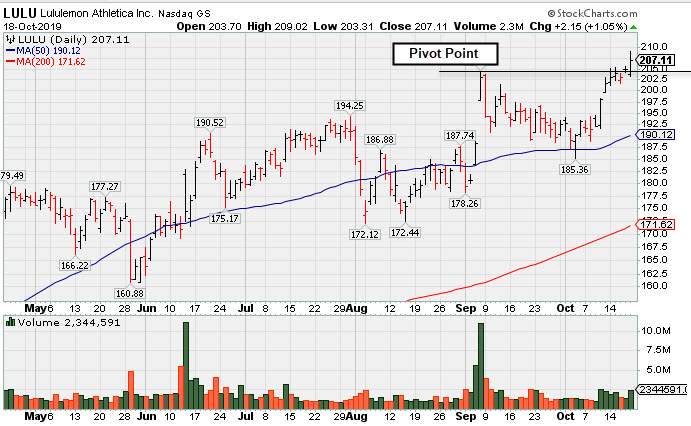
Found Support After Undercutting 50-Day Moving Average - Thursday, October 3, 2019
Lululemon Athletica (LULU +$1.02 or +0.54% to $190.15) has recently been sputtering below the prior high ($194.25) raising concerns. It found support today at its 50-day moving average DMA line ($187.17). More damaging losses would raise concerns and trigger a technical sell signal.
It has shown some resilience since last shown in this FSU section was on 9/18/19 with an annotated graph under the headline, "Consolidating Near Prior High Following Latest Breakout". LULU reported earnings +35% on +22% sales revenues for the Jul '19 quarter, marking its 7th consecutive quarterly comparison above the +25% minimum guideline (C criteria). Recent quarterly comparisons showed stronger sales revenues and earnings improvement helping it match with the fact-based investment system's fundamental guidelines. It has a new CEO as of 8/20/18. It currently has a 96 Earnings Per Share Rating. Its Timeliness rating is A and Sponsorship rating is C.
The number of top-rated funds owning its shares rose from 1,041 in Jun '18 to 1,413 in Jun '19, a good sign concerning the I criteria. LULU was first featured in yellow at $23.83 (split adjusted after 2:1 split effective 7/21/11) in the October 8, 2010 mid-day report (read here) and it traded up as much as +163.7% in a little more than 9 months. As previously noted - "In a bullish market, many high-ranked leaders offer multiple opportunities to accumulate their shares under the fact-based system's strict guidelines. Patience may often allow another ideal base or secondary buy point to possibly develop and be noted."
Charts courtesy of www.stockcharts.com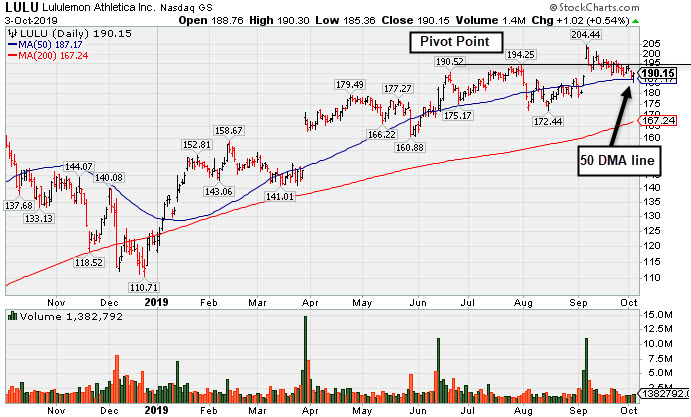
Consolidating Near Prior High Following Latest Breakout - Wednesday, September 18, 2019
Lululemon Athletica (LULU -$0.11 or -0.06% to $195.36) has been quietly hovering near its all-time high following volume driven gains. The prior high ($194.25) defines initial support to watch above its 50-day moving average (DMA) line ($186.41). It has shown some resilience since last shown in this FSU section was on 9/03/19 with an annotated graph under the headline, "Sank Below 50-Day Average Toward Prior Lows With High Volume".
LULU reported earnings +35% on +22% sales revenues for the Jul '19 quarter, marking its 7th consecutive quarterly comparison above the +25% minimum guideline (C criteria). Recent quarterly comparisons showed stronger sales revenues and earnings improvement helping it match with the fact-based investment system's fundamental guidelines. It has a new CEO as of 8/20/18. It currently has a 96 Earnings Per Share Rating. Its Timeliness rating is A and Sponsorship rating is C.
The number of top-rated funds owning its shares rose from 1,041 in Jun '18 to 1,419 in Jun '19, a good sign concerning the I criteria. LULU was first featured in yellow at $23.83 (split adjusted after 2:1 split effective 7/21/11) in the October 8, 2010 mid-day report (read here) and it traded up as much as +163.7% in a little more than 9 months. As previously noted - "In a bullish market, many high-ranked leaders offer multiple opportunities to accumulate their shares under the fact-based system's strict guidelines. Patience may often allow another ideal base or secondary buy point to possibly develop and be noted."
Charts courtesy of www.stockcharts.com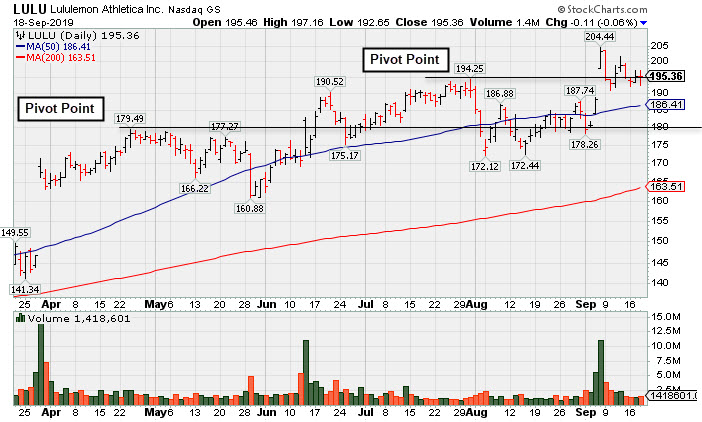
Sank Below 50-Day Average Toward Prior Lows With High Volume - Tuesday, September 3, 2019
Lululemon Athletica (LULU -$5.13 or -2.78% to $179.54) is sputtering below its 50-day moving average (DMA) line ($183.68) toward prior lows. It faces near-term resistance due to overhead supply up to the $194 level which may limit its ability to rally. Keep in mind that it is due to report earnings news on 9/05/19. Volume and volatility often increase near earnings news.
LULU reported Apr '19 quarterly earnings +35% on +20% sales revenues versus the year ago period, marking its 6th consecutive quarterly comparison above the +25% minimum guideline (C criteria). Recent quarterly comparisons showed stronger sales revenues and earnings improvement helping it match with the fact-based investment system's fundamental guidelines. It has a new CEO as of 8/20/18. It currently has a 95 Earnings Per Share Rating. Its Timeliness rating is B and Sponsorship rating is C.
Its last appearance in this FSU section was on 8/15/19 with an annotated graph under the headline, "Sputtering After Slump Below 50-Day Moving Average". Following a "breakaway gap" it was highlighted in yellow with pivot point cited based on its 10/01/18 high plus 10 cents in the 3/28/19 mid-day report (read here).
The number of top-rated funds owning its shares rose from 1,041 in Jun '18 to 1,418 in Jun '19, a good sign concerning the I criteria. LULU was first featured in yellow at $23.83 (split adjusted after 2:1 split effective 7/21/11) in the October 8, 2010 mid-day report (read here) and it traded up as much as +163.7% in a little more than 9 months. As previously noted - "In a bullish market, many high-ranked leaders offer multiple opportunities to accumulate their shares under the fact-based system's strict guidelines. Patience may often allow another ideal base or secondary buy point to possibly develop and be noted."
Charts courtesy of www.stockcharts.com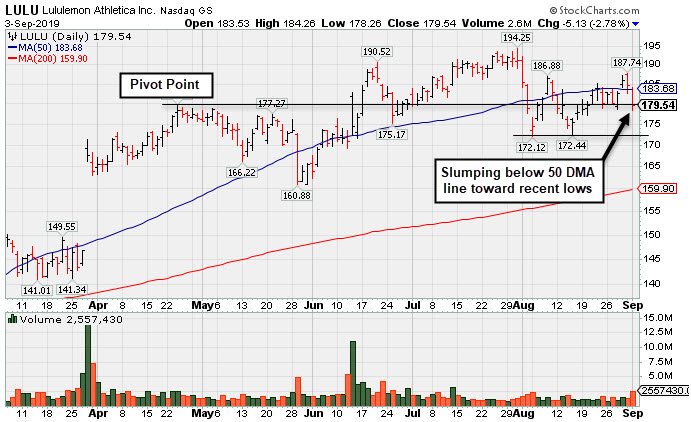
Sputtering After Slump Below 50-Day Moving Average - Thursday, August 15, 2019
Lululemon Athletica (LULU ) has been sputtering below its 50-day moving average (DMA) line ($182.80). A rebound above the 50 DMA line is needed to help its technical stance improve.
LULU reported Apr '19 quarterly earnings +35% on +20% sales revenues versus the ear ago period, marking its 6th consecutive quarterly comparison above the +25% minimum guideline (C criteria). Recent quarterly comparisons showed stronger sales revenues and earnings improvement helping it match with the fact-based investment system's fundamental guidelines. It has a new CEO as of 8/20/18. It currently has a 95 Earnings Per Share Rating. Its Timeliness rating is B and Sponsorship rating is C.
Its last appearance in this FSU section was on 7/17/19 with an annotated graph under the headline, "Quietly Hovering at All-Time High". Following a "breakaway gap" it was highlighted in yellow with pivot point cited based on its 10/01/18 high plus 10 cents in the 3/28/19 mid-day report (read here).
The number of top-rated funds owning its shares rose from 1,041 in Jun '18 to 1,406 in Jun '19, a good sign concerning the I criteria. LULU was first featured in yellow at $23.83 (split adjusted after 2:1 split effective 7/21/11) in the October 8, 2010 mid-day report (read here) and it traded up as much as +163.7% in a little more than 9 months. As previously noted - "In a bullish market, many high-ranked leaders offer multiple opportunities to accumulate their shares under the fact-based system's strict guidelines. Patience may often allow another ideal base or secondary buy point to possibly develop and be noted."
Charts courtesy of www.stockcharts.com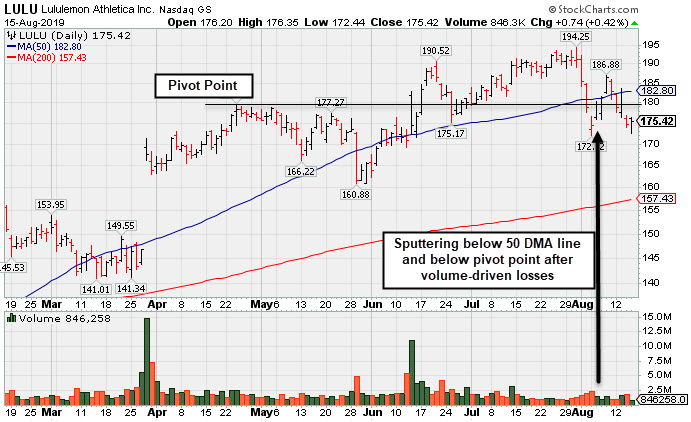
Quietly Hovering at All-Time High - Wednesday, July 17, 2019
Lululemon Athletica (LULU +$0.20 or +0.11% to $190.38) posted a small gain on light volume for its best-ever close while hovering near its all-time high. Its 50-day moving average (DMA) line ($177.14) defines important near-term support to watch on pullbacks.
It reported Apr '19 quarterly earnings +35% on +20% sales revenues versus the ear ago period, marking its 6th consecutive quarterly comparison above the +25% minimum guideline (C criteria). Recent quarterly comparisons showed stronger sales revenues and earnings improvement helping it match with the fact-based investment system's fundamental guidelines. It has a new CEO as of 8/20/18. It currently has a 95 Earnings Per Share Rating. Its Timeliness rating is A and Sponsorship rating is C.
Its last appearance in this FSU section was on 6/14/19 with an annotated graph under the headline, "Perched Near High Following Another Strong Earnings Report". Following a "breakaway gap" it was highlighted in yellow with pivot point cited based on its 10/01/18 high plus 10 cents in the 3/28/19 mid-day report (read here).
The number of top-rated funds owning its shares rose from 1,041 in Jun '18 to 1,351 in Mar '19, a good sign concerning the I criteria. LULU was first featured in yellow at $23.83 (split adjusted after 2:1 split effective 7/21/11) in the October 8, 2010 mid-day report (read here) and it traded up as much as +163.7% in a little more than 9 months. As previously noted - "In a bullish market, many high-ranked leaders offer multiple opportunities to accumulate their shares under the fact-based system's strict guidelines. Patience may often allow another ideal base or secondary buy point to possibly develop and be noted."
Charts courtesy of www.stockcharts.com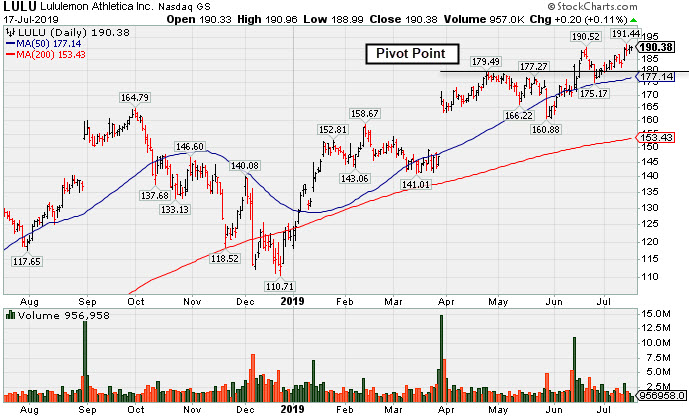
Perched Near High Following Another Strong Earnings Report - Friday, June 14, 2019
Lululemon Athletica (LULU +$2.19 or +1.25% to $176.71) is trading above its 50-day moving average (DMA) line ($172.36) after spiking to a new high on the prior session. Its color code was changed to yellow with new pivot point cited based on its 4/24/19 high plus 10 cents. A gain and strong close above the pivot point backed by at least +40% above average volume may trigger a new (or add-on) technical buy signal. The recent low ($160.88 on 5/29/19) defines important support near prior highs.
It reported Apr '19 quarterly earnings +35% on +20% sales revenues versus the ear ago period, marking its 6th consecutive quarterly comparison above the +25% minimum guideline (C criteria). Recent quarterly comparisons showed stronger sales revenues and earnings improvement helping it match with the fact-based investment system's fundamental guidelines. It has a new CEO as of 8/20/18. It currently has a 94 Earnings Per Share Rating. Its Timeliness rating is A and Sponsorship rating is C.
Its last appearance in this FSU section was on 5/10/19 with an annotated graph under the headline, "Volume Light While Hovering Near High". It was highlighted in yellow with pivot point cited based on its 10/01/18 high plus 10 cents in the 3/28/19 mid-day report (read here).
The number of top-rated funds owning its shares rose from 1,041 in Jun '18 to 1,346 in Mar '19, a good sign concerning the I criteria. LULU was first featured in yellow at $23.83 (split adjusted after 2:1 split effective 7/21/11) in the October 8, 2010 mid-day report (read here) and it traded up as much as +163.7% in a little more than 9 months. As previously noted - "In a bullish market, many high-ranked leaders offer multiple opportunities to accumulate their shares under the fact-based system's strict guidelines. Patience may often allow another ideal base or secondary buy point to possibly develop and be noted."
Charts courtesy of www.stockcharts.com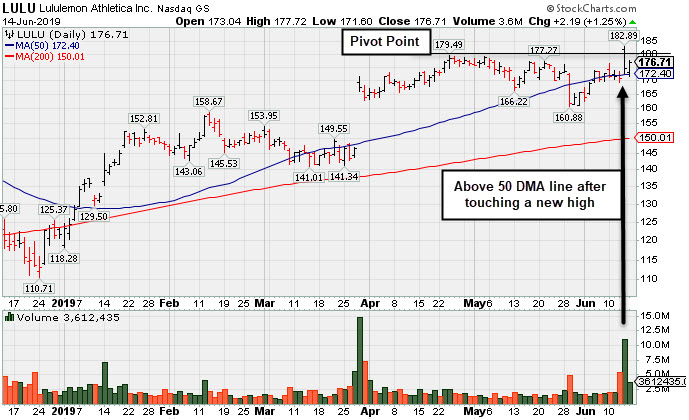
Volume Light While Hovering Near High - Friday, May 10, 2019
Lululemon Athletica (LULU -$0.03 or -0.02% to $173.68) has been quietly hovering near its high with volume totals cooling, action indicating that only few investors have been headed for the exit. Prior highs in the $164 area define initial support to watch above its 50-day moving average (DMA) line ($162.24).
Its last appearance in this FSU section was on 3/28/19 with an annotated graph under the headline, "Breakway Gap Backed by More Than 6 Times Average Volume" after highlighted in yellow with pivot point cited based on its 10/01/18 high plus 10 cents in the earlier mid-day report (read here).
LULU reported Jan '19 earnings +39% on +26% sales revenues, marking its 5th consecutive quarterly comparison above the +25% minimum guideline (C criteria). Recent quarterly comparisons showed encouraging acceleration in sales revenues and earnings improvement helping it match with the fact-based investment system's fundamental guidelines. It has a new CEO as of 8/20/18. It currently has a 92 Earnings Per Share Rating. Its Timeliness rating is B and Sponsorship rating is C.
The number of top-rated funds owning its shares rose from 1,041 in Jun '18 to 1,301 in Mar '19, a good sign concerning the I criteria. LULU was first featured in yellow at $23.83 (split adjusted after 2:1 split effective 7/21/11) in the October 8, 2010 mid-day report report (read here) and it traded up as much as +163.7% in a little more than 9 months. As previously noted - "In a bullish market, many high-ranked leaders offer multiple opportunities to accumulate their shares under the fact-based system's strict guidelines. Patience may often allow another ideal base or secondary buy point to possibly develop and be noted."
Charts courtesy of www.stockcharts.com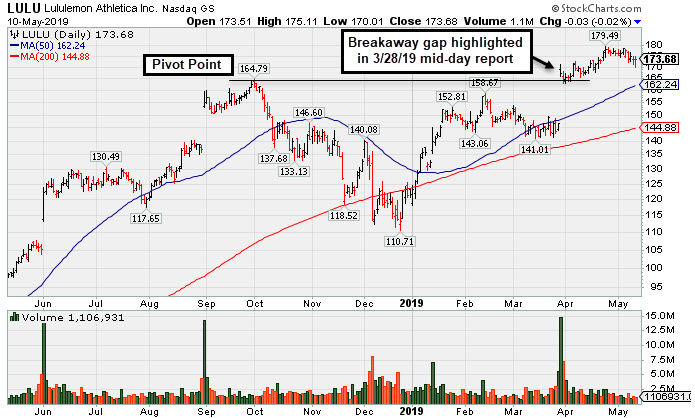
Breakway Gap Backed by More Than 6 Times Average Volume - Thursday, March 28, 2019
Often, when a leading stock is setting up to breakout of a solid base it is highlighted in the FACTBASEDINVESTING.com Mid-Day Breakouts Report. Sometimes stocks are highlighted shortly after a technical breakout, yet while the potential buy candidate may still be considered action-worthy. The most relevant factors are noted in the report which alerts prudent CANSLIM oriented investors to place the issue in their watch list. After doing any necessary backup research, the investor is prepared to act after the stock triggers a technical buy signal (breaks above its pivot point on more than +40% above average turnover) but before it gets too extended from a sound base. In the event the stock fails to trigger a technical buy signal and its price declines then it will simply be removed from the watch list. Disciplined investors know to buy as near as possible to the pivot point and avoid chasing stocks after they have rallied more than +5% above their pivot point. It is crucial to always limit losses whenever any stock heads the wrong direction, and disciplined investors sell if a struggling stock ever falls more than -7% from their purchase price.
Lululemon Athletica (LULU +$20.74 or +14.13% to $167.54) was highlighted in yellow with pivot point cited based on its 10/01/18 high plus 10 cents in the earlier mid-day report (read here). It hit a new high with today's "breakaway gap" and big volume-driven gain triggering a technical buy signal. Longtime members may recall that a breakaway gap is one noted exception to the rule that investors should not chase a stock more than +5% above prior highs, however, risk increases the further above the pivot point one buys any stock.
LULU reported Jan '19 earnings +39% on +26% sales revenues, marking its 5th consecutive quarterly comparison above the +25% minimum guideline (C criteria). Recent quarterly comparisons showed encouraging acceleration in sales revenues and earnings improvement helping it match with the fact-based investment system's fundamental guidelines. It has a new CEO as of 8/20/18. It currently has an 84 Earnings Per Share Rating. Its Timeliness rating is B and Sponsorship rating is C.
The number of top-rated funds owning its shares rose from 417 in Sep '11 to 1,200 in Dec '18, a good sign concerning the I criteria. LULU was first featured in yellow at $23.83 (split adjusted after 2:1 split effective 7/21/11) in the October 8, 2010 mid-day report report (read here) and it traded up as much as +163.7% in a little more than 9 months. As previously noted - "In a bullish market, many high-ranked leaders offer multiple opportunities to accumulate their shares under the fact-based system's strict guidelines. Patience may often allow another ideal base or secondary buy point to possibly develop and be noted." Its last appearance in this FSU section was on 12/28/12 with an annotated graph under the headline, "Formed New Base, But Yet To Trigger Technical Buy Signal".
Charts courtesy of www.stockcharts.com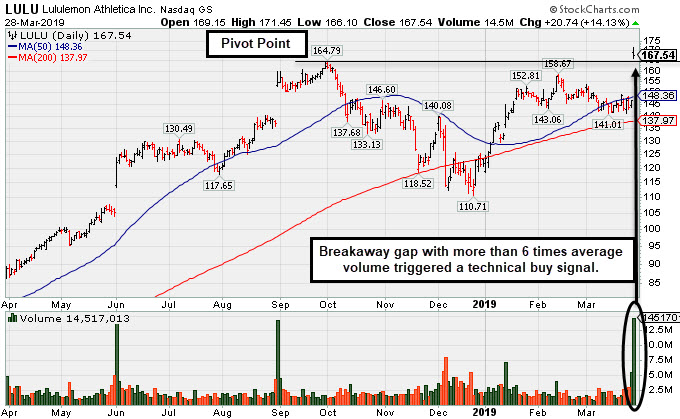
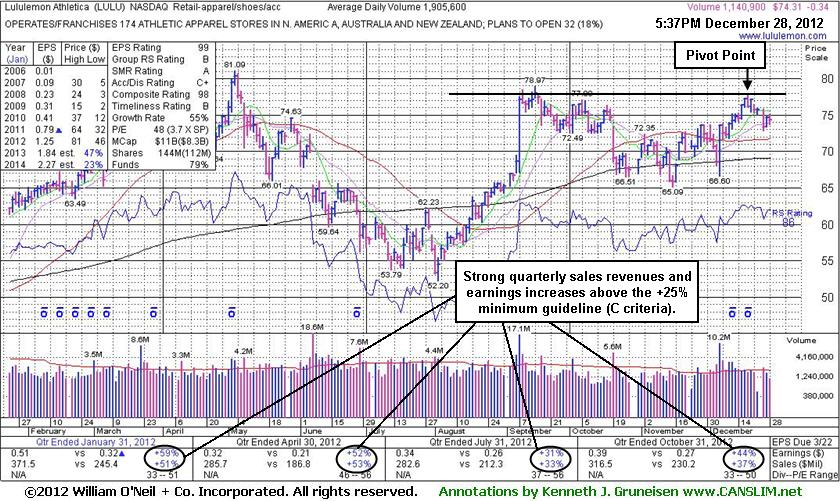
Formed New Base, But Yet To Trigger Technical Buy Signal - Friday, December 28, 2012
Often, when a leading stock is setting up to breakout of a solid base it is highlighted in CANSLIM.net's Mid-Day Breakouts Report. Sometimes stocks are highlighted shortly after a technical breakout, yet while the potential buy candidate may still be considered action-worthy. The most relevant factors are noted in the report which alerts prudent CANSLIM oriented investors to place the issue in their watch list. After doing any necessary backup research, the investor is prepared to act after the stock triggers a technical buy signal (breaks above its pivot point on more than +50% average turnover) but before it gets too extended from a sound base. In the event the stock fails to trigger a technical buy signal and its price declines then it will simply be removed from the watch list. Disciplined investors know to buy as near as possible to the pivot point and avoid chasing stocks after they have rallied more than +5% above their pivot point. It is crucial to always limit losses whenever any stock heads the wrong direction, and disciplined investors sell if a struggling stock ever falls more than -7% from their purchase price.
Lululemon Athletica (LULU -$0.34 or -0.46% to $74.31) was highlighted in yellow again with new pivot point cited based on its 12/19/12 high plus 10 cents when it showed up in the 12/26/12 mid-day report (read
here). It has encountered stubborn resistance in the $80 area. Subsequent volume-driven gains above its pivot point are still needed to trigger a new technical buy signal. Fundamentals (C and A criteria) remain strong and its resilience is encouraging. Keep in mind that the M criteria may also be an overriding concern arguing against new buying efforts in stocks until a new confirmed rally with a follow through day.Its last appearance in this FSU section was on 10/02/12 with an annotated graph under the headline, "Former Favorite Still Has Strong Characteristics", while building on a cup-with-handle base pattern. It did not yet trigger a technical buy signal. It found support near its 200-day moving average (DMA) line since dropped from the Featured Stocks list on 10/22/12 after violating its 50 DMA line with a damaging loss on heavy volume. However, it has rebounded impressively, and very little resistance remains due to overhead supply.
It reported earnings +44% on +37% sales revenues for the quarter ended October 31, 2012 versus the year ago period. The number of top-rated funds owning its shares rose from 417 in Sep '11 to 595 in Sep '12, a good sign concerning the I criteria. LULU was first featured in yellow at $23.83 (split adjusted after 2:1 split effective 7/21/11) in the October 8, 2010 mid-day report report (read here) and it traded up as much as +163.7% in a little more than 9 months. As previously noted - "In a bullish market, many high-ranked leaders offer multiple opportunities to accumulate their shares under the fact-based system's strict guidelines. Patience may often allow another ideal base or secondary buy point to possibly develop and be noted."
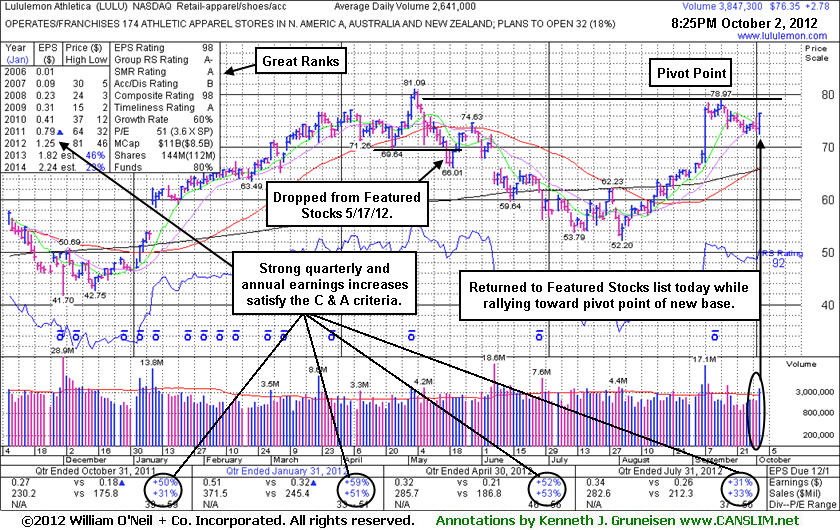
Former Favorite Still Has Strong Characteristics - Tuesday, October 02, 2012
Lululemon Athletica (LULU +$2.78 or +3.78% to $76.35) was highlighted in yellow in the earlier mid-day report (read here) with a new pivot point cited based on its 9/14/12 high while building on a cup-with-handle base pattern. It tallied a gain with higher volume, but did not yet trigger a technical buy signal. Volume-driven gains above its pivot point are necessary to confirm a technical buy signal before action may be justified by disciplined investors. Fundamentals remain strong (good C and A criteria) based on its strong quarterly and annual earnings history.
Its last appearance in this FSU section was on 4/12/12 with an annotated graph under the headline, "Violation of Upward Trend Line Cited as Early Sell Signal". It then rebounded and rallied to new all-time highs, but promptly reversed and undercut its 50-day moving average (DMA) line and prior lows in the weeks that followed. After dropped from the Featured Stocks list on 5/17/12 it went through a deep consolidation below its 200 DMA line, however it has since rebounded and very little resistance remains due to overhead supply.
It reported earnings +31% on +33% sales revenues for the quarter ended July 31, 2012 versus the year ago period. The number of top-rated funds owning its shares rose from 417 in Sep '11 to 565 in Jun '12, a good sign concerning the I criteria. LULU was first featured in yellow at $23.83 (split adjusted after 2:1 split effective 7/21/11) in the October 8, 2010 mid-day report report (read here) and it traded up as much as +163.7% in a little more than 9 months. As previously noted - "In a bullish market, many high-ranked leaders offer multiple opportunities to accumulate their shares under the fact-based system's strict guidelines. Patience may often allow another ideal base or secondary buy point to possibly develop and be noted."
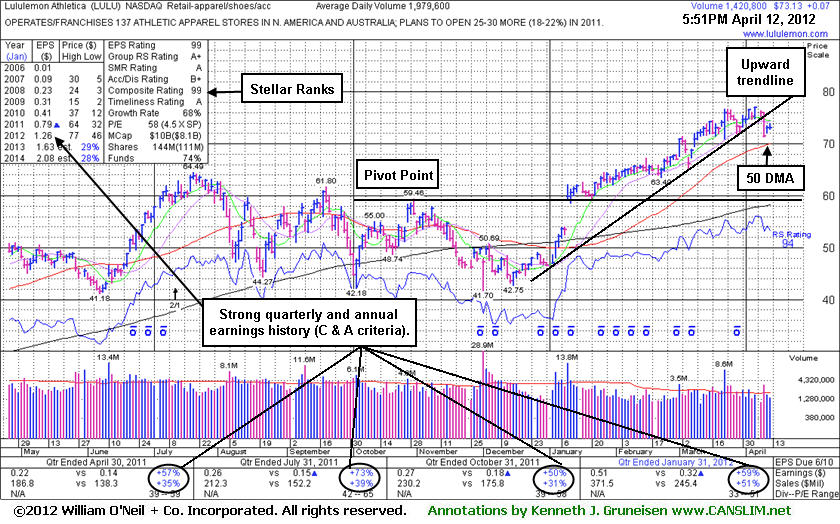
Violation of Upward Trend Line Cited as Early Sell Signal - Thursday, April 12, 2012
Lululemon Athletica (LULU +$0.07 or +0.10% to $73.13) quietly held its ground today. It was down considerably on Tuesday with above average volume, enduring distributional pressure amid widespread market weakness. The damaging loss violated the previously noted upward trendline (shown below) connecting January-March lows defining initial near-term chart support above its 50-day moving average (DMA) line, raising concerns. Subsequent losses below its 50-day moving average (DMA) line would raise greater concerns and trigger a more worrisome sell signal, meanwhile it may simply work on building a new base pattern.Its last appearance in this FSU section was on 2/21/12 with an annotated graph under the headline, "Volume Cool But Lack of Progress in Good Market Raises Concerns", while it was hovering near its all-time high. In the weeks that followed it powered its way into new high territory with volume -driven gains. No resistance remains due to overhead supply, but it is extended from the base pattern previously noted.
Its reported earnings +50% on +31% sales revenues for the quarter ended October 31, 2011 versus the year ago period. The number of top-rated funds owning its shares rose from 262 in Mar '11 to 480 in Dec '11, a good sign concerning the I criteria. The 9 latest quarterly comparisons showed strong sales revenues and impressive earnings increases (C criteria), and it maintained a good annual earnings history (A criteria) despite a patch of negative comparisons in early '09. LULU was first featured in yellow at $23.83 (split adjusted after 2:1 split effective 7/21/11) in the October 8, 2010 mid-day report report (read here) and it traded up as much as +163.7% in a little more than 9 months. It had been noted and dropped from the Featured Stocks list in the interim, then returned when highlighted in yellow again in the 1/10/12 mid-day report after gapping up above the pivot point shown on the chart below.
In a bullish market, many high-ranked leaders offer multiple opportunities to accumulate their shares under the fact-based system's strict guidelines. Patience may allow another ideal base or secondary buy point to possibly develop and be noted. Meanwhile, if market conditions (M criteria) deteriorate with more damaging distribution days, investors might sooner adopt a bias toward raising cash rather than accumulating and adding more shares.
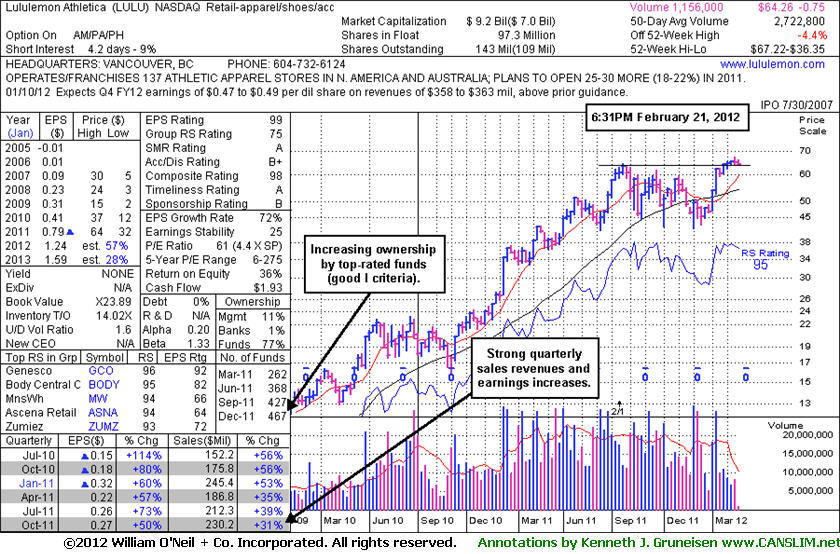
Volume Cool But Lack of Progress in Good Market Raises Concerns - Tuesday, February 21, 2012
Lululemon Athletica (LULU -$0.75 or -1.15% to $64.26) has been hovering near its all-time high. It has been stubbornly holding its ground with cooling volume totals in recent weeks, action suggesting that very few are exiting. No resistance remains due to overhead supply, but it is extended from the base pattern previously noted. Since its last appearance in this FSU section on 1/10/12 with an annotated graph under the headline, "Retail Apparel Firm Gapped Up For Considerable Volume-Driven Gain", it gradually wedged higher. Some may consider the tight weekly closes (seen on the weekly graph below) to be an advanced "3-weeks" tight pattern. Its lack of meaningful price progress in recent weeks is disconcerting, however, when poised to easily produce more climactic gains and while underpinned by a favorable market (M criteria) environment. If the quiet consolidation is followed by a clear burst of fresh buying demand from the institutional crowd, then action may be warranted by disciplined investors. As always, limit losses by selling if ever a stock fall more than -7% from your purchase price.
Its reported earnings +50% on +31% sales revenues for the quarter ended October 31, 2011 versus the year ago period. The number of top-rated funds owning its shares rose from 262 in Mar '11 to 467 in Dec '11, a good sign concerning the I criteria. The 8 latest quarterly comparisons showed strong sales revenues and impressive earnings increases (C criteria), and it maintained a good annual earnings history (A criteria) despite a patch of negative comparisons in early '09. LULU was first featured in yellow at $47.66 in the October 8, 2010 mid-day report report (read here) and it traded up as much as +163.7% in a little more than 9 months.
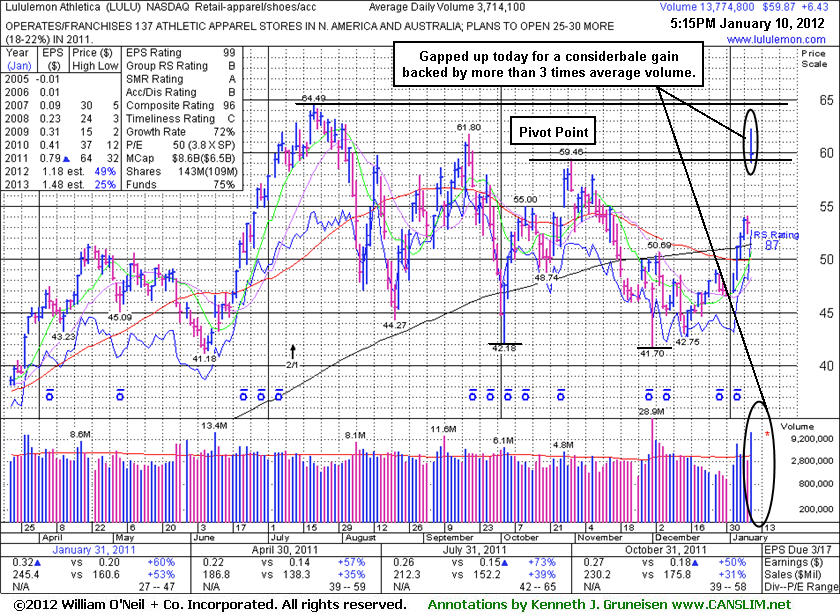
Retail Apparel Firm Gapped Up For Considerable Volume-Driven Gain - Tuesday, January 10, 2012
Lululemon Athletica (LULU +$6.43 or +12.03% to $59.87) gapped up today, rising from a "double bottom" base and challenging prior chart highs in the low $60s that may now act as a resistance level. In the mid-day report (read here) its color code was changed to yellow with pivot point cited based on its 10/31/11 high. It went through a long and choppy consolidation since last noted on 9/20/11. Its fundamental characteristics (C and A criteria) remain strong. Reported earnings +50% on +31% sales revenues for the quarter ended October 31, 2011 versus the year ago period. This high-ranked Retail-Apparel firm has confirmed a new technical buy signal with its solid gain above the new pivot point cited. A little bit of overhead supply remains to hinder its progress, yet it could work through that resistance in the days ahead and go on to produce more climactic gains. As always, limit losses by selling if ever a stock fall more than -7% from your purchase price.Its last appearance in this FSU section was on 7/15/11 with an annotated graph under the headline, "Extended After +20% Gains in First 2-3 Weeks After Latest Breakout", and based on subsequent weak action on 8/05/11 it was dropped from the Featured Stocks list. The number of top-rated funds owning its shares rose from 262 in Mar '11 to 429 in Dec '11. The 8 latest quarterly comparisons showed strong sales revenues and impressive earnings increases (C criteria), and it maintained a good annual earnings history (A criteria) despite a patch of negative comparisons in early '09. LULU was first featured in yellow at $47.66 in the October 8, 2010 mid-day report report (read here) and it traded up as much as +163.7% in a little more than 9 months.
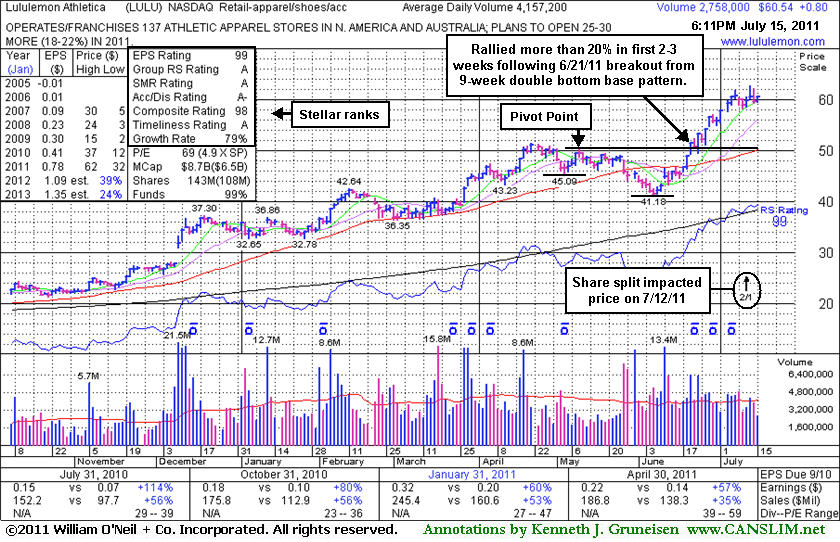
Extended After +20% Gains in First 2-3 Weeks After Latest Breakout - Friday, July 15, 2011
Lululemon Athletica (LULU +$0.80 or +1.34% to $60.54) is perched -3.7% off its 52-week high. Do not be confused by the 2:1 split impacting its share price effective 7/12/11 while perched near its all-time high. Its rally of better than +20% in less than 3 weeks after its recent technical breakout argues for investors to follow the investment system rule of holding stocks with such powerful early gains for 8 weeks minimum unless there is a bad technical breakdown. This rule is because many of the investment system's biggest winners and best examples among the winning models were those companies that had tallied big gains shortly after their breakouts, then went on to produce dramatic gains.
Its last appearance in this FSU section was on 6/21/11 with an annotated graph under the headline, "Volume-Driven Gain Clears Resistance For New Highs", as it hit new 52-week and all-time highs with +68% above average volume behind its gain. The 6/21/11 mid-day report noted as the previously Featured Stock had its color code changed to yellow with a new pivot point cited based on a "double bottom" base formed over the prior 9 weeks. The evening report stated - "This high-ranked Retail-Apparel firm has confirmed a new technical buy signal with its solid gain above the new pivot point cited. No overhead supply remains to hinder its progress now, and it could go on to produce more climactic gains. As always, limit losses by selling if ever a stock fall more than -7% from your purchase price."
The number of top-rated funds owning its shares rose from 260 in Sep '10 to 324 in Mar '11. The 7 latest quarterly comparisons showed strong sales revenues and impressive earnings increases (C criteria), and it maintained a good annual earnings history (A criteria) despite a patch of negative comparisons in early '09. LULU was first featured in yellow at $47.66 in the October 8, 2010 mid-day report report (read here) and it traded up as much as +163.7% in a little more than 9 months.
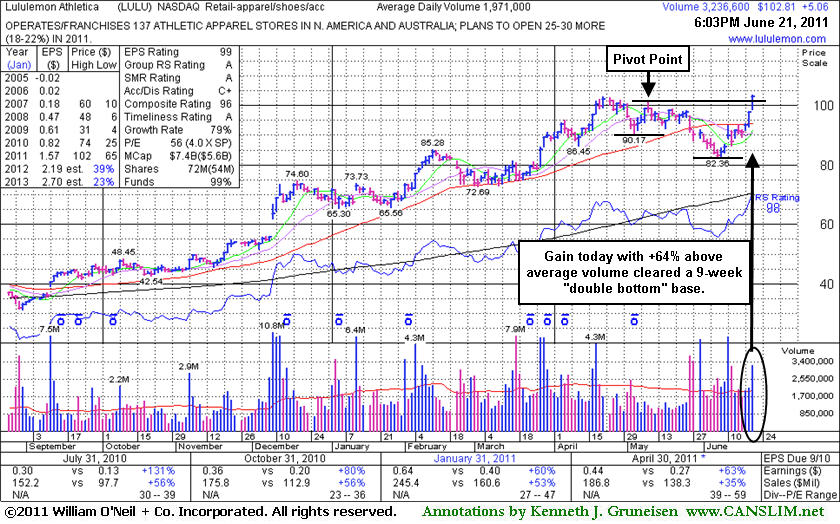
Volume-Driven Gain Clears Resistance For New Highs - Tuesday, June 21, 2011
Lululemon Athletica (LULU +$5.06 or +5.18% to $102.81) hit new 52-week and all-time highs today with +68% above average volume behind a 3rd consecutive gain. Technical improvement since dropped from the Featured Stocks list on 6/06/11 has been encouraging. It today's mid-day report its color code was changed to yellow with new pivot point cited based on a "double bottom" base formed over the past 9 weeks. Its last appearance in this FSU section was on 5/27/11 with an annotated graph under the headline, "Damaging Losses Triggered Sell Signal", showing it slumping below its 50-day moving average (DMA) line triggering technical sell signals with 2 consecutive damaging losses on above average volume.
This high-ranked Retail-Apparel firm has confirmed a new technical buy signal with its solid gain above the new pivot point cited. No overhead supply remains to hinder its progress now, and it could go on to produce more climactic gains. As always, limit losses by selling if ever a stock fall more than -7% from your purchase price.
The number of top-rated funds owning its shares rose from 261 in Sep '10 to 306 in Dec '10, but reportedly eased to 304 in Mar '11. Its board of directors recently approved a 2-for-1 stock split (pending). The 7 latest quarterly comparisons showed strong sales revenues and impressive earnings increases (C criteria), and it maintained a good annual earnings history (A criteria) despite a patch of negative comparisons in early '09. LULU was first featured in yellow at $47.66 in the October 8, 2010 mid-day report report (read here) and it traded up as much as +115.7% in less than 7 months.
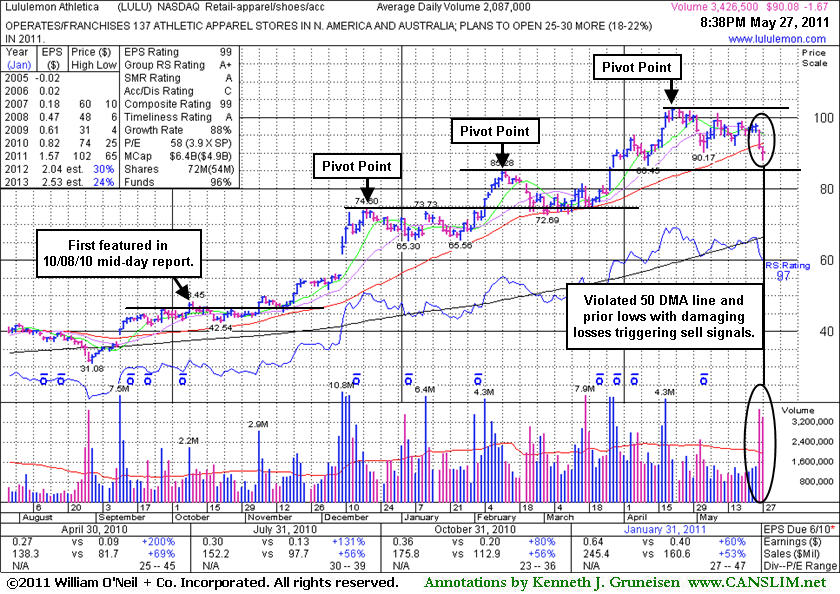
Damaging Losses Triggered Sell Signal - Friday, May 27, 2011
Lululemon Athletica (LULU -$1.67 or -1.82% to $90.08) was down again today with above average volume, slumping below its 50-day moving averages (DMA) line triggering technical sell signals with 2 consecutive damaging losses on above average volume to end this week. This high-ranked Retail-Apparel firm failed to confirm a recent buy signal since a new pivot point was cited. A prompt rebound of the 50 DMA line would help its outlook, technically, and it could go on to produce more climactic gains. However, recent weakness suggests that it may be due for a longer and deeper consolidation.Following its last appearance in this FSU section on 5/03/11 with an annotated graph under the headline, "Distributional Pressure After +115% Rally In Under 7 Months", it had been consolidating above its 50-day moving average (DMA) line while volume totals cooled. LULU was first featured in yellow at $47.66 in the October 8, 2010 mid-day report report (read here) and it traded up as much as +115.7% in less than 7 months.
The number of top-rated funds owning its shares fell to 297 in Mar '11 from 303 in Dec '10, which is a slightly disconcerting indication concerning the I criteria. Its board of directors recently approved a 2-for-1 stock split (pending). The 5 latest quarterly comparisons showed strong sales revenues and impressive earnings increases (C criteria), and it maintained a good annual earnings history (A criteria) despite a patch of negative comparisons in early '09.
Distributional Pressure After +115% Rally In Under 7 Months - Tuesday, May 03, 2011
Lululemon Athletica (LULU -$3.05 or -3.17% to $93.30) was down again today with a loss on higher volume indicative of distributional pressure. Recently this high-ranked Retail-Apparel firm has been noted as extended from any sound base pattern. Prior highs and its 50-day moving average (DMA) line in the $85 area define important chart support to watch. Following its last appearance in this FSU section on 3/31/11 with an annotated graph under the headline, "Consolidating After Breakout Above New Pivot Point", it only briefly dipped below its "max buy" level while it went on rallying to hit a new all-time high of $102.83. Since this high-ranked Retail - Apparel/Shoes/Accessories firm was first featured in yellow at $47.66 in the October 8, 2010 mid-day report report (read here) it has traded up as much as +115.7% in less than 7 months. While it could go on to produce more climactic gains, its recent weakness suggests that it may be due for a longer and deeper consolidation.The number of top-rated funds owning its shares fell to 298 in Mar '11 from 301 in Dec '10, which is a slightly disconcerting indication concerning the I criteria. Its board of directors recently approved a 2-for-1 stock split (pending). The 5 latest quarterly comparisons showed strong sales revenues and impressive earnings increases (C criteria), and it maintained a good annual earnings history (A criteria) despite a patch of negative comparisons in early '09.
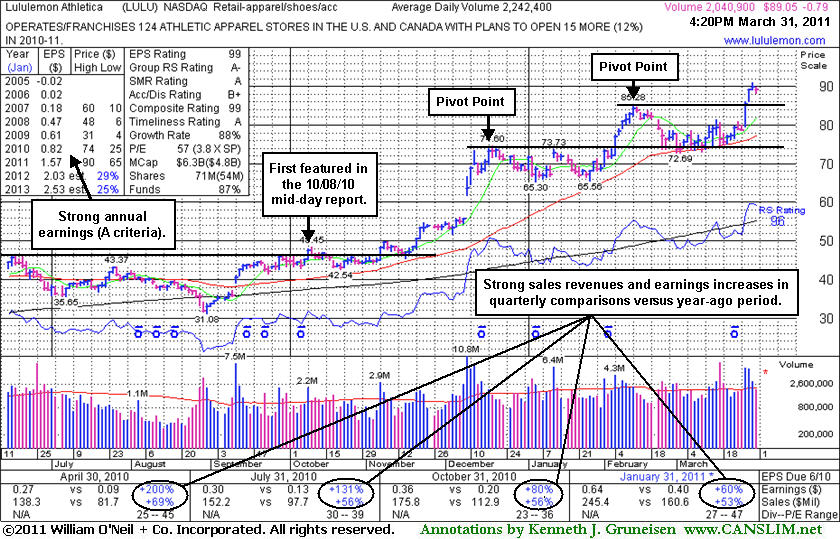
Consolidating After Breakout Above New Pivot Point - Thursday, March 31, 2011
Lululemon Athletica (LULU -$0.79 or -0.88% to $89.05) hit new all-time highs this week as considerable volume-driven gains above its latest pivot point triggered a new (or add-on) technical buy signal. It pulled back on lighter volume today and finished just under its "max buy" level. Prior highs that were a resistance level now define chart support after its breakout from a new base-on-base pattern. Following its last appearance in this FSU section on 2/25/11 with an annotated graph under the headline, "Consolidating Above Support After Bout Of Distribution", it found support at its 50-day moving average (DMA) line. Eventually, a new pivot point was cited on 3/28/11, and it broke out again.
The number of top-rated fund owning its shares rose from 278 in Mar '10 to 300 in Dec '10, which is a reassuring sign concerning the I criteria. Its board of directors recently approved a 2-for-1 stock split (pending). Since this high-ranked Retail - Apparel/Shoes/Accessories firm was first featured in yellow at $47.66 in the October 8, 2010 mid-day report report (read here) and in that evening's Featured Stock Update section with an annotated graph (read here) it has traded up as much as +90.8% in less than 6 months. The 5 latest quarterly comparisons showed strong sales revenues and impressive earnings increases (C criteria), and it maintained a good annual earnings history (A criteria) despite a patch of negative comparisons in early '09.
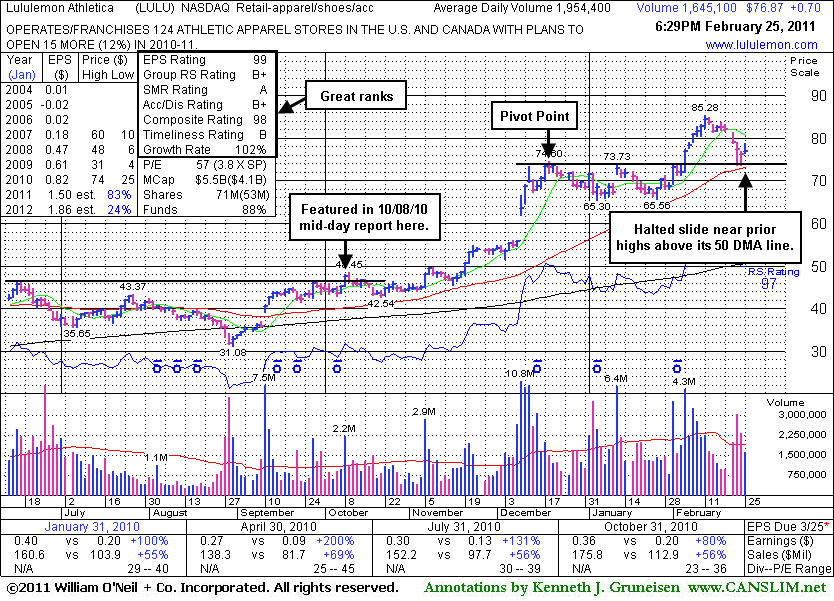
Consolidating Above Support After Bout Of Distribution - Friday, February 25, 2011
Lululemon Athletica (LULU +$0.66 or +0.87% to $76.83) posted a small gain on light volume, halting its slide after 5 consecutive losses and some distributional pressure this week. Support near prior highs defines chart support just above its 50-day moving average (DMA) line. Subsequent violations would trigger technical sell signals and prompt investors to lock in profits or at least limit losses on any later buys. Following its last appearance in this FSU section on 1/14/11 with an annotated graph under the headline, "Leader Hovering Near Highs Following +56% Rally In 3 Months", it continued consolidating. Then, a new pivot point was cited on 1/26/11, and it eventually broke out again with a big gain on heavy volume on 2/04/11 triggering a new (or add-on) technical buy signal.
Since this high-ranked Retail - Apparel/Shoes/Accessories firm was first featured in yellow at $47.66 in the October 8, 2010 mid-day report it has traded up as much as +78.9% in less than 5 months. The 4 latest quarterly comparisons showed strong sales revenues and impressive earnings increases (C criteria), and it maintained a good annual earnings history (A criteria) despite a patch of negative comparisons in early '09. The number of top-rated fund owning its shares fell from 261 in Sep '10 to 286 in Dec '10, which is a reassuring sign concerning the I criteria.
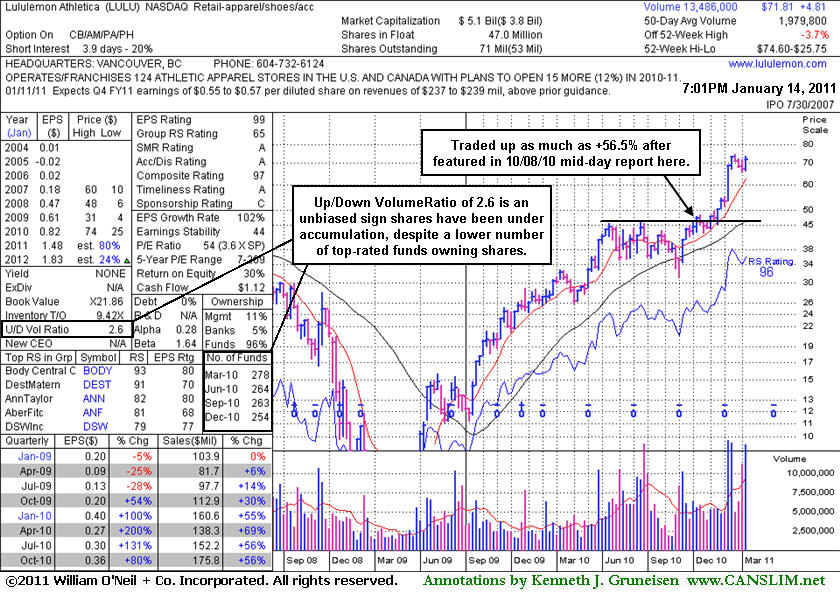
Leader Hovering Near Highs Following +56% Rally In 3 Months - Friday, January 14, 2011
Lululemon Athletica's (LULU +$0.05 or +0.07% to $71.81) is perched -3.7% from its all-time high. It posted a considerable gap up gain on 1/12/11 with more than 3 times average volume following encouraging guidance. It is now extended from any sound base and it is well above support offered by its 50-day moving average (DMA) line. Following its last appearance in this FSU section on 12/01/2010 with an annotated graph under the headline "High-Ranked Retail Firm Is Extended After Latest Gains" it spiked to new 52-week highs with a streak of considerable volume-driven gains.
The weekly graph below illustrates its progress following its first appearance in this FSU section with an annotated graph on 10/08/10 under the headline "Breakout Gain For 52-Week High On Double Average Volume." It initially struggled, yet stayed above important support at its 50 DMA line. This high-ranked Retail - Apparel/Shoes/Accessories firm is clear of any resistance due to overhead supply and could produce more climactic gains, however, disciplined investors know not to chase extended stocks. Patience may allow for a secondary buy point or new sound base to eventually develop.
The 4 latest quarterly comparisons showed strong sales revenues and impressive earnings increases (C criteria), and it maintained a good annual earnings history (A criteria) despite a patch of negative comparisons in early '09. The number of top-rated fund owning its shares fell from 278 in March '10 to 254 in Dec '10, which is not a reassuring sign concerning the I criteria, yet its Up/Down Volume Ratio of 2.6 at present gives an unbiased indication shares have recently been under accumulation. Its Accumulation/Distribution Rating is also A, giving investors another reassurance.
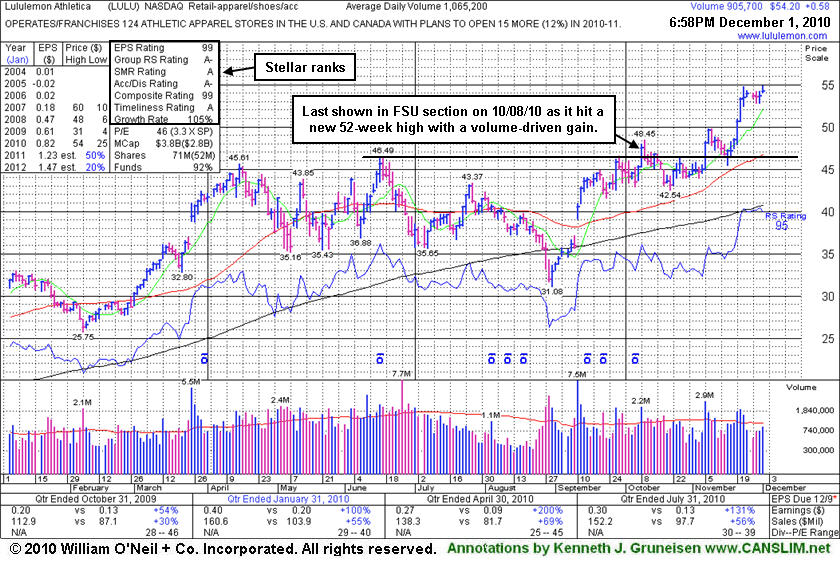
High-Ranked Retail Firm Is Extended After Latest Gains - Wednesday, December 01, 2010
Lululemon Athletica's (LULU +$0.58 or +1.08% to $54.20) volume total was below average today as it touched a new 52-week high after a tight consolidation following volume-driven gains. Prior highs in the $46-48 area define chart support to watch along with its 50-day moving average (DMA) line. After its last appearance in this FSU section with an annotated graph on 10/08/10 under the headline "Breakout Gain For 52-Week High On Double Average Volume" it initially struggled. It stayed well above important support at its 50 DMA line.
This high-ranked Retail - Apparel/Shoes/Accessories firm is new clear of any resistance due to overhead supply, however, it is extended from a sound base. The 4 latest quarterly comparisons showed strong sales revenues and impressive earnings increases (C criteria), and it maintained a good annual earnings history (A criteria) despite a patch of negative comparisons in early '09. The number of top-rated fund owning its shares fell from 278 in March '10 to 261 in Sept '10, which is not a reassuring sign concerning the I criteria, yet its Up/Down Volume Ratio of 1.3 at present gives an unbiased indication it has recently been under accumulation. Its Accumulation/Distribution Rating is also A- today, giving investors another reassurance.
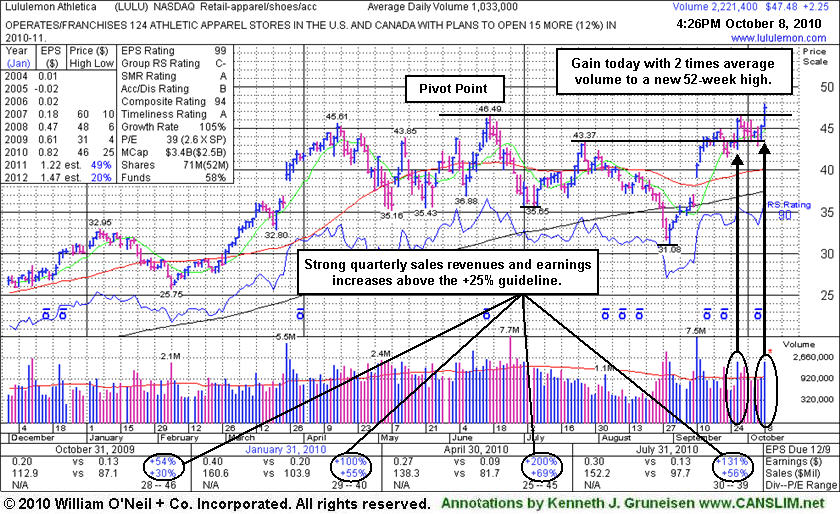
Breakout Gain For 52-Week High On Double Average Volume - Friday, October 08, 2010
In recent weeks an increasing number of leading stocks setting up and breaking of solid bases have been highlighted in the CANSLIM.net Mid-Day Breakouts Report. The most relevant factors are briefly noted in the report which allows disciplined investors to place the issue in their custom watch list and receive subsequent notes directly via email immediately when they are published (click the "Alert me of new notes" link). More detailed analysis is published soon after a stock's initial appearance in yellow once any new candidates are added to the Featured Stocks list. Letter-by-letter details concerning strengths or shortcomings of the company in respect to key fundamental criteria of the investment system appear along with annotated datagraphs highlighting technical chart patterns in the Featured Stock Update (FSU) section included in the CANSLIM.net After Market Update each day.
Lululemon Athletica (LULU +$2.26 or +4.99% to $47.48) rallied to a new 52-week high with +117% above average volume. This high-ranked Retail - Apparel/Shoes/Accessories firm is new clear of any resistance due to overhead supply. Its color code was changed to yellow as it was featured in today's mid-day report (read here) with its pivot point based on its 52-week high plus ten cents. We observed that, technically, its 9/28/10 gain with above average volume helped it clear a big "double bottom" type base and trigger an earlier buy signal, followed by a quiet consolidation. The 4 latest quarterly comparisons showed strong sales revenues and impressive earnings increases (C criteria), and it maintained a good annual earnings history (A criteria) despite a patch of negative comparisons in early '09.