You are not logged in.
This means you
CAN ONLY VIEW reports that were published prior to Tuesday, February 4, 2025.
You
MUST UPGRADE YOUR MEMBERSHIP if you want to see any current reports.
AFTER MARKET UPDATE - WEDNESDAY, SEPTEMBER 18TH, 2019
Previous After Market Report Next After Market Report >>>
|
|
|
|
DOW |
+36.28 |
27,147.08 |
+0.13% |
|
Volume |
872,643,120 |
+4% |
|
Volume |
2,035,160,530 |
+10% |
|
NASDAQ |
-8.63 |
8,177.39 |
-0.11% |
|
Advancers |
1,343 |
47% |
|
Advancers |
1,257 |
41% |
|
S&P 500 |
+1.03 |
3,006.73 |
+0.03% |
|
Decliners |
1,486 |
53% |
|
Decliners |
1,803 |
59% |
|
Russell 2000 |
-9.95 |
1,568.34 |
-0.63% |
|
52 Wk Highs |
79 |
|
|
52 Wk Highs |
59 |
|
|
S&P 600 |
-6.26 |
970.34 |
-0.64% |
|
52 Wk Lows |
10 |
|
|
52 Wk Lows |
34 |
|
|
 |
Major Indices Rebounded From Losses Late in the Session
Kenneth J. Gruneisen - Passed the CAN SLIM® Master's Exam
The Dow gained 36 points, reversing a 200 point loss earlier in the session. The S&P 500 finished just above the flat line, while the Nasdaq Composite declined 0.1%. The volume totals reported were higher than the prior session totals on the NYSE and on the Nasdaq exchange. Decliners led advancers by a 3-2 margin on the Nasdaq exchange and by a narrower margin on the NYSE. There were 28 high-ranked companies from the Leaders List hit new 52-week highs and were listed on the BreakOuts Page, versus the total of 19 on the prior session. New 52-week highs totals outnumbered new 52-week lows totals on the NYSE and on the Nasdaq exchange. Concerning the M criteria of the fact-based investment system, investors have a green light to make carefully selected new buying efforts. The Featured Stocks Page provides the most timely analysis on high-ranked leaders. Charts used courtesy of www.stockcharts.com
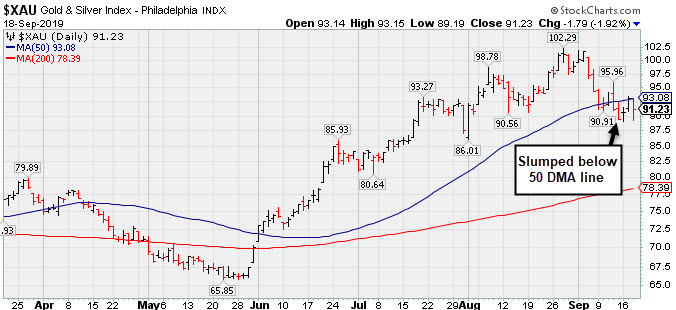
PICTURED: The Dow Jones Industrial Average is perched -0.9% off its record high.
The major averages finished mixed on Wednesday as investors assessed the latest policy decision from the Federal Reserve. The Federal Reserve cut interest rates by 25 basis points to a range of 1.75%-2.00% at the conclusion of the two-day FOMC meeting. The decision was made with a 7-3 majority, with the committee’s statement citing “implications of global developments for the economic outlook as well as muted inflation pressures” for the reduction. In the post-meeting press conference, Chair Jerome Powell noted that that the Fed “took this step to keep the economy strong.” Policymakers also lowered the interest paid on excess reserves to quell the recent volatility in repo markets. Treasuries were mixed, with the yield on the 10-year note down two basis points to 1.79%. On the data front, housing starts jumped 12.3% in August to the highest level since 2007, and rebounding from July’s 1.5% dip.
Six of 11 S&P 500 sectors ended in positive territory. The Energy sector lagged with WTI crude slipping 1.2% to $58.12/barrel after Saudi Arabia stated that its oil production should return to normal by month-end. In earnings, FedEx Corp (FDX -12.92%) fell after missing analyst estimates on both the top and bottom line and lowering its full-year guidance. General Mills Inc (GIS -0.91%) edged lower despite its quarterly profit exceeding consensus estimates. Adobe Inc (ADBE -1.75%) fell following its disappointing revenue forecast.
|
 Kenneth J. Gruneisen started out as a licensed stockbroker in August 1987, a couple of months prior to the historic stock market crash that took the Dow Jones Industrial Average down -22.6% in a single day. He has published daily fact-based fundamental and technical analysis on high-ranked stocks online for two decades. Through FACTBASEDINVESTING.COM, Kenneth provides educational articles, news, market commentary, and other information regarding proven investment systems that work in good times and bad.
Comments contained in the body of this report are technical opinions only and are not necessarily those of Gruneisen Growth Corp. The material herein has been obtained from sources believed to be reliable and accurate, however, its accuracy and completeness cannot be guaranteed. Our firm, employees, and customers may effect transactions, including transactions contrary to any recommendation herein, or have positions in the securities mentioned herein or options with respect thereto. Any recommendation contained in this report may not be suitable for all investors and it is not to be deemed an offer or solicitation on our part with respect to the purchase or sale of any securities. |
|
 |
Bank Index Rose and Commodity-Linked Groups Fell
Kenneth J. Gruneisen - Passed the CAN SLIM® Master's Exam
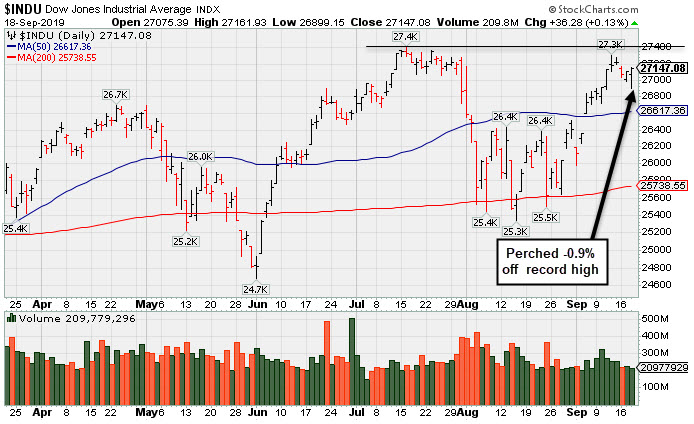
The Bank Index ($BKX +0.63%) rose while the Broker/Dealer Index ($XBD -0.23%) and the Retail Index ($RLX -0.19%) both edged lower. The tech sector was led lower by the Networking Index ($NWX -0.61%) and the Biotech Index ($BTK -0.65%) while the Semiconductor Index ($SOX +0.08%) finished the session slightly higher. Commodity-linked groups had a negative bias as the Oil Services Index ($OSX -1.11%), Integrated Oil Index ($XOI -0.50%) fell.
PICTURED: The Gold & Silver Index ($XAU -1.92%) has slumped below its 50-day moving average (DMA) line.
| Oil Services |
$OSX |
73.43 |
-0.82 |
-1.10% |
-8.90% |
| Integrated Oil |
$XOI |
1,245.86 |
-6.22 |
-0.50% |
+7.49% |
| Semiconductor |
$SOX |
1,600.95 |
+1.21 |
+0.08% |
+38.59% |
| Networking |
$NWX |
563.46 |
-3.46 |
-0.61% |
+15.31% |
| Broker/Dealer |
$XBD |
275.98 |
-0.63 |
-0.23% |
+16.28% |
| Retail |
$RLX |
2,403.12 |
-4.68 |
-0.19% |
+23.15% |
| Gold & Silver |
$XAU |
91.23 |
-1.79 |
-1.92% |
+29.11% |
| Bank |
$BKX |
101.66 |
+0.63 |
+0.62% |
+18.50% |
| Biotech |
$BTK |
4,453.65 |
-29.36 |
-0.65% |
+5.52% |
|
|
|
 |
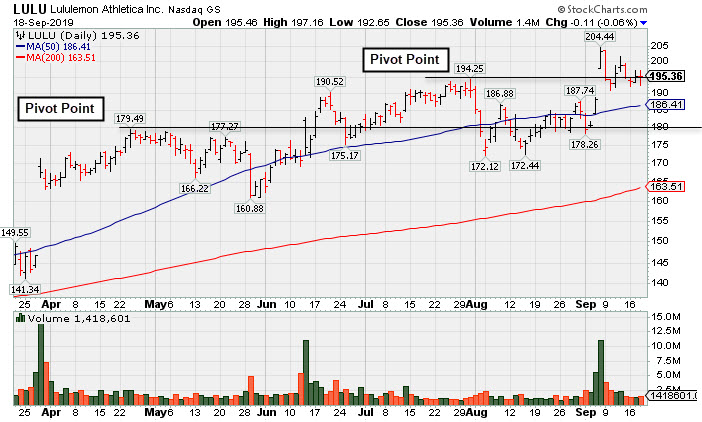
Consolidating Near Prior High Following Latest Breakout
Kenneth J. Gruneisen - Passed the CAN SLIM® Master's Exam
Lululemon Athletica (LULU -$0.11 or -0.06% to $195.36) has been quietly hovering near its all-time high following volume driven gains. The prior high ($194.25) defines initial support to watch above its 50-day moving average (DMA) line ($186.41). It has shown some resilience since last shown in this FSU section was on 9/03/19 with an annotated graph under the headline, "Sank Below 50-Day Average Toward Prior Lows With High Volume".
LULU reported earnings +35% on +22% sales revenues for the Jul '19 quarter, marking its 7th consecutive quarterly comparison above the +25% minimum guideline (C criteria). Recent quarterly comparisons showed stronger sales revenues and earnings improvement helping it match with the fact-based investment system's fundamental guidelines. It has a new CEO as of 8/20/18. It currently has a 96 Earnings Per Share Rating. Its Timeliness rating is A and Sponsorship rating is C. The number of top-rated funds owning its shares rose from 1,041 in Jun '18 to 1,419 in Jun '19, a good sign concerning the I criteria. LULU was first featured in yellow at $23.83 (split adjusted after 2:1 split effective 7/21/11) in the October 8, 2010 mid-day report (read here) and it traded up as much as +163.7% in a little more than 9 months. As previously noted - "In a bullish market, many high-ranked leaders offer multiple opportunities to accumulate their shares under the fact-based system's strict guidelines. Patience may often allow another ideal base or secondary buy point to possibly develop and be noted." Charts courtesy of www.stockcharts.com
 |
|
|
Color Codes Explained :
Y - Better candidates highlighted by our
staff of experts.
G - Previously featured
in past reports as yellow but may no longer be buyable under the
guidelines.
***Last / Change / Volume data in this table is the closing quote data***
Symbol/Exchange
Company Name
Industry Group |
PRICE |
CHANGE
(%Change) |
Day High |
Volume
(% DAV)
(% 50 day avg vol) |
52 Wk Hi
% From Hi |
Featured
Date |
Price
Featured |
Pivot Featured |
|
Max Buy |
 CCBG
-
NASDAQ
CCBG
-
NASDAQ
Capital City Bk Gp
BANKING - Regional - Mid-Atlantic Banks
|
$26.64
|
+0.15
0.57% |
$26.80
|
63,725
318.63% of 50 DAV
50 DAV is 20,000
|
$27.24
-2.20%
|
9/13/2019
|
$27.03
|
PP = $27.05
|
|
MB = $28.40
|
 Most Recent Note - 9/18/2019 6:05:59 PM
Y - Managed a "positive reversal" today and it remains perched near its 52-week high. Subsequent volume-driven gains above the pivot point may trigger a technical buy signal.
>>> FEATURED STOCK ARTICLE : Thinly Traded Bank Rallied To Multi-Year Highs - 9/13/2019 |
View all notes |
Set NEW NOTE alert |
Company Profile |
SEC
News |
Chart |
Request a new note
C
A
S
I |
EPAM
-
NYSE
Epam Systems Inc
COMPUTER SOFTWARE and SERVICES - Information Technology Service
|
$184.56
|
+1.30
0.71% |
$185.70
|
267,893
68.69% of 50 DAV
50 DAV is 390,000
|
$201.00
-8.18%
|
5/9/2019
|
$169.25
|
PP = $180.55
|
|
MB = $189.58
|
Most Recent Note - 9/16/2019 5:56:58 PM
G - Halted its slide above the prior low ($175.33 on 8/07/19) which defines the next important support level. A rebound above its 50 DMA line ($190) is needed for its outlook to improve. Reported earnings +27% on +24% sales revenues for the Jun '19 quarter. See the latest FSU analysis for more details and a new annotated graph.
>>> FEATURED STOCK ARTICLE : Recent Slump Below 50-Day Average Hurt Outlook - 9/16/2019 |
View all notes |
Set NEW NOTE alert |
Company Profile |
SEC
News |
Chart |
Request a new note
C
A
S
I |
AUDC
-
NASDAQ
Audiocodes Ltd
ELECTRONICS - Scientific and Technical Instrum
|
$21.18
|
+1.02
5.06% |
$21.51
|
434,983
217.49% of 50 DAV
50 DAV is 200,000
|
$20.57
2.97%
|
9/13/2019
|
$19.68
|
PP = $19.84
|
|
MB = $20.83
|
Most Recent Note - 9/18/2019 6:08:30 PM
G - Color code is changed to green after rallying above its "max buy" level and hitting a new all-time high with today's 6th consecutive gain marked by volume. Its 50 DMA line ($17.84) defines important support. See the latest FSU analysis for more details and an annotated graph.
>>> FEATURED STOCK ARTICLE : Recent Spurt of Gains for New Highs Marked By Volume - 9/17/2019 |
View all notes |
Set NEW NOTE alert |
Company Profile |
SEC
News |
Chart |
Request a new note
C
A
S
I |
LHCG
-
NASDAQ
L H C Group Inc
HEALTH SERVICES - Home Health Care
|
$118.29
|
-1.11
-0.93% |
$119.80
|
212,026
98.62% of 50 DAV
50 DAV is 215,000
|
$129.37
-8.56%
|
7/1/2019
|
$110.94
|
PP = $122.20
|
|
MB = $128.31
|
Most Recent Note - 9/18/2019 6:01:53 PM
G - A rebound above its 50 DMA line ($121.11) is needed to help its outlook, however it has recently acted as resistance. The recent low ($115.06 9/10/19) defines near-term support above its 200 DMA line ($111.74).
>>> FEATURED STOCK ARTICLE : 50-Day Moving Average Recently Acted as Resistance - 9/12/2019 |
View all notes |
Set NEW NOTE alert |
Company Profile |
SEC
News |
Chart |
Request a new note
C
A
S
I |
CHDN
-
NASDAQ
Churchill Downs Inc
LEISURE - Gaming Activities
|
$124.10
|
+0.38
0.31% |
$124.60
|
150,015
67.88% of 50 DAV
50 DAV is 221,000
|
$132.73
-6.50%
|
7/22/2019
|
$118.45
|
PP = $118.89
|
|
MB = $124.83
|
Most Recent Note - 9/16/2019 5:53:56 PM
Y - Volume has been cooling while consolidating above its 50 DMA line ($120.45). Below that important short-term average, the prior low ($113.88 on 8/05/19) defines the next support level. Jun '19 earnings +10% on +26% sales revenues versus the year ago period were below the +25% minimum earnings guideline (C criteria), noted recently raising fundamental concerns.
>>> FEATURED STOCK ARTICLE : Found Support After Making Limited Progress - 9/4/2019 |
View all notes |
Set NEW NOTE alert |
Company Profile |
SEC
News |
Chart |
Request a new note
C
A
S
I |
Symbol/Exchange
Company Name
Industry Group |
PRICE |
CHANGE
(%Change) |
Day High |
Volume
(% DAV)
(% 50 day avg vol) |
52 Wk Hi
% From Hi |
Featured
Date |
Price
Featured |
Pivot Featured |
|
Max Buy |
LULU
-
NASDAQ
Lululemon Athletica
MANUFACTURING - Textile Manufacturing
|
$195.36
|
-0.11
-0.06% |
$197.16
|
1,418,601
80.51% of 50 DAV
50 DAV is 1,762,000
|
$204.44
-4.44%
|
9/6/2019
|
$201.25
|
PP = $194.35
|
|
MB = $204.07
|
Most Recent Note - 9/18/2019 5:58:26 PM
Y - Quietly consolidating near its prior high after latest breakout. Reported earnings +35% on +22% sales revenues for the Jul '19 quarter. Prior high ($194.25) defines initial support to watch above its 50 DMA line ($186.41). See the latest FSU analysis for more details and a new annotated graph.
>>> FEATURED STOCK ARTICLE : Consolidating Near Prior High Following Latest Breakout - 9/18/2019 |
View all notes |
Set NEW NOTE alert |
Company Profile |
SEC
News |
Chart |
Request a new note
C
A
S
I |
CPRT
-
NASDAQ
Copart Inc
SPECIALTY RETAIL - Auto Dealerships
|
$82.57
|
-0.87
-1.04% |
$83.65
|
956,860
74.70% of 50 DAV
50 DAV is 1,281,000
|
$83.70
-1.35%
|
9/5/2019
|
$79.13
|
PP = $79.84
|
|
MB = $83.83
|
Most Recent Note - 9/16/2019 5:55:46 PM
Y - Perched near its all-time high after today's 3rd consecutive volume-driven gain. Held its ground after the big volume-driven gain above the pivot point on 9/05/19 clinched a technical buy signal. Fundamentals are strong.
>>> FEATURED STOCK ARTICLE : Heavy Volume Behind Breakout Gain After Earnings Report - 9/5/2019 |
View all notes |
Set NEW NOTE alert |
Company Profile |
SEC
News |
Chart |
Request a new note
C
A
S
I |
BLD
-
NYSE
Topbuild Corp
Bldg-Constr Prds/Misc
|
$95.56
|
+1.82
1.94% |
$96.22
|
297,844
105.25% of 50 DAV
50 DAV is 283,000
|
$96.01
-0.47%
|
5/17/2019
|
$82.19
|
PP = $87.31
|
|
MB = $91.68
|
Most Recent Note - 9/18/2019 6:04:53 PM
G - Posted a 4th consecutive gain today and hit a new all-time high. Earnings rose +39% on +9% sales revenues for the Jun '19 quarter versus the year ago period. Its 50 DMA line ($87.95) defines important support to watch along with its prior low ($86.53 on 8/28/19).
>>> FEATURED STOCK ARTICLE : Holding Ground Stubbornly in Tight Range Near Record High - 9/10/2019 |
View all notes |
Set NEW NOTE alert |
Company Profile |
SEC
News |
Chart |
Request a new note
C
A
S
I |
PAGS
-
NYSE
Pagseguro Digital Cl A
Finance-CrdtCard/PmtPr
|
$47.35
|
-0.41
-0.86% |
$48.51
|
1,297,801
59.70% of 50 DAV
50 DAV is 2,174,000
|
$53.43
-11.38%
|
6/25/2019
|
$37.69
|
PP = $40.07
|
|
MB = $42.07
|
Most Recent Note - 9/17/2019 5:45:04 PM
G - Posted another big gain today on lighter than average volume as it rebounded and closed above its 50 DMA line ($47.02) helping its outlook to improve. Big losses last week triggered a technical sell signal, but it halted its slide above the prior low ($42.00 on 8/05/19) which defines the next important chart support level. Fundamentals are strong.
>>> FEATURED STOCK ARTICLE : 50-Day Moving Average Violation Triggered Technical Sell Signal - 9/11/2019 |
View all notes |
Set NEW NOTE alert |
Company Profile |
SEC
News |
Chart |
Request a new note
C
A
S
I |
|
|
|
THESE ARE NOT BUY RECOMMENDATIONS!
Comments contained in the body of this report are technical
opinions only. The material herein has been obtained
from sources believed to be reliable and accurate, however,
its accuracy and completeness cannot be guaranteed.
This site is not an investment advisor, hence it does
not endorse or recommend any securities or other investments.
Any recommendation contained in this report may not
be suitable for all investors and it is not to be deemed
an offer or solicitation on our part with respect to
the purchase or sale of any securities. All trademarks,
service marks and trade names appearing in this report
are the property of their respective owners, and are
likewise used for identification purposes only.
This report is a service available
only to active Paid Premium Members.
You may opt-out of receiving report notifications
at any time. Questions or comments may be submitted
by writing to Premium Membership Services 665 S.E. 10 Street, Suite 201 Deerfield Beach, FL 33441-5634 or by calling 1-800-965-8307
or 954-785-1121.
|
|
|