You are not logged in.
This means you
CAN ONLY VIEW reports that were published prior to Friday, April 18, 2025.
You
MUST UPGRADE YOUR MEMBERSHIP if you want to see any current reports.
AFTER MARKET UPDATE - TUESDAY, SEPTEMBER 3RD, 2019
Previous After Market Report Next After Market Report >>>
|
|
|
|
DOW |
-285.26 |
26,118.02 |
-1.08% |
|
Volume |
849,485,530 |
-2% |
|
Volume |
1,926,410,850 |
+17% |
|
NASDAQ |
-88.72 |
7,874.16 |
-1.11% |
|
Advancers |
1,112 |
39% |
|
Advancers |
896 |
29% |
|
S&P 500 |
-20.19 |
2,906.27 |
-0.69% |
|
Decliners |
1,758 |
61% |
|
Decliners |
2,201 |
71% |
|
Russell 2000 |
-22.56 |
1,472.28 |
-1.51% |
|
52 Wk Highs |
154 |
|
|
52 Wk Highs |
64 |
|
|
S&P 600 |
-12.77 |
905.97 |
-1.39% |
|
52 Wk Lows |
99 |
|
|
52 Wk Lows |
131 |
|
|
 |
Breadth Negative as Major Indices Slump Again
Kenneth J. Gruneisen - Passed the CAN SLIM® Master's Exam
The Dow dropped 285 points, while the S&P 500 lost 0.7%. The Nasdaq Composite was down 1.1%. Volume totals reported were mixed, lighter than the prior session total on the NYSE and higher on the Nasdaq exchange. Breadth was negative as decliners led advancers by a 3-2 margin on the NYSE and by more than 2-1 on the Nasdaq exchange. There were 27 high-ranked companies from the Leaders List hit new 52-week highs and were listed on the BreakOuts Page, versus the total of 39 on the prior session. New 52-week highs outnumbered new 52-week lows on the NYSE, but new lows still outnumbered new highs on the Nasdaq exchange. A follow-through day on 8/13/19 marked a bullish shift concerning the M criteria of the fact-based investment system, but the market faced immediate pressure. Investors have a green light to make carefully selected new buying efforts, however, subsequent losses below prior low for the Nasdaq Composite Index would technically kill the new rally. The Featured Stocks Page provides the most timely analysis on high-ranked leaders. Charts used courtesy of www.stockcharts.com
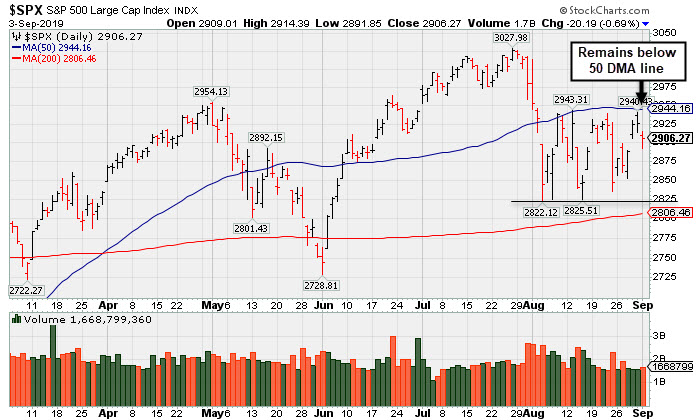
PICTURED: The S&P 500 Index remains below its 50-day moving average (DMA) line. The recent low defines important support along with its 200 DMA line. More damaging losses would raise concerns and prompt investors to reduce their exposure to stocks.
Stocks finished lower Tuesday amid a disappointing data report and ongoing trade tensions. Hopes for September trade talks between the U.S. and China have faded after the latest round of tariffs from both sides were implemented on Sunday.
Weak economic data pressured risk sentiment after the Institute for Supply Management’s manufacturing gauge fell into contractionary territory in August for the first time in three years. A separate flash reading from research firm IHS Markit showed manufacturing PMI expanded to 50.3 last month after contracting for the first time in a decade. Overseas, political uncertainty surrounding Britain’s exit from the European Union also weighed on risk appetite. Treasuries advanced, with the yield on the 10-year note down three basis points to 1.47% after touching a three-year low of 1.43%. In commodities, WTI crude pared an earlier decline to close down 2.1% to $53.97/barrel amid demand concerns. COMEX gold rallied 1.6% to $1,547.10/ounce.
Eight of 11 S&P 500 sectors finished in negative territory with the more traditionally defensive Utilities, Real Estate, and Consumer Staples groups bucking the downtrend. Industrials led decliners, sliding 1.4%, while Technology and Financial shares also lost more than 1%. In corporate news, Boeing (BA -2.66%) fell after The Wall Street Journal reported fresh delays in returning the 737-MAX aircraft to service. Amazon (AMZN +0.76%) following an analyst price target increase.
|
 Kenneth J. Gruneisen started out as a licensed stockbroker in August 1987, a couple of months prior to the historic stock market crash that took the Dow Jones Industrial Average down -22.6% in a single day. He has published daily fact-based fundamental and technical analysis on high-ranked stocks online for two decades. Through FACTBASEDINVESTING.COM, Kenneth provides educational articles, news, market commentary, and other information regarding proven investment systems that work in good times and bad.
Comments contained in the body of this report are technical opinions only and are not necessarily those of Gruneisen Growth Corp. The material herein has been obtained from sources believed to be reliable and accurate, however, its accuracy and completeness cannot be guaranteed. Our firm, employees, and customers may effect transactions, including transactions contrary to any recommendation herein, or have positions in the securities mentioned herein or options with respect thereto. Any recommendation contained in this report may not be suitable for all investors and it is not to be deemed an offer or solicitation on our part with respect to the purchase or sale of any securities. |
|
 |
Financial, Tech, Energy, and Retail Indexes Fell
Kenneth J. Gruneisen - Passed the CAN SLIM® Master's Exam
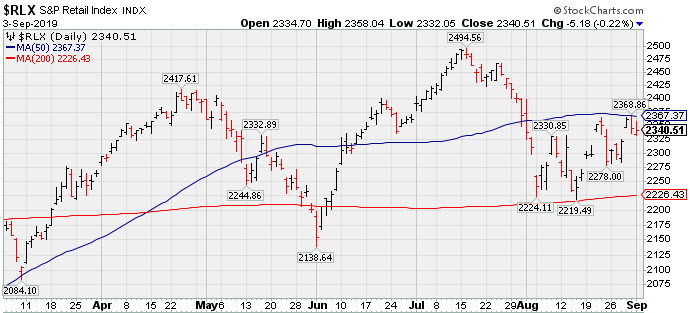
The Bank Index ($BKX -1.78%) and the Broker/Dealer Index ($XBD -0.98%) both suffered larger losses and the Retail Index ($RLX -0.22%) also created a slight drag on the major indices. The tech sector had a negative bias as the Semiconductor Index ($SOX -1.77%), Networking Index ($NWX -1.44%) and the Biotech Index ($BTK -2.52%) all lost ground. Energy-linked groups were also lower as the Integrated Oil Index ($XOI -0.42%) and the Oil Services Index ($OSX -1.46%) fell, meanwhile, the Gold & Silver Index ($XAU +1.25%) was a standout gainer.
PICTURED: The Retail Index ($RLX -0.22%) remains below its 50-day moving average (DMA) line. Rebounding above that line would be a reassuring sign, meanwhile, more damaging losses below the 200 DMA line would raise greater concerns for the broader market outlook.
| Oil Services |
$OSX |
61.97 |
-0.91 |
-1.45% |
-23.11% |
| Integrated Oil |
$XOI |
1,160.87 |
-4.86 |
-0.42% |
+0.15% |
| Semiconductor |
$SOX |
1,478.32 |
-26.60 |
-1.77% |
+27.97% |
| Networking |
$NWX |
541.65 |
-7.89 |
-1.44% |
+10.84% |
| Broker/Dealer |
$XBD |
254.53 |
-2.53 |
-0.98% |
+7.24% |
| Retail |
$RLX |
2,340.51 |
-5.18 |
-0.22% |
+19.94% |
| Gold & Silver |
$XAU |
100.21 |
+1.23 |
+1.24% |
+41.82% |
| Bank |
$BKX |
91.43 |
-1.66 |
-1.78% |
+6.57% |
| Biotech |
$BTK |
4,276.10 |
-110.61 |
-2.52% |
+1.31% |
|
|
|
 |
Sank Below 50-Day Average Toward Prior Lows With High Volume
Kenneth J. Gruneisen - Passed the CAN SLIM® Master's Exam
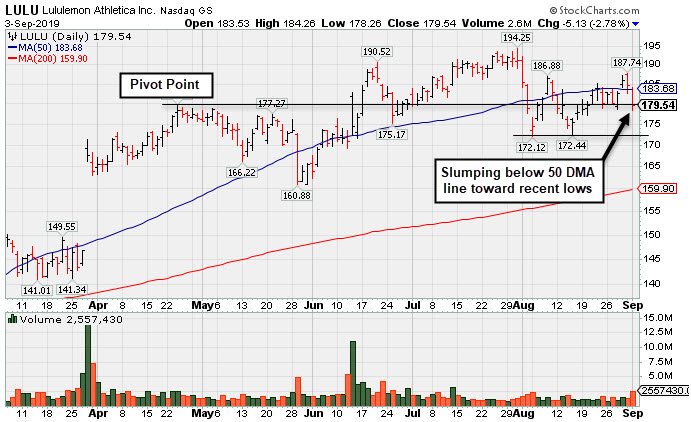
Lululemon Athletica (LULU -$5.13 or -2.78% to $179.54) is sputtering below its 50-day moving average (DMA) line ($183.68) toward prior lows. It faces near-term resistance due to overhead supply up to the $194 level which may limit its ability to rally. Keep in mind that it is due to report earnings news on 9/05/19. Volume and volatility often increase near earnings news. LULU reported Apr '19 quarterly earnings +35% on +20% sales revenues versus the year ago period, marking its 6th consecutive quarterly comparison above the +25% minimum guideline (C criteria). Recent quarterly comparisons showed stronger sales revenues and earnings improvement helping it match with the fact-based investment system's fundamental guidelines. It has a new CEO as of 8/20/18. It currently has a 95 Earnings Per Share Rating. Its Timeliness rating is B and Sponsorship rating is C. Its last appearance in this FSU section was on 8/15/19 with an annotated graph under the headline, "Sputtering After Slump Below 50-Day Moving Average". Following a "breakaway gap" it was highlighted in yellow with pivot point cited based on its 10/01/18 high plus 10 cents in the 3/28/19 mid-day report (read here). The number of top-rated funds owning its shares rose from 1,041 in Jun '18 to 1,418 in Jun '19, a good sign concerning the I criteria. LULU was first featured in yellow at $23.83 (split adjusted after 2:1 split effective 7/21/11) in the October 8, 2010 mid-day report (read here) and it traded up as much as +163.7% in a little more than 9 months. As previously noted - "In a bullish market, many high-ranked leaders offer multiple opportunities to accumulate their shares under the fact-based system's strict guidelines. Patience may often allow another ideal base or secondary buy point to possibly develop and be noted." Charts courtesy of www.stockcharts.com
 |
|
|
Color Codes Explained :
Y - Better candidates highlighted by our
staff of experts.
G - Previously featured
in past reports as yellow but may no longer be buyable under the
guidelines.
***Last / Change / Volume data in this table is the closing quote data***
Symbol/Exchange
Company Name
Industry Group |
PRICE |
CHANGE
(%Change) |
Day High |
Volume
(% DAV)
(% 50 day avg vol) |
52 Wk Hi
% From Hi |
Featured
Date |
Price
Featured |
Pivot Featured |
|
Max Buy |
 EPAM
-
NYSE
EPAM
-
NYSE
Epam Systems Inc
COMPUTER SOFTWARE and SERVICES - Information Technology Service
|
$188.27
|
-3.06
-1.60% |
$191.59
|
256,502
64.29% of 50 DAV
50 DAV is 399,000
|
$201.00
-6.33%
|
5/9/2019
|
$169.25
|
PP = $180.55
|
|
MB = $189.58
|
Most Recent Note - 8/29/2019 5:34:49 PM
G - Quietly consolidating above its 50 DMA line ($187.33). It has not formed a new base of sufficient length and faces some resistance due to overhead supply up to the $201 level. Reported earnings +27% on +24% sales revenues for the Jun '19 quarter. See the latest FSU analysis for more details and a new annotated graph.
>>> FEATURED STOCK ARTICLE : Volume Light During Brief Consolidation Above 50-Day Average - 8/29/2019 |
View all notes |
Set NEW NOTE alert |
Company Profile |
SEC
News |
Chart |
Request a new note
C
A
S
I |
AUDC
-
NASDAQ
Audiocodes Ltd
ELECTRONICS - Scientific and Technical Instrum
|
$17.57
|
+0.12
0.69% |
$18.02
|
135,122
79.02% of 50 DAV
50 DAV is 171,000
|
$19.74
-10.99%
|
7/15/2019
|
$17.10
|
PP = $17.54
|
|
MB = $18.42
|
Most Recent Note - 8/30/2019 4:59:14 PM
Y - Volume totals have been cooling while consolidating near important support defined by prior highs in the $17 area and its 50 DMA line ($17.16). More damaging losses would raise concerns and trigger technical sell signals. Reported earnings +57% on +14% sales revenues for the Jun '19 quarter, continuing its strong earnings track record. See the latest FSU analysis for more details and a new annotated graph.
>>> FEATURED STOCK ARTICLE : Volume Cooling While Consolidating Above Support Levels - 8/30/2019 |
View all notes |
Set NEW NOTE alert |
Company Profile |
SEC
News |
Chart |
Request a new note
C
A
S
I |
LHCG
-
NASDAQ
L H C Group Inc
HEALTH SERVICES - Home Health Care
|
$118.56
|
+0.06
0.05% |
$119.21
|
166,401
74.29% of 50 DAV
50 DAV is 224,000
|
$129.37
-8.36%
|
7/1/2019
|
$110.94
|
PP = $122.20
|
|
MB = $128.31
|
Most Recent Note - 8/30/2019 4:53:45 PM
G - Still quietly sputtering just below its 50 DMA line ($121.07) which has acted as resistance. Any breach of recent low ($116.67 on 8/13/19) could raise more serious concerns.
>>> FEATURED STOCK ARTICLE : Sputtering Below 50-Day Average and Below Pivot Point - 8/20/2019 |
View all notes |
Set NEW NOTE alert |
Company Profile |
SEC
News |
Chart |
Request a new note
C
A
S
I |
CHDN
-
NASDAQ
Churchill Downs Inc
LEISURE - Gaming Activities
|
$120.19
|
-3.07
-2.49% |
$122.96
|
216,359
93.66% of 50 DAV
50 DAV is 231,000
|
$132.73
-9.45%
|
7/22/2019
|
$118.45
|
PP = $118.89
|
|
MB = $124.83
|
Most Recent Note - 8/30/2019 4:52:31 PM
Y - Quietly hovering near its all-time high. Recently found support near its 50 DMA line ($118.61). The prior low ($113.88 on 8/05/19) defines the next important near-term support to watch. Reported Jun '19 earnings rose +10% on +26% sales revenues versus the year ago period, below the +25% minimum earnings guideline (C criteria).
>>> FEATURED STOCK ARTICLE : Recently Found Support at 50-Day Moving Average - 8/14/2019 |
View all notes |
Set NEW NOTE alert |
Company Profile |
SEC
News |
Chart |
Request a new note
C
A
S
I |
LULU
-
NASDAQ
Lululemon Athletica
MANUFACTURING - Textile Manufacturing
|
$179.54
|
-5.13
-2.78% |
$184.26
|
2,541,280
169.08% of 50 DAV
50 DAV is 1,503,000
|
$194.25
-7.57%
|
6/13/2019
|
$174.48
|
PP = $179.60
|
|
MB = $188.58
|
 Most Recent Note - 9/3/2019 5:44:10 PM
G - Slumped below its 50 DMA line ($183.68) today with a loss on heavier volume. Faces near-term resistance due to overhead supply up to the $194 level. Due to report earnings news on 9/05/19. Volume and volatility often increase near earnings news. See the latest FSU analysis for more details and a new annotated graph.
>>> FEATURED STOCK ARTICLE : Sank Below 50-Day Average Toward Prior Lows With High Volume - 9/3/2019 |
View all notes |
Set NEW NOTE alert |
Company Profile |
SEC
News |
Chart |
Request a new note
C
A
S
I |
Symbol/Exchange
Company Name
Industry Group |
PRICE |
CHANGE
(%Change) |
Day High |
Volume
(% DAV)
(% 50 day avg vol) |
52 Wk Hi
% From Hi |
Featured
Date |
Price
Featured |
Pivot Featured |
|
Max Buy |
ULTA
-
NASDAQ
Ulta Salon Cosm & Frag
SPECIALTY RETAIL - Specialty Retail, Other
|
$237.41
|
-0.32
-0.13% |
$244.21
|
5,427,484
506.44% of 50 DAV
50 DAV is 1,071,700
|
$368.83
-35.63%
|
3/15/2019
|
$341.27
|
PP = $322.59
|
|
MB = $338.72
|
Most Recent Note - 9/3/2019 5:47:30 PM
It will be dropped from the Featured Stocks list tonight. Gapped down on the prior session after reporting earnings +11% on +12% sales revenues for the Jul '19 quarter, violating its 200 DMA line ($320) and prior low triggering a worrisome technical sell signal. That marked its 2nd consecutive quarterly comparison below the +25% minimum earnings guideline (C criteria) and raised fundamental concerns. See the latest FSU analysis for more details and an annotated graph.
>>> FEATURED STOCK ARTICLE : Slumped Near 200-Day Average Ahead of Earnings Report - 8/28/2019 |
View all notes |
Set NEW NOTE alert |
Company Profile |
SEC
News |
Chart |
Request a new note
C
A
S
I |
CHGG
-
NYSE
Chegg Inc
Consumer Svcs-Education
|
$38.20
|
-1.44
-3.63% |
$39.81
|
1,326,318
82.48% of 50 DAV
50 DAV is 1,608,000
|
$48.22
-20.78%
|
7/8/2019
|
$44.11
|
PP = $41.79
|
|
MB = $43.88
|
Most Recent Note - 9/3/2019 5:52:12 PM
Slumped further below its 50 DMA line ($41.79) with today's big loss undercutting the prior low and slumping toward its 200 DMA line ($36.74). A rebound above the 50 DMA line is needed for its outlook to improve. Fundamentals remain strong. It will be dropped from the Featured Stocks list tonight.
>>> FEATURED STOCK ARTICLE : Sputtering Below 50-Day Average Line in Recent Weeks - 8/27/2019 |
View all notes |
Set NEW NOTE alert |
Company Profile |
SEC
News |
Chart |
Request a new note
C
A
S
I |
VEEV
-
NYSE
Veeva Systems Inc Cl A
Computer Sftwr-Medical
|
$157.81
|
-2.57
-1.60% |
$160.48
|
1,646,170
113.14% of 50 DAV
50 DAV is 1,455,000
|
$176.90
-10.79%
|
5/30/2019
|
$154.32
|
PP = $145.80
|
|
MB = $153.09
|
Most Recent Note - 8/30/2019
G - Sputtering below its 50 DMA line ($164.66). A convincing rebound is needed for its outlook to improve. The 50 DMA line has acted as resistance. Reported earnings +41% on +27% for the Jul '19 quarter continuing its strong earnings track record.
>>> FEATURED STOCK ARTICLE : Met Resistance After Slumping Below 50-Day Moving Average - 8/23/2019 |
View all notes |
Set NEW NOTE alert |
Company Profile |
SEC
News |
Chart |
Request a new note
C
A
S
I |
PAYC
-
NYSE
Paycom Software Inc
COMPUTER SOFTWARE and SERVICES - Application Software
|
$244.27
|
-5.85
-2.34% |
$250.32
|
550,382
91.58% of 50 DAV
50 DAV is 601,000
|
$259.71
-5.95%
|
8/20/2019
|
$246.97
|
PP = $246.95
|
|
MB = $259.30
|
Most Recent Note - 8/30/2019 4:55:28 PM
Y - Volume totals have been cooling while hovering near its all-time high. Color code was changed to yellow with new pivot point cited based on its 7/11/19 high plus 10 cents. Gains above a stock's pivot must have at least +40% above average volume to trigger a proper new (or add-on) technical buy signal. Its 50 DMA line ($237) defines support above the recent low ($216.55 on 8/05/19). Fundamentals remain strong.
>>> FEATURED STOCK ARTICLE : Recently Wedged Higher Without Great Volume Conviction - 8/26/2019 |
View all notes |
Set NEW NOTE alert |
Company Profile |
SEC
News |
Chart |
Request a new note
C
A
S
I |
BLD
-
NYSE
Topbuild Corp
Bldg-Constr Prds/Misc
|
$89.83
|
-2.79
-3.01% |
$92.41
|
217,344
73.93% of 50 DAV
50 DAV is 294,000
|
$93.59
-4.02%
|
5/17/2019
|
$82.19
|
PP = $87.31
|
|
MB = $91.68
|
Most Recent Note - 9/3/2019 5:49:12 PM
G - Hovering near its all-time high following bullish action after it reported earnings +39% on +9% sales revenues for the Jun '19 quarter versus the year ago period. Prior highs in the $86 area define initial support to watch above 50 DMA line ($85.27) on pullbacks.
>>> FEATURED STOCK ARTICLE : Topbuild Has 4 Consecutive Weekly Gains and Stubbornly Held Ground - 8/19/2019 |
View all notes |
Set NEW NOTE alert |
Company Profile |
SEC
News |
Chart |
Request a new note
C
A
S
I |
Symbol/Exchange
Company Name
Industry Group |
PRICE |
CHANGE
(%Change) |
Day High |
Volume
(% DAV)
(% 50 day avg vol) |
52 Wk Hi
% From Hi |
Featured
Date |
Price
Featured |
Pivot Featured |
|
Max Buy |
TEAM
-
NASDAQ
Atlassian Corp Plc Cl A
Comp Sftwr-Spec Enterprs
|
$131.89
|
-2.62
-1.95% |
$135.69
|
1,195,608
94.96% of 50 DAV
50 DAV is 1,259,000
|
$149.80
-11.96%
|
8/27/2019
|
$142.62
|
PP = $149.90
|
|
MB = $157.40
|
Most Recent Note - 8/30/2019 1:28:37 PM
G - Color code is changed to green after violating its 50 DMA line with today's 4th consecutive loss Formed a 5-week flat base with new pivot point cited based on its 7/26/19 high plus 10 cents. Prior low ($130.78 on 7/23/19) defines the next important near-term support to watch where a violation would raise serious concerns and trigger a more worrisome technical sell signal. Reported earnings +43% on +36% sales revenues for the Jun '19 quarter, continuing its strong earnings track record.
>>> FEATURED STOCK ARTICLE : Consolidating Near High After Recently Finding Support - 8/21/2019 |
View all notes |
Set NEW NOTE alert |
Company Profile |
SEC
News |
Chart |
Request a new note
C
A
S
I |
TTD
-
NASDAQ
The Trade Desk Inc Cl A
Comml Svcs-Advertising
|
$234.98
|
-10.79
-4.39% |
$245.90
|
1,259,720
87.42% of 50 DAV
50 DAV is 1,441,000
|
$289.51
-18.84%
|
7/18/2019
|
$240.61
|
PP = $258.10
|
|
MB = $271.01
|
Most Recent Note - 9/3/2019 5:46:35 PM
G - Slumped below its 50 DMA line ($248) and below the recent low ($239.01 on 8/21/19) raising concerns and triggering technical sell signals. Only a prompt rebound above the 50 DMA line would help its outlook improve. Reported Jun '19 quarterly earnings +58% on +42% sales revenues.
>>> FEATURED STOCK ARTICLE : Consolidating Near 50-Day Moving Average Line - 8/16/2019 |
View all notes |
Set NEW NOTE alert |
Company Profile |
SEC
News |
Chart |
Request a new note
C
A
S
I |
PAGS
-
NYSE
Pagseguro Digital Cl A
Finance-CrdtCard/PmtPr
|
$50.11
|
+0.15
0.30% |
$51.08
|
1,396,843
63.01% of 50 DAV
50 DAV is 2,217,000
|
$53.43
-6.21%
|
6/25/2019
|
$37.69
|
PP = $40.07
|
|
MB = $42.07
|
Most Recent Note - 8/29/2019 5:57:16 PM
G - Volume totals have been cooling while hovering near its all-time high. Its 50 DMA line ($44.73) and the recent low ($42.00 on 8/05/19) define important levels to watch on pullbacks. Reported earnings +35% on +39% sales revenues for the quarter ended June 30,2019 versus the year ago period.
>>> FEATURED STOCK ARTICLE : Brazil-Based Digital Payments Firm Perched at All-Time High - 8/22/2019 |
View all notes |
Set NEW NOTE alert |
Company Profile |
SEC
News |
Chart |
Request a new note
C
A
S
I |
|
|
|
THESE ARE NOT BUY RECOMMENDATIONS!
Comments contained in the body of this report are technical
opinions only. The material herein has been obtained
from sources believed to be reliable and accurate, however,
its accuracy and completeness cannot be guaranteed.
This site is not an investment advisor, hence it does
not endorse or recommend any securities or other investments.
Any recommendation contained in this report may not
be suitable for all investors and it is not to be deemed
an offer or solicitation on our part with respect to
the purchase or sale of any securities. All trademarks,
service marks and trade names appearing in this report
are the property of their respective owners, and are
likewise used for identification purposes only.
This report is a service available
only to active Paid Premium Members.
You may opt-out of receiving report notifications
at any time. Questions or comments may be submitted
by writing to Premium Membership Services 665 S.E. 10 Street, Suite 201 Deerfield Beach, FL 33441-5634 or by calling 1-800-965-8307
or 954-785-1121.
|
|
|