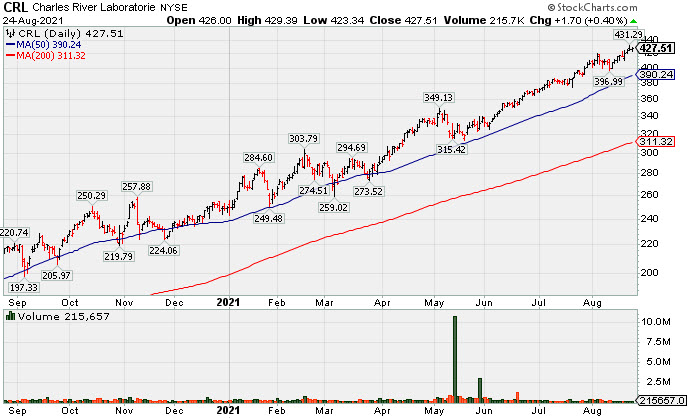
Wedging Higher With Gains Lacking Volume Conviction - Tuesday, August 24, 2021
Charles River Labs Intl (CRL +$1.70 or +0.40% to $427.51) has wedged higher with gains lacking great volume conviction as it inched into record high territory. It is extended from any sound base. Its 50-day moving average (DMA) line ($390) defines near-term support to watch on pullbacks.
CRL has a 92 Earnings Per Share Rating. It reported Jun '21 quarterly earnings +65% on +34% sales revenues versus the year ago period. Three of the past 4 quarterly comparisons have been above the +25% minimum earnings guideline (C criteria) while sequential comparisons show encouraging acceleration in its sales revenues growth rate indicative of greater demand for its products or services.
The Medical - Research Equipment/Services industry group currently has an A (84) Group Relative Strength Rating (L criteria). CRL has traded up +122% since it was highlighted in yellow with pivot point cited based on its 6/03/20 high plus 10 cents in the 7/15/20 mid-day report (read here). It was last shown in this FSU section on 7/13/21 with an annotated graph under the headline, "Volume Totals Cooling While Perched at High".
The number of top-rated funds owning its shares rose from 681 in Dec '19 to 1,160 in Jun '21. Its current Up/Down Volume Ratio of 1.3 is an unbiased indication its shares have been under accumulation over the past 50 days. There is a small number of only 50.4 million shares (S criteria) outstanding, which can contribute to greater price volatility in the event of institutional buying or selling.
Chart courtesy of www.stockcharts.com
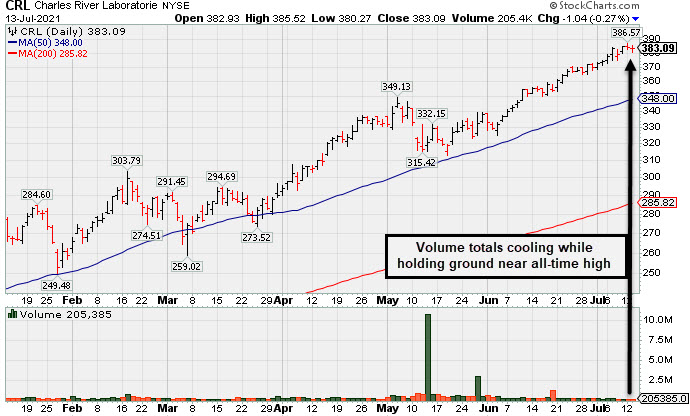
Volume Totals Cooling While Perched at High - Tuesday, July 13, 2021
Charles River Labs Intl (CRL -$1.04 or -0.27% to $383.09) has seen volume totals cooling. Below average volume was behind recent gains as it wedged into record high territory. Prior highs in the $349 area and its 50-day moving average (DMA) line ($348) define near-term support to watch on pullbacks.
CRL has a 90 Earnings Per Share Rating. It reported Mar '21 quarterly earnings +38% on +17% sales revenues versus the year ago period. Two of the past 3 quarterly comparisons have been above the +25% minimum earnings guideline (C criteria).
The Medical - Research Equipment/Services industry group currently has an A- (77) Group Relative Strength Rating (L criteria). CRL traded up as much as +102% since it was highlighted in yellow with pivot point cited based on its 6/03/20 high plus 10 cents in the 7/15/20 mid-day report (read here). It was last shown in this FSU section on 6/09/21 with an annotated graph under the headline, "Building New Base After Strong Quarterly Earnings Report".
The number of top-rated funds owning its shares rose from 681 in Dec '19 to 1,042 in Jun '21. Its current Up/Down Volume Ratio of 2.3 is an unbiased indication its shares have been under accumulation over the past 50 days. There is a small number of only 50.3 million shares (S criteria) outstanding, which can contribute to greater price volatility in the event of institutional buying or selling.
Chart courtesy of www.stockcharts.com
Building New Base After Strong Quarterly Earnings Report - Wednesday, June 9, 2021
Charles River Labs Intl (CRL +$2.89 or +0.84% to $345.91) posted a 5th consecutive gain with below average volume, wedging toward its prior high. It found support when consolidating above its 50-day moving average (DMA) line ($323) in recent weeks. Its color code is changed to yellow as a new pivot point is cited based on its 5/05/21 high plus 10 cents after a 5-week flat base. Subsequent gains above the pivot point backed by at least +40% above average volume.
It reported Mar '21 quarterly earnings +38% on +17% sales revenues versus the year ago period. Two of the past 3 quarterly comparisons have been above the +25% minimum earnings guideline (C criteria).It has a 90 Earnings Per Share Rating.
The Medical - Research Equipment/Services industry group currently has a B- (54) Group Relative Strength Rating (L criteria). CRL traded up as much as +81% since it was highlighted in yellow with pivot point cited based on its 6/03/20 high plus 10 cents in the 7/15/20 mid-day report (read here). It was last shown in this FSU section on 506/21 with an annotated graph under the headline, "Pulling Back From Record High Following Strong Quarterly Report".
The number of top-rated funds owning its shares rose from 681 in Dec '19 to 867 in Mar '21. Its current Up/Down Volume Ratio of 2.8 is an unbiased indication its shares have been under accumulation over the past 50 days. There is a small number of only 50.3 million shares (S criteria) outstanding, which can contribute to greater price volatility in the event of institutional buying or selling.
Chart courtesy of www.stockcharts.com

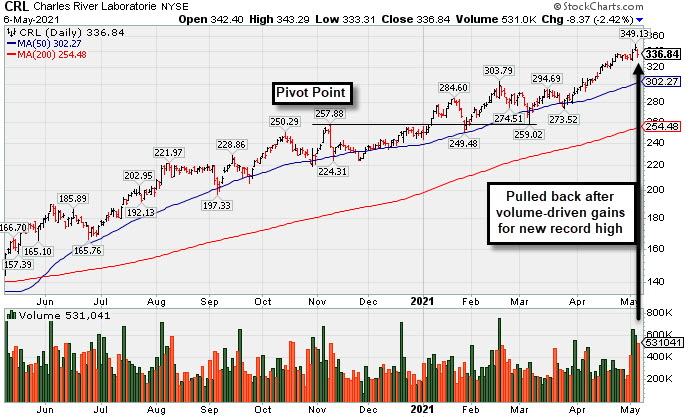
Pulling Back From Record High Following Strong Quarterly Report - Thursday, May 6, 2021
Charles River Labs Intl (CRL -$8.37 or -2.42% to $336.84) pulled from its all-time high with today's volume-driven loss following 2 volume-driven gains. It is extended from any sound base. Its 50-day moving average (DMA) line ($302.27) acted as support throughout its ongoing ascent.
Recently CRL reported Mar '21 quarterly earnings +38% on +17% sales revenues versus the year ago period. Two of the 3 latest quarterly comparisons have been above the +25% minimum earnings guideline (C criteria). It has a 90 Earnings Per Share Rating. The Medical - Research Equipment/Services industry group currently has a mediocre C- (37) Group Relative Strength Rating (L criteria). CRL traded up as much as +81% since it was highlighted in yellow with pivot point cited based on its 6/03/20 high plus 10 cents in the 7/15/20 mid-day report (read here). It was last shown in this FSU section on 4/09/21 with an annotated graph under the headline, "Perched at Record High After Rally From 50-Day Moving Average".
Recently CRL reported Mar '21 quarterly earnings +38% on +17% sales revenues versus the year ago period. Two of the 3 latest quarterly comparisons have been above the +25% minimum earnings guideline (C criteria). It has a 90 Earnings Per Share Rating. The Medical - Research Equipment/Services industry group currently has a mediocre C- (37) Group Relative Strength Rating (L criteria). CRL traded up as much as +81% since it was highlighted in yellow with pivot point cited based on its 6/03/20 high plus 10 cents in the 7/15/20 mid-day report (read here). It was last shown in this FSU section on 4/09/21 with an annotated graph under the headline, "Perched at Record High After Rally From 50-Day Moving Average".
The number of top-rated funds owning its shares rose from 681 in Dec '19 to 879 in Mar '21, and its Up/Down Volume Ratio is 1.8 is an unbiased indication its shares have been under accumulation over the past 50 days. There is a small number of only 50.3 million shares (S criteria) outstanding, which can contribute to greater price volatility in the event of institutional buying or selling.
Chart courtesy of www.stockcharts.com
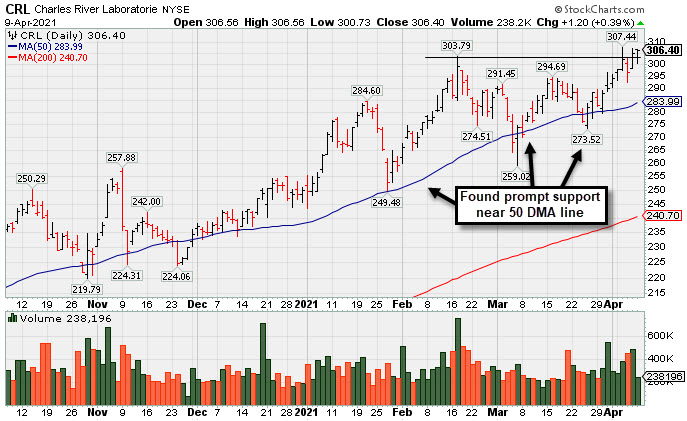
Perched at Record High After Rally From 50-Day Moving Average - Friday, April 9, 2021
Charles River Labs Intl (CRL +$1.20 or +0.39% to $306.40) posted a quiet gain for a best-ever close, its 7th gain in 8 sessions. It hit new all-time highs with recent volume-driven gains. Prompt support was found near the 50-day moving average (DMA) line ($284) throughout its ongoing ascent. Any damaging losses below the 50 DMA line and prior lows would raise concerns and trigger technical sell signals. Its Relative Strength Rating is 77, below the 80+ minimum guideline for buy candidates.
It still has a 92 Earnings Per Share Rating, but reported Dec '20 quarterly earnings +19% on +14% sales revenues versus the year ago period, below the +25% minimum earnings guideline (C criteria), raising fundamental concerns. The Medical - Research Equipment/Services industry group currently has a mediocre C- (35) Group Relative Strength Rating (L criteria). CRL traded up as much as +59.6% since it was highlighted in yellow with pivot point cited based on its 6/03/20 high plus 10 cents in the 7/15/20 mid-day report (read here). It was last shown in this FSU section on 3/16/21 with an annotated graph under the headline, "Made Gradual Progress, Now Extended From Any Sound Base".
The number of top-rated funds owning its shares rose from 681 in Dec '19 to 848 in Dec '20, and its Up/Down Volume Ratio is 1.4 is an unbiased indication its shares have been under accumulation over the past 50 days. There is a small number of only 49.8 million shares (S criteria) outstanding, which can contribute to greater price volatility in the event of institutional buying or selling.
Chart courtesy of www.stockcharts.com
Made Gradual Progress, Now Extended From Any Sound Base -
Charles River Labs Intl (CRL -$3.56 or -1.22% to $288.53) ended lower today with light volume. It is extended from any sound base and consolidating above its 50-day moving average (DMA) line ($276), which recently acted as support, as it has during prior consolidations. More damaging losses would raise concerns and trigger technical sell signals.
Its Relative Strength Rating is 75, below the 80+ minimum guideline for buy candidates. Recently reported Dec '20 quarterly earnings +19% on +14% sales revenues versus the year ago period, below the +25% minimum earnings guideline (C criteria), raising fundamental concerns.
Its Relative Strength Rating is 75, below the 80+ minimum guideline for buy candidates. Recently reported Dec '20 quarterly earnings +19% on +14% sales revenues versus the year ago period, below the +25% minimum earnings guideline (C criteria), raising fundamental concerns.
It hails from the Medical - Research Equipment/Services industry group which currently has a mediocre C (41) Group Relative Strength Rating (L criteria). CRL traded up as much as +57.7% since it was highlighted in yellow with pivot point cited based on its 6/03/20 high plus 10 cents in the 7/15/20 mid-day report (read here). It was last shown in this FSU section on 3/01/21 with an annotated graph under the headline, "CRL Still Hovering Near Record High".
The number of top-rated funds owning its shares rose from 681 in Dec '19 to 840 in Dec '20, and its Up/Down Volume Ratio is 1.3 is an unbiased indication its shares have been under accumulation over the past 50 days. There is a small number of only 49.8 million shares (S criteria) outstanding, which can contribute to greater price volatility in the event of institutional buying or selling.
Chart courtesy of www.stockcharts.com
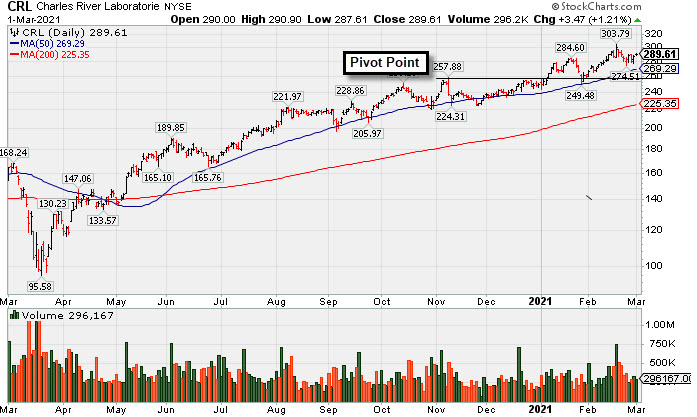
CRL Still Hovering Near Record High - Monday, March 1, 2021
Charles River Labs Intl (CRL +$3.47 or +1.21% to $289.61) posted a small gain today with below average volume. It is extended from any sound base and has been sputtering since it reported Dec '20 quarterly earnings +19% on +14% sales revenues versus the year ago period, below the +25% minimum earnings guideline (C criteria). It still has a 92 Earnings Per Share Rating. Annual earnings (A criteria) history has been strong and steady.
Its Relative Strength Rating is 78, just below the 80+ minimum guideline for buy candidates. It found prompt support near the prior high ($257) and its 50-day moving average DMA line ($269) when they were tested during the prior consolidation. More damaging losses would raise concerns and trigger technical sell signals.
It hails from the Medical - Research Equipment/Services industry group which currently has a mediocre B- (52) Group Relative Strength Rating (L criteria). CRL traded up as much as +57.7% since it was highlighted in yellow with pivot point cited based on its 6/03/20 high plus 10 cents in the 7/15/20 mid-day report (read here). It was last shown in this FSU section on 1/29/21 with an annotated graph under the headline, "Testing Important Support on Pullback".
The number of top-rated funds owning its shares rose from 681 in Dec '19 to 833 in Dec '20, and its Up/Down Volume Ratio is 1.4 is an unbiased indication its shares have been under accumulation over the past 50 days. There is a small number of only 49.8 million shares (S criteria) outstanding, which can contribute to greater price volatility in the event of institutional buying or selling.
Chart courtesy of www.stockcharts.com
Testing Important Support on Pullback - Friday, January 29, 2021
Charles River Labs Intl (CRL -$1.83 or -0.70% to $259.05) pulled back further with lighter volume behind today's loss. The prior high ($257) and support at its 50-day moving average DMA line ($250.46) were tested with the pullback this week. More damaging losses would raise concerns and trigger technical sell signals.
It is due to report Dec '20 quarterly results on 2/17/21. Volume and volatility often increase near earnings news. CRL reported Sep '20 quarterly earnings +38% on +11% sales revenues versus the year ago period, above the +25% minimum earnings guideline (C criteria). It now has a 90 Earnings Per Share Rating. Annual earnings (A criteria) history has been strong and steady.
It is due to report Dec '20 quarterly results on 2/17/21. Volume and volatility often increase near earnings news. CRL reported Sep '20 quarterly earnings +38% on +11% sales revenues versus the year ago period, above the +25% minimum earnings guideline (C criteria). It now has a 90 Earnings Per Share Rating. Annual earnings (A criteria) history has been strong and steady.
It hails from the Medical - Research Equipment/Services industry group which currently has a mediocre C(37) Group Relative Strength Rating (L criteria). CRL traded up as much as +29.9% since it was highlighted in yellow with pivot point cited based on its 6/03/20 high plus 10 cents in the 7/15/20 mid-day report (read here). It was last shown in this FSU section on 1/05/21 with an annotated graph under the headline, "Hovering in Tight Range Holding Ground Near High".
The number of top-rated funds owning its shares rose from 681 in Dec '19 to 810 in Dec '20, and its Up/Down Volume Ratio is 1.0 is an unbiased indication its shares have been neutral concerning accumulation/distribution over the past 50 days. There is a small number of only 49.7 million shares (S criteria) outstanding, which can contribute to greater price volatility in the event of institutional buying or selling.
Chart courtesy of www.stockcharts.com

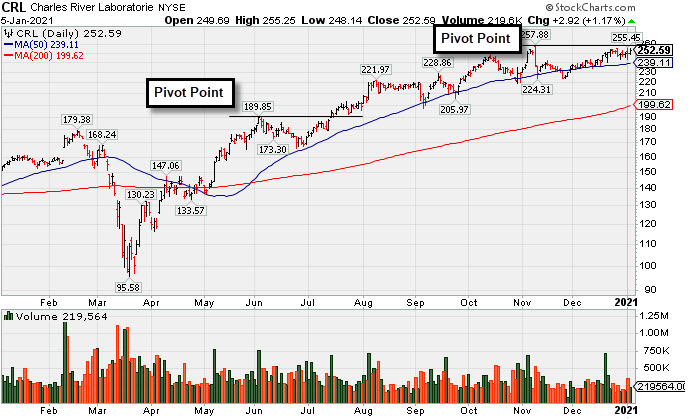
Hovering in Tight Range Holding Ground Near High - Tuesday, January 5, 2021
Charles River Labs Intl (CRL +$2.92 or +1.17% to $252.59) posted a small gain today with light volume while ended 3 cent below its best-ever close. It has been hovering in a tight range near its high, stubbornly holding its ground. The pivot point cited is based on its 11/09/20 high plus 10 cents. Subsequent gains above its pivot point backed by at least +40% above average volume may trigger a new (or add-on) technical buy signal. Its 50-day moving average (DMA) line ($239) has been acting as support.
CRL reported Sep '20 quarterly earnings +38% on +11% sales revenues versus the year ago period, above the +25% minimum earnings guideline (C criteria). Fundamental concerns had been raised when it reported Jun '20 quarterly earnings -3% on +4% sales revenues, below the +25% minimum guideline (C criteria), but the results were better than expected and the company also raised its guidance. It now has a 91 Earnings Per Share Rating, down from 96 prior to the report. The 2 prior quarterly earnings increases were above the +25% minimum guideline (C criteria) of the fact-based investment system. Annual earnings (A criteria) history has been strong and steady.
CRL reported Sep '20 quarterly earnings +38% on +11% sales revenues versus the year ago period, above the +25% minimum earnings guideline (C criteria). Fundamental concerns had been raised when it reported Jun '20 quarterly earnings -3% on +4% sales revenues, below the +25% minimum guideline (C criteria), but the results were better than expected and the company also raised its guidance. It now has a 91 Earnings Per Share Rating, down from 96 prior to the report. The 2 prior quarterly earnings increases were above the +25% minimum guideline (C criteria) of the fact-based investment system. Annual earnings (A criteria) history has been strong and steady.
It hails from the Medical - Research Equipment/Services industry group which currently has a mediocre C(42) Group Relative Strength Rating (L criteria). CRL traded up as much as +29.9% since it was highlighted in yellow with pivot point cited based on its 6/03/20 high plus 10 cents in the 7/15/20 mid-day report (read here). It was last shown in this FSU section on 12/14/20 with an annotated graph under the headline, "Consolidating Above 50-Day Moving Average Line".
The number of top-rated funds owning its shares rose from 681 in Dec '19 to 808 in Sep '20, and its Up/Down Volume Ratio is 1.0 is an unbiased indication its shares have been neutral concerning accumulation/distribution over the past 50 days. There is a small number of only 49.7 million shares (S criteria) outstanding, which can contribute to greater price volatility in the event of institutional buying or selling.
Chart courtesy of www.stockcharts.com
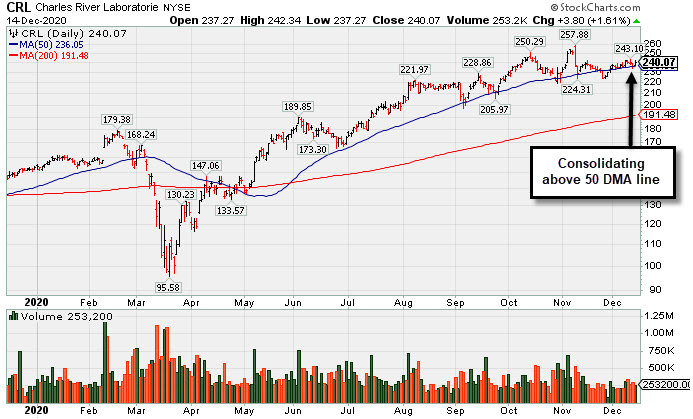
CRL Consolidating Above 50-Day Moving Average Line - Monday, December 14, 2020
Charles River Labs Intl (CRL +$3.80 or +1.61% to $240.07) has been consolidating above its 50-day moving average (DMA) line ($236) which has been acting as support. More damaging losses would raise greater concerns and may trigger worrisome technical sell signals. There was a noted "negative reversal" at its all-time high on 11/09/20.
CRL reported Sep '20 quarterly earnings +38% on +11% sales revenues versus the year ago period, above the +25% minimum earnings guideline (C criteria). Fundamental concerns had been raised when it reported Jun '20 quarterly earnings -3% on +4% sales revenues, below the +25% minimum guideline (C criteria), but the results were better than expected and the company also raised its guidance. It now has a 91 Earnings Per Share Rating, down from 96 prior to the report. The 2 prior quarterly earnings increases were above the +25% minimum guideline (C criteria) of the fact-based investment system. Annual earnings (A criteria) history has been strong and steady.
CRL traded up as much as +29.9% since it was highlighted in yellow with pivot point cited based on its 6/03/20 high plus 10 cents in the 7/15/20 mid-day report (read here). It was last shown in this FSU section on 11/23/20 with an annotated graph under the headline, "Consolidating Near Important Support Levels".
It hails from the Medical - Research Equipment/Services industry group which has an 69 Group Relative Strength Rating (L criteria). The number of top-rated funds owning its shares rose from 681 in Dec '19 to 795 in Sep '20, and its Up/Down Volume Ratio is 0.8 is an unbiased indication its shares have been under distributional pressure over the past 50 days. There is a small number of only 49.7 million shares (S criteria) outstanding, which can contribute to greater price volatility in the event of institutional buying or selling.
Chart courtesy of www.stockcharts.com
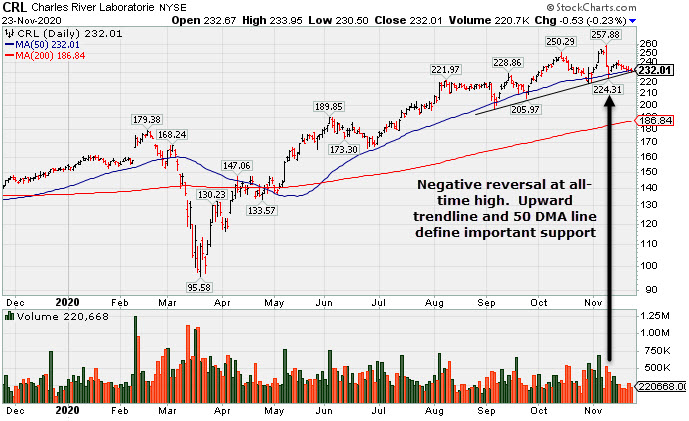
Consolidating Near Important Support Levels - Monday, November 23, 2020
Charles River Labs Intl (CRL -$0.53 or -0.23% to $232.01) has edged lower with volume totals below average behind 6 consecutive losses. There was a noted "negative reversal" at its all-time high on 11/09/20. Near-term support is defined by an upward trendline and its 50-day moving average (DMA) line ($232). More damaging losses would raise greater concerns and may trigger worrisome technical sell signals.
CRL reported Sep '20 quarterly earnings +38% on +11% sales revenues versus the year ago period, above the +25% minimum earnings guideline (C criteria). Fundamental concerns had been raised when it reported Jun '20 quarterly earnings -3% on +4% sales revenues, below the +25% minimum guideline (C criteria), but the results were better than expected and the company also raised its guidance. It now has a 91 Earnings Per Share Rating, down from 96 prior to the report. The 2 prior quarterly earnings increases were above the +25% minimum guideline (C criteria) of the fact-based investment system. Annual earnings (A criteria) history has been strong and steady.
CRL reported Sep '20 quarterly earnings +38% on +11% sales revenues versus the year ago period, above the +25% minimum earnings guideline (C criteria). Fundamental concerns had been raised when it reported Jun '20 quarterly earnings -3% on +4% sales revenues, below the +25% minimum guideline (C criteria), but the results were better than expected and the company also raised its guidance. It now has a 91 Earnings Per Share Rating, down from 96 prior to the report. The 2 prior quarterly earnings increases were above the +25% minimum guideline (C criteria) of the fact-based investment system. Annual earnings (A criteria) history has been strong and steady.
CRL traded up as much as +29.9% since it was highlighted in yellow with pivot point cited based on its 6/03/20 high plus 10 cents in the 7/15/20 mid-day report (read here). It was last shown in this FSU section on 10/27/20 with an annotated graph under the headline, "Earnings Due; Consolidating Near Prior High and Above 50 DMA Line".
It hails from the Medical - Research Equipment/Services industry group which has an 48 Group Relative Strength Rating (L criteria). The number of top-rated funds owning its shares rose from 681 in Dec '19 to 797 in Sep '20, and its Up/Down Volume Ratio is 0.9 is an unbiased indication its shares have been under slight distributional pressure over the past 50 days. There is a small number of only 49.7 million shares (S criteria) outstanding, which can contribute to greater price volatility in the event of institutional buying or selling.
Chart courtesy of www.stockcharts.com
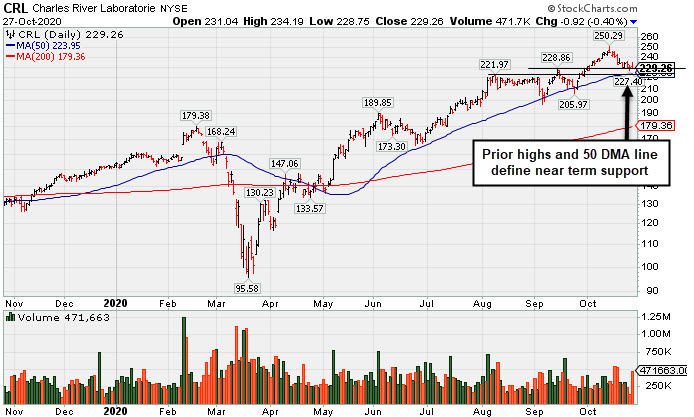
Earnings Due; Consolidating Near Prior High and Above 50 DMA Line - Tuesday, October 27, 2020
Charles River Labs Intl (CRL -$0.92 or -0.40% to $229.26) is consolidating above prior highs and above its 50-day moving average (DMA) line ($224) which define near-term support to watch. Any subsequent violations would raise concerns and may trigger technical sell signals. Keep in mind it is due to to report Sep '20 quarterly results on 10/29/20. Volume and volatility often increase near earnings news.
Fundamental concerns were raised when it reported Jun '20 quarterly earnings -3% on +4% sales revenues, below the +25% minimum guideline (C criteria), but the results were better than expected and the company also raised its guidance. It now has a 91 Earnings Per Share Rating, down from 96 prior to the report. The 2 prior quarterly earnings increases were above the +25% minimum guideline (C criteria) of the fact-based investment system. Annual earnings (A criteria) history has been strong and steady.
CRL traded up as much as +29.9% since it was highlighted in yellow with pivot point cited based on its 6/03/20 high plus 10 cents in the 7/15/20 mid-day report (read here). It was last shown in this FSU section on 10/09/20 with an annotated graph under the headline, "New Record High for Charles River Labs".
It hails from the Medical - Research Equipment/Services industry group which has an 66 Group Relative Strength Rating (L criteria). The number of top-rated funds owning its shares rose from 681 in Dec '19 to 775 in Sep '20, and its Up/Down Volume Ratio is 0.9 is an unbiased indication its shares have been under slight distributional pressure over the past 50 days. There is a small number of only 49.7 million shares (S criteria) outstanding, which can contribute to greater price volatility in the event of institutional buying or selling.
It hails from the Medical - Research Equipment/Services industry group which has an 66 Group Relative Strength Rating (L criteria). The number of top-rated funds owning its shares rose from 681 in Dec '19 to 775 in Sep '20, and its Up/Down Volume Ratio is 0.9 is an unbiased indication its shares have been under slight distributional pressure over the past 50 days. There is a small number of only 49.7 million shares (S criteria) outstanding, which can contribute to greater price volatility in the event of institutional buying or selling.
Chart courtesy of www.stockcharts.com
New Record High for Charles River Labs - Friday, October 9, 2020
Charles River Labs Intl (CRL +$6.08 or +2.57% to $242.57) posted a big gain with +22% above average volume today for a new all-time high. During its recent consolidations it found prompt support at its 50-day moving average (DMA) line ($218.54) where any subsequent violation would raise concerns and trigger a technical sell signal.
Fundamental concerns were raised when it reported Jun '20 quarterly earnings -3% on +4% sales revenues, below the +25% minimum guideline (C criteria), but the results were better than expected and the company also raised its guidance. It now has a 92 Earnings Per Share Rating, down from 96 prior to the report. The 2 prior quarterly earnings increases were above the +25% minimum guideline (C criteria) of the fact-based investment system. Annual earnings (A criteria) history has been strong and steady.
Fundamental concerns were raised when it reported Jun '20 quarterly earnings -3% on +4% sales revenues, below the +25% minimum guideline (C criteria), but the results were better than expected and the company also raised its guidance. It now has a 92 Earnings Per Share Rating, down from 96 prior to the report. The 2 prior quarterly earnings increases were above the +25% minimum guideline (C criteria) of the fact-based investment system. Annual earnings (A criteria) history has been strong and steady.
CRL traded up as much as +25.9% since it was highlighted in yellow with pivot point cited based on its 6/03/20 high plus 10 cents in the 7/15/20 mid-day report (read here). It was last shown in this FSU section on 9/24/20 with an annotated graph under the headline, "Showed Resilience When Testing 50-Day Moving Average Line Again".
It hails from the Medical - Research Equipment/Services industry group which has an 65 Group Relative Strength Rating (L criteria). The number of top-rated funds owning its shares rose from 681 in Dec '19 to 771 in Jun '20, and its Up/Down Volume Ratio is 0.9 is an unbiased indication its shares have been under slight distributional pressure over the past 50 days. There is a small number of only 49.7 million shares (S criteria) outstanding, which can contribute to greater price volatility in the event of institutional buying or selling.
Chart courtesy of www.stockcharts.com

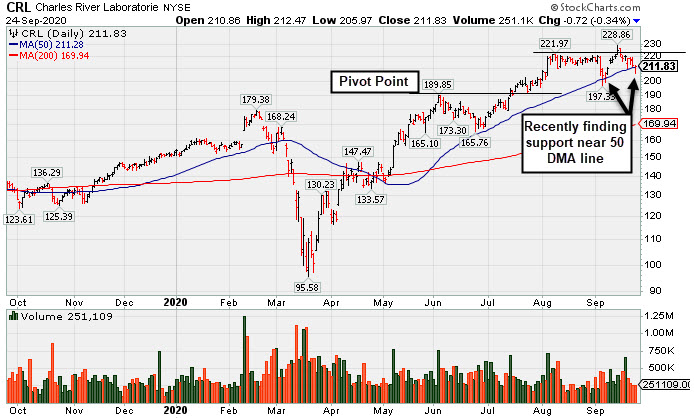
Showed Resilience When Testing 50-Day Moving Average Line Again - Thursday, September 24, 2020
Charles River Labs Intl (CRL -$0.72 or -0.34% to $211.83) pulled back for a 4th consecutive loss today with below average volume, however, it showed resilience and finished near the session high and above its 50-day moving average (DMA) line after a deeper loss earlier in the session. More damaging losses would raise greater concerns and trigger a technical sell signal.
It recently cleared prior highs in the $221 area but promptly slumped back into the prior base. Subsequent gains into new high territory would help its outlook improve. However, it recently raised fundamental concerns when it reported Jun '20 quarterly earnings -3% on +4% sales revenues, below the +25% minimum guideline (C criteria), but the results were better than expected and the company also raised its guidance. It now has a 92 Earnings Per Share Rating, down from 96 prior to the report. The 2 prior quarterly earnings increases were above the +25% minimum guideline (C criteria) of the fact-based investment system. Annual earnings (A criteria) history has been strong and steady.
CRL traded up as much as +18.8% since it was highlighted in yellow with pivot point cited based on its 6/03/20 high plus 10 cents in the 7/15/20 mid-day report (read here). It was last shown in this FSU section on 9/11/20 with an annotated graph under the headline, "Found Prompt Support at 50-Day Moving Average Line".
It hails from the Medical - Research Equipment/Services industry group which has an 73 Group Relative Strength Rating (L criteria). The number of top-rated funds owning its shares rose from 681 in Dec '19 to 753 in Jun '20, and its Up/Down Volume Ratio is 1.1 is an unbiased indication its shares have been under slight accumulation over the past 50 days. There is a small number of only 49.7 million shares (S criteria) outstanding, which can contribute to greater price volatility in the event of institutional buying or selling.
Chart courtesy of www.stockcharts.com
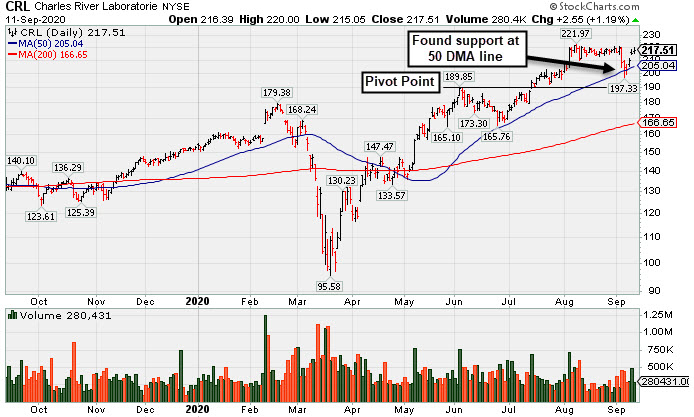
Found Prompt Support at 50-Day Moving Average Line - Friday, September 11, 2020
Charles River Labs Intl (CRL +$2.55 or +1.19% to $217.51) showed resilience this week and rebounded near its all-time high with 3 consecutive gains. It found prompt support at its 50-day moving average (DMA) line ($205.04) after a spurt of volume-driven losses. Subsequent losses leading to a violation of the 50 DMA line and prior low ($197.33 on 9.04/20) may raise greater concerns and trigger technical sell signals.
Recently it raised fundamental concerns after it reported Jun '20 quarterly earnings -3% on +4% sales revenues, below the +25% minimum guideline (C criteria), but the results were better than expected and the company also raised its guidance. It now has a 92 Earnings Per Share Rating, down from 96 prior to the report. The 2 prior quarterly earnings increases were above the +25% minimum guideline (C criteria) of the fact-based investment system. Annual earnings (A criteria) history has been strong and steady.
CRL traded up as much as +15.2% since it was highlighted in yellow with pivot point cited based on its 6/03/20 high plus 10 cents in the 7/15/20 mid-day report (read here). It was last shown in this FSU section on 8/25/20 with an annotated graph under the headline, "Volume Totals Cooling While Hovering in Tight Range Near Record High".
It hails from the Medical - Research Equipment/Services industry group which has an 74 Group Relative Strength Rating (L criteria). The number of top-rated funds owning its shares rose from 681 in Dec '19 to 755 in Jun '20, and its Up/Down Volume Ratio is 1.3, an unbiased indication its shares have been under accumulation over the past 50 days. There is a small number of only 49.7 million shares (S criteria) outstanding, which can contribute to greater price volatility in the event of institutional buying or selling.
Chart courtesy of www.stockcharts.com
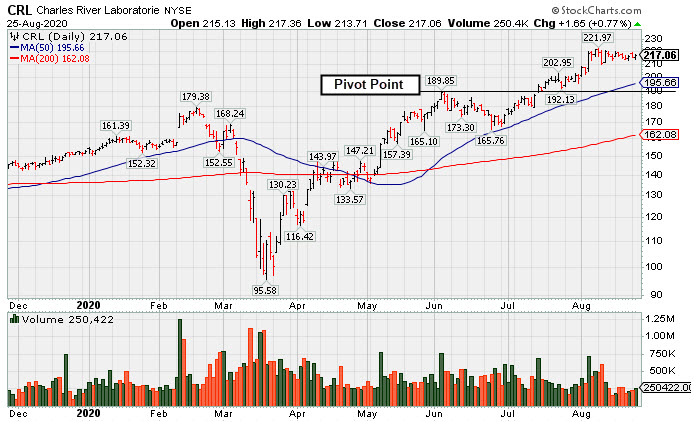
Volume Totals Cooling While Hovering in Tight Range Near Record High - Tuesday, August 25, 2020
Charles River Labs Intl's (CRL +$1.65 or +0.77% to $217.06) volume totals have been cooling while still hovering in a tight range near its all-time high. The 50-day moving average (DMA) line ($195.66) defines initial support to watch above the prior high ($189.85 on 6/03/20). Recently it reported Jun '20 quarterly earnings -3% on +4% sales revenues, below the +25% minimum guideline (C criteria), but better than expected while the company also raised its guidance. It now has a 92 Earnings Per Share Rating, down from 96 after the report.
CRL traded up as much as +15.2% since it was highlighted in yellow with pivot point cited based on its 6/03/20 high plus 10 cents in the 7/15/20 mid-day report (read here). It was last shown in this FSU section on 8/07/20 with an annotated graph under the headline, "Hit New Highs Again; EPS Rating Dropped Yet Remains High at 92".
The 2 prior quarterly earnings increases were above the +25% minimum guideline (C criteria) of the fact-based investment system. Annual earnings (A criteria) history has been strong and steady.
It hails from the Medical - Research Equipment/Services industry group which has an 87 Group Relative Strength Rating (L criteria). The number of top-rated funds owning its shares rose from 681 in Dec '19 to 747 in Jun '20, and its Up/Down Volume Ratio is 1.3, an unbiased indication its shares have been under accumulation over the past 50 days. There is a small number of only 49.7 million shares (S criteria) outstanding, which can contribute to greater price volatility in the event of institutional buying or selling.
Chart courtesy of www.stockcharts.com
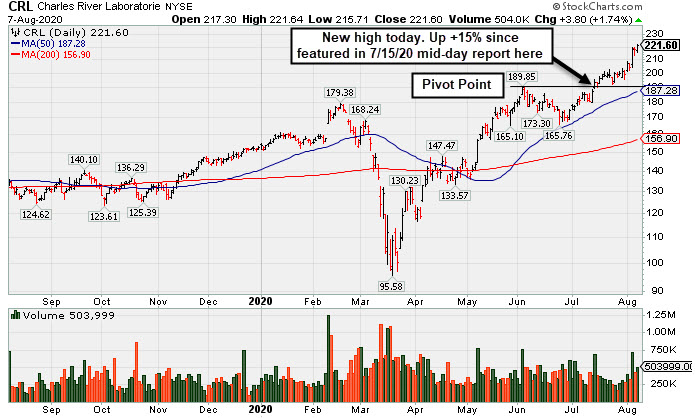
Hit New Highs Again; EPS Rating Dropped Yet Remains High at 92 - Friday, August 7, 2020
Charles River Labs Intl (CRL +$3.80 or +1.74% to $221.60) hit yet another new all-time high with today's gain backed by +25% above average volume. Bullish action came this week even after it reported Jun '20 quarterly earnings -3% on +4% sales revenues, below the +25% minimum guideline (C criteria), but better than expected while the company also raised its guidance. It now has a 92 Earnings Per Share Rating, down from 96 after the report.
The prior high ($189.85 on 6/03/20) defines initial support to watch above its 50-day moving average (DMA) line ($187.28). CRL is up +15% since it was highlighted in yellow with pivot point cited based on its 6/03/20 high plus 10 cents in the 7/115/20 mid-day report (read here). It was last shown in this FSU section that evening with an annotated graph under the headline, "Volume +71% Above Average Behind Breakout".
The 2 prior quarterly earnings increases were above the +25% minimum guideline (C criteria) of the fact-based investment system. Annual earnings (A criteria) history has been strong and steady.
It hails from the DRUGS - Biotechnology industry group which has an 91 Group Relative Strength Rating (L criteria). The number of top-rated funds owning its shares rose from 681 in Dec '19 to 734 in Jun '20, and its Up/Down Volume Ratio is 1.8, an unbiased indication its shares have been under accumulation over the past 50 days. There is a small number of only 49.5 million shares (S criteria) outstanding, which can contribute to greater price volatility in the event of institutional buying or selling.
Chart courtesy of www.stockcharts.com
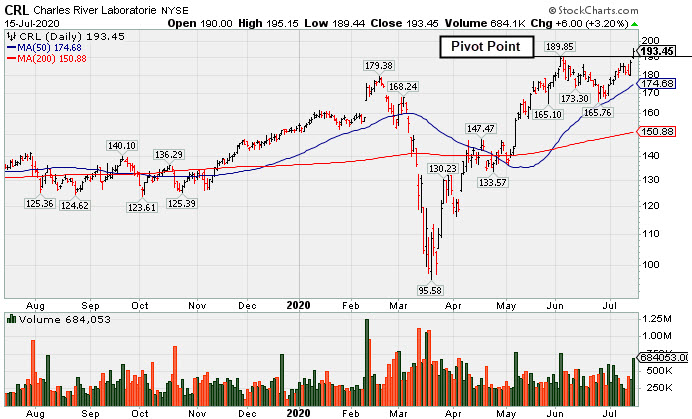
Volume +71% Above Average Behind Breakout - Wednesday, July 15, 2020
Charles River Labs Intl (CRL +$6.00 or +3.20% to $193.45) finished strong after highlighted in yellow with pivot point cited based on its 6/03/20 high plus 10 cents in the earlier mid-day report (read here). It hit a new all-time high with a big gain and strong close above the pivot point backed by +71% above average volume triggering a proper technical buy signal.
It reported earnings +31% on +17% sales revenues for the Mar '20 quarter, its 2nd quarterly earnings increase above the +25% minimum guideline (C criteria) of the fact-based investment system. It has a 96 Earnings Per Share Rating. Sequential quarterly comparisons show encouraging sales revenues and earnings acceleration. Annual earnings (A criteria) history has been strong and steady.
It reported earnings +31% on +17% sales revenues for the Mar '20 quarter, its 2nd quarterly earnings increase above the +25% minimum guideline (C criteria) of the fact-based investment system. It has a 96 Earnings Per Share Rating. Sequential quarterly comparisons show encouraging sales revenues and earnings acceleration. Annual earnings (A criteria) history has been strong and steady.
It hails from the DRUGS - Biotechnology industry group which has an 87 Group Relative Strength Rating (L criteria). The number of top-rated funds owning its shares rose from 681 in Dec '19 to 712 in Jun '20, and its Up/Down Volume Ratio is 1.6, an unbiased indication its shares have been under accumulation over the past 50 days. There is a small number of only 49.5 million shares (S criteria) outstanding, which can contribute to greater price volatility in the event of institutional buying or selling.
Chart courtesy of www.stockcharts.com