You are not logged in.
This means you
CAN ONLY VIEW reports that were published prior to Friday, March 21, 2025.
You
MUST UPGRADE YOUR MEMBERSHIP if you want to see any current reports.
AFTER MARKET UPDATE - TUESDAY, AUGUST 25TH, 2020
Previous After Market Report Next After Market Report >>>
|
|
|
|
DOW |
-60.02 |
28,248.44 |
-0.21% |
|
Volume |
713,322,323 |
-8% |
|
Volume |
3,453,415,900 |
-11% |
|
NASDAQ |
+86.75 |
11,466.47 |
+0.76% |
|
Advancers |
1,436 |
48% |
|
Advancers |
1,953 |
60% |
|
S&P 500 |
+12.34 |
3,443.62 |
+0.36% |
|
Decliners |
1,524 |
51% |
|
Decliners |
1,323 |
40% |
|
Russell 2000 |
+2.74 |
1,571.21 |
+0.17% |
|
52 Wk Highs |
80 |
|
|
52 Wk Highs |
115 |
|
|
S&P 600 |
+0.62 |
910.35 |
+0.07% |
|
52 Wk Lows |
11 |
|
|
52 Wk Lows |
19 |
|
|
 |
Leadership Waned as Major Indices Ended Mixed
Kenneth J. Gruneisen - Passed the CAN SLIM® Master's Exam
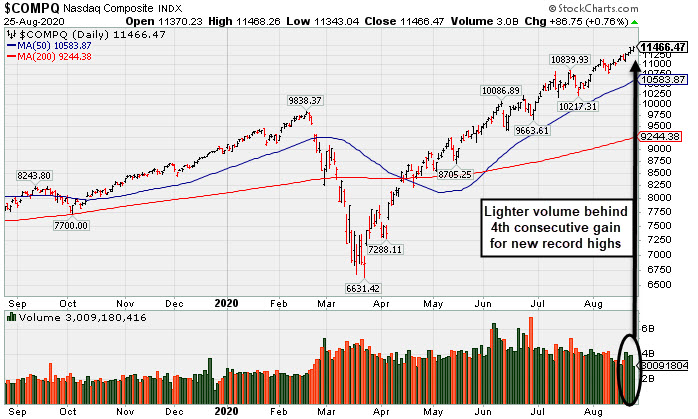
The S&P 500 gained 0.4% to a third consecutive all-time high, while the Dow fell 60 points, declining for the first time in four days. The Nasdaq Composite rallied 0.8%, rising to another record level. The reported volume totals were lighter than the prior session totals on the NYSE and on the Nasdaq exchange. Breadth was mixed as decliners led advancers by narrow margin on the NYSE while advancers led decliners by a 3-2 margin on the Nasdaq exchange. There were 43 high-ranked companies from the Leaders List that hit new 52-week highs and were listed on the BreakOuts Page, versus the total of 61 on the prior session. New 52-week highs totals contracted yet still outnumbered new 52-week lows totals on both the NYSE and Nasdaq exchange. The major indices are in a confirmed uptrend (M criteria). Any sustainable rally requires a healthy crop of new leaders, so it remains ever-important to see substantial new highs totals.
Charts used courtesy of www.stockcharts.com
PICTURED: The Nasdaq Composite Index had lighter volume behind its 4th consecutive gain for a new record high.
Stocks finished mixed on Tuesday as investors weighed disappointing data against encouraging geopolitical news. Overnight, top U.S.-China trade officials formally reviewed and reaffirmed their pledge to the "phase one" trade pact signed earlier this year.
On the data front, the Conference Board’s gauge of consumer confidence posted a surprise drop in August, tumbling to its lowest point since 2014. Separately, new home sales jumped 13.9% in July to the highest level since December 2006. Treasuries weakened, with the yield on the 10-year note up three basis points to 0.68%. In commodities, WTI crude climbed 1.8% to $43.37/barrel as storms in the Gulf Coast region disrupt supply.
Also in focus was news the Dow Jones Industrial Average would implement some changes, in light of Apple’s (AAPL -0.82%) upcoming 4-for-1 stock split. Shares of Salesforce.com (CRM +3.64%) , Amgen (AMGN +5.37%), and Honeywell (HON +3.24%) rose more than 3% following news the companies will replace Exxon Mobil (XOM -3.17), Pfizer (PFE -1.11%), and Raytheon Technologies (RTX -1.50%) in the 30-stock index starting August 31.
Six of 11 S&P 500 sectors finished in positive territory, with the Communications Services group pacing the gains. In earnings, Best Buy (BBY -4.03%) fell despite better-than-expected quarterly figures, as the electronics retailer warned that the current rate of revenue growth was unlikely to persist. Elsewhere, J.M. Smucker (SJM +6.87%) rose following a top and bottom line beat and an increase to its full-year outlook.
|
 Kenneth J. Gruneisen started out as a licensed stockbroker in August 1987, a couple of months prior to the historic stock market crash that took the Dow Jones Industrial Average down -22.6% in a single day. He has published daily fact-based fundamental and technical analysis on high-ranked stocks online for two decades. Through FACTBASEDINVESTING.COM, Kenneth provides educational articles, news, market commentary, and other information regarding proven investment systems that work in good times and bad.
Comments contained in the body of this report are technical opinions only and are not necessarily those of Gruneisen Growth Corp. The material herein has been obtained from sources believed to be reliable and accurate, however, its accuracy and completeness cannot be guaranteed. Our firm, employees, and customers may effect transactions, including transactions contrary to any recommendation herein, or have positions in the securities mentioned herein or options with respect thereto. Any recommendation contained in this report may not be suitable for all investors and it is not to be deemed an offer or solicitation on our part with respect to the purchase or sale of any securities. |
|
 |
Bank, Retail, Semiconductor, and Biotech Indexes Rose
Kenneth J. Gruneisen - Passed the CAN SLIM® Master's Exam
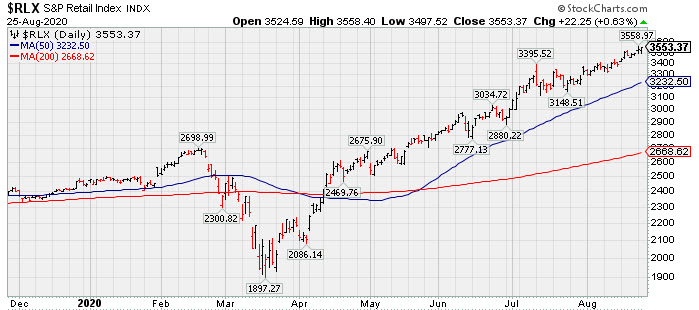
The Retail Index ($RLX +0.63%) and Bank Index ($BKX +0.57%) each posted a modest gain while the Broker/Dealer Index ($XBD -0.03%) finished flat. The tech sector had a mostly positive bias as the Semiconductor Index ($SOX +1.07%) and Biotech Index ($BTK +0.99%) rose, but the Networking Index ($NWX -0.43%) edged lower. Commodity-linked groups had a negative bias as the Oil Services Index ($OSX -1.53%) and Integrated Oil Index ($XOI -0.72%) both lost ground and the Gold & Silver Index ($XAU -0.29%) also edged lower.
PICTURED: The Retail Index ($RLX +0.63%) stayed well above its 50-day moving average (DMA) line on recent pullbacks during its ongoing ascent into record high territory.
| Oil Services |
$OSX |
36.76 |
-0.57 |
-1.53% |
-53.05% |
| Integrated Oil |
$XOI |
740.13 |
-5.39 |
-0.72% |
-41.75% |
| Semiconductor |
$SOX |
2,243.06 |
+23.69 |
+1.07% |
+21.27% |
| Networking |
$NWX |
595.47 |
-2.60 |
-0.43% |
+2.07% |
| Broker/Dealer |
$XBD |
294.85 |
-0.09 |
-0.03% |
+1.54% |
| Retail |
$RLX |
3,553.37 |
+22.25 |
+0.63% |
+45.08% |
| Gold & Silver |
$XAU |
145.96 |
-0.42 |
-0.29% |
+36.51% |
| Bank |
$BKX |
77.35 |
+0.44 |
+0.57% |
-31.77% |
| Biotech |
$BTK |
5,387.07 |
+52.73 |
+0.99% |
+6.31% |
|
|
|
 |
Volume Totals Cooling While Hovering in Tight Range Near Record High
Kenneth J. Gruneisen - Passed the CAN SLIM® Master's Exam
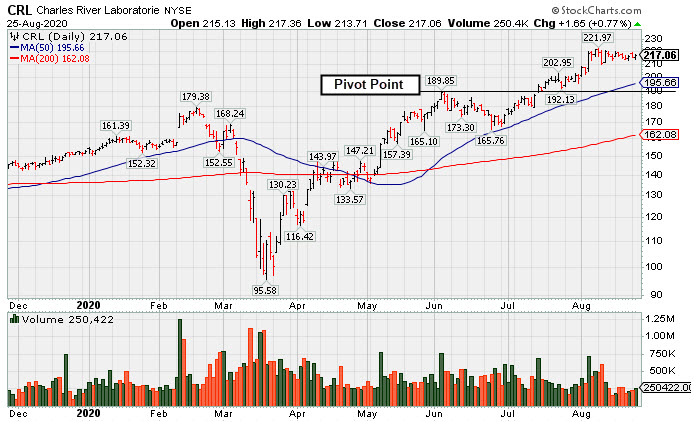
Charles River Labs Intl's (CRL +$1.65 or +0.77% to $217.06) volume totals have been cooling while still hovering in a tight range near its all-time high. The 50-day moving average (DMA) line ($195.66) defines initial support to watch above the prior high ($189.85 on 6/03/20). Recently it reported Jun '20 quarterly earnings -3% on +4% sales revenues, below the +25% minimum guideline (C criteria), but better than expected while the company also raised its guidance. It now has a 92 Earnings Per Share Rating, down from 96 after the report.
CRL traded up as much as +15.2% since it was highlighted in yellow with pivot point cited based on its 6/03/20 high plus 10 cents in the 7/15/20 mid-day report (read here). It was last shown in this FSU section on 8/07/20 with an annotated graph under the headline, "Hit New Highs Again; EPS Rating Dropped Yet Remains High at 92".
The 2 prior quarterly earnings increases were above the +25% minimum guideline (C criteria) of the fact-based investment system. Annual earnings (A criteria) history has been strong and steady.
It hails from the Medical - Research Equipment/Services industry group which has an 87 Group Relative Strength Rating (L criteria). The number of top-rated funds owning its shares rose from 681 in Dec '19 to 747 in Jun '20, and its Up/Down Volume Ratio is 1.3, an unbiased indication its shares have been under accumulation over the past 50 days. There is a small number of only 49.7 million shares (S criteria) outstanding, which can contribute to greater price volatility in the event of institutional buying or selling.
|
|
|
Color Codes Explained :
Y - Better candidates highlighted by our
staff of experts.
G - Previously featured
in past reports as yellow but may no longer be buyable under the
guidelines.
***Last / Change / Volume data in this table is the closing quote data***
Symbol/Exchange
Company Name
Industry Group |
PRICE |
CHANGE
(%Change) |
Day High |
Volume
(% DAV)
(% 50 day avg vol) |
52 Wk Hi
% From Hi |
Featured
Date |
Price
Featured |
Pivot Featured |
|
Max Buy |
 CRL
-
NYSE
CRL
-
NYSE
Charles River Labs Intl
DRUGS - Biotechnology
|
$217.06
|
+1.65
0.77% |
$217.36
|
250,422
70.15% of 50 DAV
50 DAV is 357,000
|
$221.97
-2.21%
|
7/15/2020
|
$192.66
|
PP = $189.95
|
|
MB = $199.45
|
 Most Recent Note - 8/25/2020 6:20:19 PM
G - Volume totals have been cooling while still hovering near its all-time high. The 50 DMA line ($195.66) defines initial support to watch above the prior high ($189.85 on 6/03/20). Recently reported Jun '20 quarterly earnings -3% on +4% sales revenues, below the +25% minimum guideline (C criteria), but better than expected while the company also raised its guidance. See the latest FSU analysis for more details and a new annotated graph.
>>> FEATURED STOCK ARTICLE : Volume Totals Cooling While Hovering in Tight Range Near Record High - 8/25/2020 |
View all notes |
Set NEW NOTE alert |
Company Profile |
SEC
News |
Chart |
Request a new note
C
A
S
I |
EBS
-
NYSE
Emergent Biosolutions
DRUGS - Biotechnology
|
$123.59
|
-1.96
-1.56% |
$126.00
|
579,641
59.15% of 50 DAV
50 DAV is 980,000
|
$137.61
-10.19%
|
7/7/2020
|
$89.47
|
PP = $93.68
|
|
MB = $98.36
|
Most Recent Note - 8/21/2020 5:32:31 PM
G - Volume totals have been cooling while it remains perched near its all-time high, very extended from any sound base. Bullish action came after it reported Jun '20 quarterly earnings +890% on +62% sales revenue for the Jun '20 quarter versus the year ago period. Its 50 DMA line ($99.18) defines support to watch above prior highs in the $93 area. See the latest FSU analysis for more details and a new annotated graph.
>>> FEATURED STOCK ARTICLE : High Ranked Biomed Leader is Extended From Prior Base - 8/21/2020 |
View all notes |
Set NEW NOTE alert |
Company Profile |
SEC
News |
Chart |
Request a new note
C
A
S
I |
AMD
-
NASDAQ
Advanced Micro Devices
ELECTRONICS - Semiconductor - Broad Line
|
$86.35
|
+3.27
3.94% |
$86.62
|
49,113,045
78.82% of 50 DAV
50 DAV is 62,310,000
|
$87.29
-1.08%
|
7/22/2020
|
$61.73
|
PP = $59.10
|
|
MB = $62.06
|
Most Recent Note - 8/25/2020 6:31:21 PM
G - Posted a solid gain today with light volume for its 2nd best ever close. Volume totals have been cooling while stubbornly holding its ground perched near its all-time high, very extended from the previously noted base. The recent low ($76.10 on 8/11/20) defines near-term support above its 50 DMA line ($66.28). Fundamentals remain strong.
>>> FEATURED STOCK ARTICLE : AMD Rose +46% Since First Featured on June 9th - 8/14/2020 |
View all notes |
Set NEW NOTE alert |
Company Profile |
SEC
News |
Chart |
Request a new note
C
A
S
I |
TREX
-
NYSE
Trex Company Inc
MATERIALS and CONSTRUCTION - General Building Materials
|
$147.21
|
-3.70
-2.45% |
$151.22
|
585,411
72.09% of 50 DAV
50 DAV is 812,000
|
$153.16
-3.88%
|
6/26/2020
|
$109.05
|
PP = $132.94
|
|
MB = $139.59
|
Most Recent Note - 8/25/2020 6:44:45 PM
G - Pulled back from its all-time high with today's loss backed by higher (but still below average) volume. It is extended from any sound base. Reported Jun '20 quarterly earnings +27% on +7% sales revenues versus the year ago period. Important near-term support is at its 50 DMA line ($133.80).
>>> FEATURED STOCK ARTICLE : Wedging Into New High Territory After Latest Earnings Report - 8/19/2020 |
View all notes |
Set NEW NOTE alert |
Company Profile |
SEC
News |
Chart |
Request a new note
C
A
S
I |
NFLX
-
NASDAQ
Netflix Inc
SPECIALTY RETAIL - Music and Video Stores
|
$490.58
|
+1.77
0.36% |
$492.47
|
5,720,435
77.79% of 50 DAV
50 DAV is 7,354,000
|
$575.37
-14.74%
|
5/14/2020
|
$441.95
|
PP = $449.62
|
|
MB = $472.10
|
Most Recent Note - 8/20/2020 5:30:30 PM
G - Posted a solid gain today with light volume. Found prompt support last week after briefly undercutting its 50 DMA line ($482). Volume behind recent gains has been very light. Fundamentals remain strong. See the latest FSU analysis for more details and an annotated graph.
>>> FEATURED STOCK ARTICLE : 50-Day Moving Average Acted As Support Level - 8/18/2020 |
View all notes |
Set NEW NOTE alert |
Company Profile |
SEC
News |
Chart |
Request a new note
C
A
S
I |
Symbol/Exchange
Company Name
Industry Group |
PRICE |
CHANGE
(%Change) |
Day High |
Volume
(% DAV)
(% 50 day avg vol) |
52 Wk Hi
% From Hi |
Featured
Date |
Price
Featured |
Pivot Featured |
|
Max Buy |
CHGG
-
NYSE
Chegg Inc
Consumer Svcs-Education
|
$75.48
|
+2.02
2.75% |
$75.78
|
3,173,541
83.93% of 50 DAV
50 DAV is 3,781,000
|
$89.82
-15.97%
|
6/17/2020
|
$63.71
|
PP = $68.08
|
|
MB = $71.48
|
Most Recent Note - 8/25/2020 6:42:49 PM
G - Suffered a big loss on the prior session with volume +42% above average, testing support near its 50 DMA line ($73.81). Its 50 DMA line defines important support to watch above its prior high in the $68 area. More damaging losses leading to violations would raise concerns and trigger technical sell signals. Reported Jun '20 quarterly earnings +61% on +63% sales revenues versus the year ago period. See the latest FSU analysis for more details and an annotated graph.
>>> FEATURED STOCK ARTICLE : Volume-Driven Loss Tests Support at 50-Day Moving Average - 8/24/2020 |
View all notes |
Set NEW NOTE alert |
Company Profile |
SEC
News |
Chart |
Request a new note
C
A
S
I |
LGIH
-
NASDAQ
L G I Homes Inc
Bldg-Resident/Comml
|
$117.53
|
-1.47
-1.24% |
$120.00
|
204,238
63.04% of 50 DAV
50 DAV is 324,000
|
$123.94
-5.17%
|
7/7/2020
|
$99.19
|
PP = $95.82
|
|
MB = $100.61
|
Most Recent Note - 8/20/2020 5:28:17 PM
G - Recently rebounding toward its 52-week high, showing resilience after its latest earnings report. It is extended from the previously noted base. Its 50 DMA line ($102.88) defines near-term support to watch above prior highs in the $95 area. Reported Jun '20 quarterly earnings +21% on +4% sales revenues, breaking a streak of 4 comparisons above the +25% minimum guideline (C criteria). See the latest FSU analysis for more details and a new annotated graph.
>>> FEATURED STOCK ARTICLE : Leadership in Building - Residential/Commercial Group Improving - 8/20/2020 |
View all notes |
Set NEW NOTE alert |
Company Profile |
SEC
News |
Chart |
Request a new note
C
A
S
I |
NOW
-
NYSE
Servicenow Inc
Computer Sftwr-Enterprse
|
$457.93
|
+9.83
2.19% |
$458.88
|
1,163,280
67.20% of 50 DAV
50 DAV is 1,731,000
|
$458.64
-0.15%
|
8/20/2020
|
$453.34
|
PP = $454.79
|
|
MB = $477.53
|
Most Recent Note - 8/20/2020 5:35:07 PM
Y - Hit a new high and managed a best-ever close with today's gain backed by +41% above average volume. Color code is changed to yellow with new pivot point cited based on its 7/20/20 high plus 10 cents. Confirming gains above the pivot point backed by at least +40% above average volume may trigger a proper new (or add-on) technical buy signal. Its 50 DMA line ($420) defines important near-term support to watch. Subsequent losses leading to a violation may trigger a technical sell signal. Reported Jun '20 quarterly earnings +73% on +28% sales revenues versus the year ago period.
>>> FEATURED STOCK ARTICLE : Consolidating Above 50-Day Average After Another Strong Quarter - 8/13/2020 |
View all notes |
Set NEW NOTE alert |
Company Profile |
SEC
News |
Chart |
Request a new note
C
A
S
I |
TTD
-
NASDAQ
The Trade Desk Inc Cl A
Comml Svcs-Advertising
|
$469.90
|
+3.24
0.69% |
$470.78
|
597,849
42.64% of 50 DAV
50 DAV is 1,402,000
|
$510.00
-7.86%
|
6/3/2020
|
$340.61
|
PP = $327.35
|
|
MB = $343.72
|
Most Recent Note - 8/21/2020 5:38:43 PM
G - Volume totals have been very quiet while still holding its ground perched near its all-time high. Recently reported Jun '20 quarterly earnings -3% on -13% sales revenues versus the year ago period, raising fundamental concerns. It is extended from any sound base of sufficient length. Its 50 DMA line ($437) defines near-term support above the prior low ($404 on 7/24/20) where violations may trigger technical sell signals.
>>> FEATURED STOCK ARTICLE : Hovering Near High After Latest Quarterly Report Raised Concerns - 8/12/2020 |
View all notes |
Set NEW NOTE alert |
Company Profile |
SEC
News |
Chart |
Request a new note
C
A
S
I |
DOCU
-
NASDAQ
Docusign Inc
Computer Sftwr-Enterprse
|
$205.09
|
+0.60
0.29% |
$205.50
|
2,311,284
46.77% of 50 DAV
50 DAV is 4,942,000
|
$229.83
-10.76%
|
6/10/2020
|
$149.73
|
PP = $152.10
|
|
MB = $159.71
|
Most Recent Note - 8/24/2020 4:53:59 PM
G - Volume totals have been cooling while consolidating above its 50 DMA line ($194) and prior low ($189.12 on 8/12/20) which define important near-term support to watch. It is extended from any sound base.
>>> FEATURED STOCK ARTICLE : Consolidating Above 50-Day Moving Average Line and Recent Low - 8/17/2020 |
View all notes |
Set NEW NOTE alert |
Company Profile |
SEC
News |
Chart |
Request a new note
C
A
S
I |
Symbol/Exchange
Company Name
Industry Group |
PRICE |
CHANGE
(%Change) |
Day High |
Volume
(% DAV)
(% 50 day avg vol) |
52 Wk Hi
% From Hi |
Featured
Date |
Price
Featured |
Pivot Featured |
|
Max Buy |
PING
-
NYSE
Ping Identity Holdings Corp
Computer Sftwr-Security
|
$33.48
|
-0.06
-0.18% |
$34.06
|
666,593
50.58% of 50 DAV
50 DAV is 1,317,800
|
$37.80
-11.43%
|
6/1/2020
|
$29.24
|
PP = $29.90
|
|
MB = $31.40
|
Most Recent Note - 8/21/2020 5:29:46 PM
G - Pulled back today with lighter volume. Rebound above its 50 DMA line ($33.03) on the prior session helped its technical stance improve. Recently reported Jun '20 quarterly earnings -27% on -6% sales revenues versus the year ago period, below the +25% minimum earnings guideline, raising fundamental concerns. The next important near-term support below the 50 DMA line is the prior highs in the $29 area. It has not formed a sound base of sufficient length. Completed Secondary Offerings on 7/09/20 and 5/15/20.
>>> FEATURED STOCK ARTICLE : Perched Near High With Earnings News Due Wednesday Evening - 8/10/2020 |
View all notes |
Set NEW NOTE alert |
Company Profile |
SEC
News |
Chart |
Request a new note
C
A
S
I |
|
|
|
THESE ARE NOT BUY RECOMMENDATIONS!
Comments contained in the body of this report are technical
opinions only. The material herein has been obtained
from sources believed to be reliable and accurate, however,
its accuracy and completeness cannot be guaranteed.
This site is not an investment advisor, hence it does
not endorse or recommend any securities or other investments.
Any recommendation contained in this report may not
be suitable for all investors and it is not to be deemed
an offer or solicitation on our part with respect to
the purchase or sale of any securities. All trademarks,
service marks and trade names appearing in this report
are the property of their respective owners, and are
likewise used for identification purposes only.
This report is a service available
only to active Paid Premium Members.
You may opt-out of receiving report notifications
at any time. Questions or comments may be submitted
by writing to Premium Membership Services 665 S.E. 10 Street, Suite 201 Deerfield Beach, FL 33441-5634 or by calling 1-800-965-8307
or 954-785-1121.
|
|
|