***Last / Change / Volume data in this table is the closing quote data***
Symbol/Exchange
Company Name
Industry Group |
PRICE |
CHANGE
(%Change) |
Day High |
Volume
(% DAV)
(% 50 day avg vol) |
52 Wk Hi
% From Hi |
Featured
Date |
Price
Featured |
Pivot Featured |
|
Max Buy |
 SPSC
-
NASDAQ
SPSC
-
NASDAQ
S P S Commerce Inc
COMPUTER SOFTWARE and SERVICES - Application Software
|
$103.70
|
+0.83
0.81% |
$104.89
|
71,449
51.77% of 50 DAV
50 DAV is 138,000
|
$115.00
-9.83%
|
6/7/2019
|
$107.72
|
PP = $115.10
|
|
MB = $120.86
|
Most Recent Note - 7/15/2019 4:53:59 PM
G - Meeting resistance while a rebound above its 50 DMA line ($104.11) would help its outlook. Subsequent volume-driven gains above the pivot point are needed to trigger a new (or add-on) technical buy signal. Faces some resistance due to overhead supply up to the $115 level. Fundamentals remain strong.
>>> FEATURED STOCK ARTICLE : Recently Sputtering Below 50-Day Moving Average - 7/9/2019 |
View all notes |
Set NEW NOTE alert |
Company Profile |
SEC
News |
Chart |
Request a new note
C
A
S
I |
EPAM
-
NYSE
Epam Systems Inc
COMPUTER SOFTWARE and SERVICES - Information Technology Service
|
$198.51
|
+2.61
1.33% |
$198.69
|
282,508
53.51% of 50 DAV
50 DAV is 528,000
|
$196.98
0.78%
|
5/9/2019
|
$169.25
|
PP = $180.55
|
|
MB = $189.58
|
Most Recent Note - 7/12/2019 5:40:35 PM
G - Extended from prior base and it hit another new 52-week high with today's 12th consecutive gain. Prior highs in the $179-180 area define initial support to watch above its 50 DMA line ($173.89). See the latest FSU analysis for more details and a new annotated graph.
>>> FEATURED STOCK ARTICLE : Winning Streak Leaves IT Firm Extended From Prior Base - 7/12/2019 |
View all notes |
Set NEW NOTE alert |
Company Profile |
SEC
News |
Chart |
Request a new note
C
A
S
I |
AUDC
-
NASDAQ
Audiocodes Ltd
ELECTRONICS - Scientific and Technical Instrum
|
$16.21
|
-0.20
-1.22% |
$16.39
|
174,389
132.11% of 50 DAV
50 DAV is 132,000
|
$17.44
-7.05%
|
7/15/2019
|
$17.10
|
PP = $17.54
|
|
MB = $18.42
|
Most Recent Note - 7/16/2019 5:38:56 PM
Y - Pulled back today for a considerable loss. It was highlighted in yellow with new pivot point cited based on its 4/24/19 high plus 10 cents in the 7/15/19 mid-day report. Faces little resistance due to overhead supply. Recently consolidating above the 50 DMA line. It wedged higher with gains lacking great volume conviction since dropped from the Featured Stocks list on 5/13/19. Earnings rose +38% on +10% sales revenues for the Mar '19 quarter, still above the +25% minimum earnings guideline (C criteria). Subsequent gains above the pivot point backed by at least +40% above average volume are needed to trigger a proper technical buy signal. See the latest FSU analysis for more details and an annotated graph.
>>> FEATURED STOCK ARTICLE : Posted a Gain With Average Volume for Best Ever Close - 7/15/2019 |
View all notes |
Set NEW NOTE alert |
Company Profile |
SEC
News |
Chart |
Request a new note
C
A
S
I |
ENV
-
NYSE
Envestnet Inc
FINANCIAL SERVICES - Diversified Investments
|
$71.77
|
-0.17
-0.24% |
$72.57
|
183,603
66.52% of 50 DAV
50 DAV is 276,000
|
$73.23
-1.99%
|
3/15/2019
|
$66.05
|
PP = $64.90
|
|
MB = $68.15
|
Most Recent Note - 7/12/2019 5:38:05 PM
G - Hit a new 52-week high with today's 3rd consecutive gain. Prior lows in the $65-66 area define the next important near-term support to watch. Recently reported earnings +5% on +1% sales revenues for the Mar '19 quarter, below the +25% minimum earnings guideline (C criteria).
>>> FEATURED STOCK ARTICLE : Rebounded Above 50-Day Moving Average Line - 7/2/2019 |
View all notes |
Set NEW NOTE alert |
Company Profile |
SEC
News |
Chart |
Request a new note
C
A
S
I |
LHCG
-
NASDAQ
L H C Group Inc
HEALTH SERVICES - Home Health Care
|
$121.52
|
+0.71
0.59% |
$122.57
|
249,567
112.42% of 50 DAV
50 DAV is 222,000
|
$128.31
-5.29%
|
7/1/2019
|
$110.94
|
PP = $122.20
|
|
MB = $128.31
|
Most Recent Note - 7/15/2019 12:57:06 PM
Y - Reversed into the red following early gains today for a new all-time high after wedging higher last week with gains lacking great volume conviction. Subsequent gains above its pivot point backed by at least +40% above average volume may trigger a new (or add-on) technical buy signal. Its 50 DMA line ($117) defines near-term support above recent lows. Fundamentals remain strong.
>>> FEATURED STOCK ARTICLE : Prior Gains Lacked Volume; 50-Day Moving Average Defines Support - 6/17/2019 |
View all notes |
Set NEW NOTE alert |
Company Profile |
SEC
News |
Chart |
Request a new note
C
A
S
I |
Symbol/Exchange
Company Name
Industry Group |
PRICE |
CHANGE
(%Change) |
Day High |
Volume
(% DAV)
(% 50 day avg vol) |
52 Wk Hi
% From Hi |
Featured
Date |
Price
Featured |
Pivot Featured |
|
Max Buy |
ENSG
-
NASDAQ
Ensign Group Inc
HEALTH SERVICES - Long-Term Care Facilities
|
$57.65
|
+0.29
0.51% |
$57.92
|
191,780
65.01% of 50 DAV
50 DAV is 295,000
|
$58.88
-2.09%
|
4/30/2019
|
$51.46
|
PP = $53.30
|
|
MB = $55.97
|
Most Recent Note - 7/12/2019 12:16:52 PM
G - Volume totals have been cooling while stubbornly holding its ground near its all-time high. Its 50 DMA line ($55.33) and recent low ($52.34 on 5/31/19) define near-term support to watch. Bullish action has continued since 5/06/19 reporting earnings +22% on +12% sales revenues for the Mar '19 quarter, below the +25% minimum earnings guideline (C criteria).
>>> FEATURED STOCK ARTICLE : Nursing Facility Operator Touched New High - 7/1/2019 |
View all notes |
Set NEW NOTE alert |
Company Profile |
SEC
News |
Chart |
Request a new note
C
A
S
I |
CHDN
-
NASDAQ
Churchill Downs Inc
LEISURE - Gaming Activities
|
$117.17
|
-0.85
-0.72% |
$118.00
|
168,592
62.91% of 50 DAV
50 DAV is 268,000
|
$118.89
-1.45%
|
6/5/2019
|
$108.87
|
PP = $104.96
|
|
MB = $110.21
|
Most Recent Note - 7/16/2019 5:37:33 PM
G - Volume totals have been cooling while consolidating near its all-time high, extended from any sound base. Its prior low ($108.57 on 6/25/19) and 50 DMA line ($107.22) define important near-term support to watch on pullbacks. See the latest FSU analysis for more details and a new annotated graph.
>>> FEATURED STOCK ARTICLE : Volume Light While Hovering at Record High - 7/16/2019 |
View all notes |
Set NEW NOTE alert |
Company Profile |
SEC
News |
Chart |
Request a new note
C
A
S
I |
WWD
-
NASDAQ
Woodward Inc
MANUFACTURING - Diversified Machinery
|
$115.64
|
-1.14
-0.98% |
$118.13
|
470,072
91.45% of 50 DAV
50 DAV is 514,000
|
$117.73
-1.78%
|
6/18/2019
|
$112.34
|
PP = $114.65
|
|
MB = $120.38
|
 Most Recent Note - 7/17/2019 5:37:45 PM
Y - There was a "negative reversal" today after touching a new all-time high. Found support above its 50 DMA line. Subsequent gains for new highs backed by at least +40% above average volume may clinch a convincing technical buy signal. Fundamentals remain strong.
>>> FEATURED STOCK ARTICLE : High Ranked Industrial Firm Perched Near All-Time High - 6/18/2019 |
View all notes |
Set NEW NOTE alert |
Company Profile |
SEC
News |
Chart |
Request a new note
C
A
S
I |
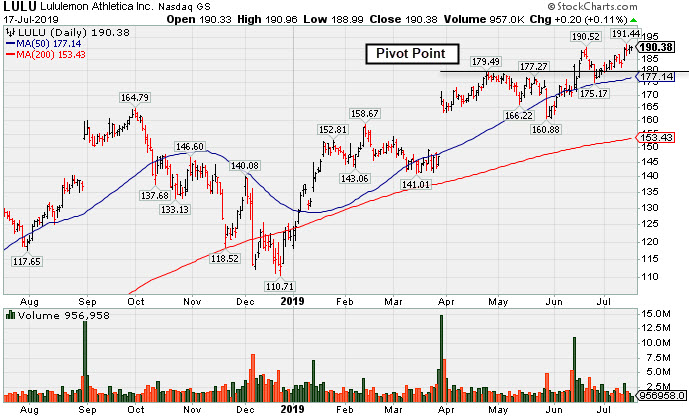
LULU
-
NASDAQ
Lululemon Athletica
MANUFACTURING - Textile Manufacturing
|
$190.38
|
+0.20
0.11% |
$190.96
|
957,161
43.67% of 50 DAV
50 DAV is 2,192,000
|
$191.44
-0.55%
|
6/13/2019
|
$174.48
|
PP = $179.60
|
|
MB = $188.58
|
Most Recent Note - 7/17/2019 5:31:35 PM
G - Volume totals have been cooling while hovering near its all-time high. Its 50 DMA line ($177.14) defines important near-term support. Reported Apr '19 quarterly earnings +35% on +20% sales revenues versus the ear ago period. See the latest FSU analysis for more details and a new annotated graph.
>>> FEATURED STOCK ARTICLE : Quietly Hovering at All-Time High - 7/17/2019 |
View all notes |
Set NEW NOTE alert |
Company Profile |
SEC
News |
Chart |
Request a new note
C
A
S
I |
ULTA
-
NASDAQ
Ulta Beauty Inc
SPECIALTY RETAIL - Specialty Retail, Other
|
$366.39
|
+5.85
1.62% |
$368.83
|
711,732
92.79% of 50 DAV
50 DAV is 767,000
|
$365.54
0.23%
|
3/15/2019
|
$341.27
|
PP = $322.59
|
|
MB = $338.72
|
Most Recent Note - 7/16/2019 12:45:04 PM
G - Perched within striking distance of its all-time high, its 50 DMA line ($344) defines near-term support to watch. Reported earnings +17% on +13% sales revenues for the Apr '19 quarter, below the +25% minimum earnings guideline (C criteria), raising fundamental concerns.
>>> FEATURED STOCK ARTICLE : Stalled After Recently Wedging to New Record High - 7/5/2019 |
View all notes |
Set NEW NOTE alert |
Company Profile |
SEC
News |
Chart |
Request a new note
C
A
S
I |
Symbol/Exchange
Company Name
Industry Group |
PRICE |
CHANGE
(%Change) |
Day High |
Volume
(% DAV)
(% 50 day avg vol) |
52 Wk Hi
% From Hi |
Featured
Date |
Price
Featured |
Pivot Featured |
|
Max Buy |
CHGG
-
NYSE
Chegg Inc
Consumer Svcs-Education
|
$43.79
|
-0.93
-2.08% |
$44.66
|
1,506,374
107.37% of 50 DAV
50 DAV is 1,403,000
|
$45.19
-3.10%
|
7/8/2019
|
$44.11
|
PP = $41.79
|
|
MB = $43.88
|
Most Recent Note - 7/17/2019 5:33:54 PM
G - Pulled back near its "max buy" level with today's 2nd loss backed by average volume. Prior highs in the $40-41 area define initial support to watch on pullbacks.
>>> FEATURED STOCK ARTICLE : Tallied a Big Volume-Driven Breakout Gain for a New High - 7/8/2019 |
View all notes |
Set NEW NOTE alert |
Company Profile |
SEC
News |
Chart |
Request a new note
C
A
S
I |
ESNT
-
NYSE
Essent Group Ltd
Finance-MrtgandRel Svc
|
$46.84
|
-1.13
-2.36% |
$47.90
|
713,506
115.64% of 50 DAV
50 DAV is 617,000
|
$50.51
-7.27%
|
3/18/2019
|
$45.84
|
PP = $45.06
|
|
MB = $47.31
|
Most Recent Note - 7/17/2019 5:42:08 PM
G - Fell below its 50 DMA line ($47.86) with slightly above average volume behind today's loss. Very little resistance remains due to overhead supply. Fundamental concerns remain since it reported earnings +15% on +20% sales revenues for the Mar '19 quarter, below the +25% minimum earnings guideline (C criteria).
>>> FEATURED STOCK ARTICLE : Rebounded Above 50 Day Moving Average After Violation - 7/3/2019 |
View all notes |
Set NEW NOTE alert |
Company Profile |
SEC
News |
Chart |
Request a new note
C
A
S
I |
NOW
-
NYSE
Servicenow Inc
Computer Sftwr-Enterprse
|
$296.56
|
+1.06
0.36% |
$300.16
|
864,559
55.74% of 50 DAV
50 DAV is 1,551,000
|
$303.17
-2.18%
|
4/22/2019
|
$242.64
|
PP = $251.75
|
|
MB = $264.34
|
Most Recent Note - 7/15/2019 4:46:09 PM
G - Volume totals have been cooling while stubbornly holding its ground perched near its all-time high, extended from an sound base. Its 50 DMA line ($276) defines near-term support to watch. Recently reported earnings +20% on +34% sales revenues for the Mar '19 quarter, below the +25% minimum earnings guideline (C criteria), raising fundamental concerns.
>>> FEATURED STOCK ARTICLE : Pulling Back After Wedging to New Highs - 6/26/2019 |
View all notes |
Set NEW NOTE alert |
Company Profile |
SEC
News |
Chart |
Request a new note
C
A
S
I |
VEEV
-
NYSE
Veeva Systems Inc Cl A
Computer Sftwr-Medical
|
$172.75
|
+1.71
1.00% |
$173.08
|
845,209
55.10% of 50 DAV
50 DAV is 1,534,000
|
$176.90
-2.35%
|
5/30/2019
|
$154.32
|
PP = $145.80
|
|
MB = $153.09
|
Most Recent Note - 7/15/2019 4:57:37 PM
G -Stubbornly holding its ground near its all-time high with volume totals cooling, very extended from any sound base. Its 50 DMA line ($156.12) defines near-term support above the prior low ($155 on 6/27/19). Reported earnings +52% on +25% sales revenues for the Apr '19 quarter, marking its 5th strong quarter with earnings above the +25% minimum guideline (C criteria).
>>> FEATURED STOCK ARTICLE : Halted Slide After 4 Volume-Driven Losses From High - 6/27/2019 |
View all notes |
Set NEW NOTE alert |
Company Profile |
SEC
News |
Chart |
Request a new note
C
A
S
I |
PAYC
-
NYSE
Paycom Software Inc
COMPUTER SOFTWARE and SERVICES - Application Software
|
$242.41
|
+2.44
1.02% |
$244.31
|
393,304
53.58% of 50 DAV
50 DAV is 734,000
|
$246.85
-1.80%
|
2/6/2019
|
$171.66
|
PP = $164.18
|
|
MB = $172.39
|
Most Recent Note - 7/15/2019 4:49:29 PM
G - Holding its ground with volume totals cooling while extended from any sound base. Wedged into new high territory with recent gains lacking great volume conviction. Its 50 DMA line ($218.49) defines near-term support to watch Reported earnings +25% on +30% sales revenues for the Mar '19 quarter.
>>> FEATURED STOCK ARTICLE : Perched Near High Extended From Any Sound Base - 6/28/2019 |
View all notes |
Set NEW NOTE alert |
Company Profile |
SEC
News |
Chart |
Request a new note
C
A
S
I |
Symbol/Exchange
Company Name
Industry Group |
PRICE |
CHANGE
(%Change) |
Day High |
Volume
(% DAV)
(% 50 day avg vol) |
52 Wk Hi
% From Hi |
Featured
Date |
Price
Featured |
Pivot Featured |
|
Max Buy |
PYPL
-
NASDAQ
Paypal Holdings Inc
Finance-CrdtCard/PmtPr
|
$118.81
|
-0.90
-0.75% |
$119.99
|
4,598,331
87.54% of 50 DAV
50 DAV is 5,253,000
|
$121.48
-2.20%
|
1/24/2019
|
$92.56
|
PP = $93.80
|
|
MB = $98.49
|
Most Recent Note - 7/15/2019 4:52:33 PM
G - It quietly touched another new all-time high today. Did not form a sound base, yet promptly rebounded after violating its 50 DMA line and prior low ($106.52) on 6/03/19. Recently reported earnings +37% on +12% sales revenues for the Mar '19 quarter, continuing its strong earnings track record.
>>> FEATURED STOCK ARTICLE : Popular Payments Firm Extended From Any Sound Base - 6/19/2019 |
View all notes |
Set NEW NOTE alert |
Company Profile |
SEC
News |
Chart |
Request a new note
C
A
S
I |
PLNT
-
NYSE
Planet Fitness Inc Cl A
Leisure-Services
|
$76.51
|
-1.03
-1.33% |
$77.75
|
926,205
58.29% of 50 DAV
50 DAV is 1,589,000
|
$81.90
-6.58%
|
11/7/2018
|
$57.10
|
PP = $55.45
|
|
MB = $58.22
|
Most Recent Note - 7/15/2019 4:51:28 PM
G - Quietly consolidating near its 50 DMA line ($76.69). Faces near-term resistance up to the $81 level after encountering distributional pressure in recent weeks. Fundamentals remain strong.
>>> FEATURED STOCK ARTICLE : Undercut 50-Day Moving Average With Volume Behind Losses - 6/21/2019 |
View all notes |
Set NEW NOTE alert |
Company Profile |
SEC
News |
Chart |
Request a new note
C
A
S
I |
BLD
-
NYSE
Topbuild Corp
Bldg-Constr Prds/Misc
|
$80.75
|
-2.08
-2.51% |
$83.34
|
204,420
62.51% of 50 DAV
50 DAV is 327,000
|
$86.96
-7.14%
|
5/17/2019
|
$82.19
|
PP = $87.31
|
|
MB = $91.68
|
Most Recent Note - 7/17/2019 5:40:59 PM
Y - Testing support defined by its 50 DMA line ($80.97) with the next support at the recent low ($75.89 on 6/19/19). Sputtering after challenging its all-time high on 7/12/19 with its early gain. Subsequent gains above the pivot point backed by at least +40% above average volume may trigger a technical buy signal. Fundamentals remain strong.
>>> FEATURED STOCK ARTICLE : Found Support at 50-Day Moving Averge Line - 6/20/2019 |
View all notes |
Set NEW NOTE alert |
Company Profile |
SEC
News |
Chart |
Request a new note
C
A
S
I |
TEAM
-
NASDAQ
Atlassian Corp Plc Cl A
Comp Sftwr-Spec Enterprs
|
$136.43
|
-0.73
-0.53% |
$140.30
|
1,180,509
82.96% of 50 DAV
50 DAV is 1,423,000
|
$143.68
-5.05%
|
5/24/2019
|
$129.52
|
PP = $132.09
|
|
MB = $138.69
|
Most Recent Note - 7/15/2019 4:55:19 PM
G - Perched slightly above its "max buy" level and near its all-time high. The 50 DMA line ($128.51) and prior low ($123.43 on 6/25/19) define important near-term support to watch. Reported earnings +133% on +38% sales revenues for the Mar '19 quarter, continuing its strong earnings track record.
>>> FEATURED STOCK ARTICLE : Perched at High After Wedging into New High Territory - 6/24/2019 |
View all notes |
Set NEW NOTE alert |
Company Profile |
SEC
News |
Chart |
Request a new note
C
A
S
I |
UPLD
-
NASDAQ
Upland Software Inc
Computer Sftwr-Enterprse
|
$46.77
|
-0.29
-0.62% |
$47.33
|
232,816
40.49% of 50 DAV
50 DAV is 575,000
|
$54.87
-14.76%
|
6/10/2019
|
$53.30
|
PP = $50.74
|
|
MB = $53.28
|
Most Recent Note - 7/12/2019 5:42:15 PM
G - Slumped for a 3rd consecutive loss today with light volume and its 50 DMA line ($47.27) has been acting as resistance. A rebound above the 50 DMA line is needed for its outlook to improve. Completed a new Public Offering on 5/08/19. Quarterly comparisons through Mar '19 have shown impressive sales revenues growth and greatly improved earnings increases above the +25% minimum guideline (C criteria).
>>> FEATURED STOCK ARTICLE : Consolidating Near 50-Day Average After Slump Into Prior Base - 7/10/2019 |
View all notes |
Set NEW NOTE alert |
Company Profile |
SEC
News |
Chart |
Request a new note
C
A
S
I |
Symbol/Exchange
Company Name
Industry Group |
PRICE |
CHANGE
(%Change) |
Day High |
Volume
(% DAV)
(% 50 day avg vol) |
52 Wk Hi
% From Hi |
Featured
Date |
Price
Featured |
Pivot Featured |
|
Max Buy |
GLOB
-
NYSE
Globant SA
Computer-Tech Services
|
$106.67
|
-0.29
-0.27% |
$109.17
|
275,084
62.66% of 50 DAV
50 DAV is 439,000
|
$109.78
-2.83%
|
2/15/2019
|
$69.35
|
PP = $70.00
|
|
MB = $73.50
|
Most Recent Note - 7/17/2019 5:36:02 PM
G - Pulled back for a 5h consecutive small loss on light volume, remaining perched near its all-time. Wedged higher with recent gains lacking great volume conviction, and it is very extended from any sound base. Its 50 DMA line ($95.61) defines important support to watch on pullbacks. Fundamentals remain strong.
>>> FEATURED STOCK ARTICLE : Extended From Any Sound Base After Wedging Higher - 7/11/2019 |
View all notes |
Set NEW NOTE alert |
Company Profile |
SEC
News |
Chart |
Request a new note
C
A
S
I |
PAGS
-
NYSE
Pagseguro Digital Cl A
Finance-CrdtCard/PmtPr
|
$45.68
|
+0.94
2.10% |
$47.09
|
2,675,723
123.42% of 50 DAV
50 DAV is 2,168,000
|
$45.66
0.04%
|
6/25/2019
|
$37.69
|
PP = $40.07
|
|
MB = $42.07
|
Most Recent Note - 7/17/2019 12:46:18 PM
G - Getting more extended from the prior base, hitting yet another new high with today's 10th gain in the span of 11 sessions. Prior high defines initial support to watch in the $40 area above its 50 DMA line ($35.26).
>>> FEATURED STOCK ARTICLE : Brazilian Payment Tech Firm Perched Near High - 6/25/2019 |
View all notes |
Set NEW NOTE alert |
Company Profile |
SEC
News |
Chart |
Request a new note
C
A
S
I |