You are not logged in.
This means you
CAN ONLY VIEW reports that were published prior to Tuesday, July 9, 2024.
You
MUST UPGRADE YOUR MEMBERSHIP if you want to see any current reports.
AFTER MARKET UPDATE - FRIDAY, MARCH 22ND, 2024
Previous After Market Report Next After Market Report >>>
|
|
|
|
DOW |
-305.47 |
39,475.90 |
-0.77% |
|
Volume |
841,950,344 |
-17% |
|
Volume |
4,360,899,500 |
-16% |
|
NASDAQ |
+26.98 |
16,428.82 |
+0.16% |
|
Advancers |
937 |
34% |
|
Advancers |
1,564 |
37% |
|
S&P 500 |
-7.35 |
5,234.18 |
-0.14% |
|
Decliners |
1,820 |
66% |
|
Decliners |
2,698 |
63% |
|
Russell 2000 |
-26.56 |
2,072.00 |
-1.27% |
|
52 Wk Highs |
220 |
|
|
52 Wk Highs |
131 |
|
|
S&P 600 |
-16.12 |
1,311.59 |
-1.21% |
|
52 Wk Lows |
20 |
|
|
52 Wk Lows |
97 |
|
|
 |
Major Indices Pulled Back With Lighter Volume Totals
Kenneth J. Gruneisen - Passed the CAN SLIM® Master's Exam
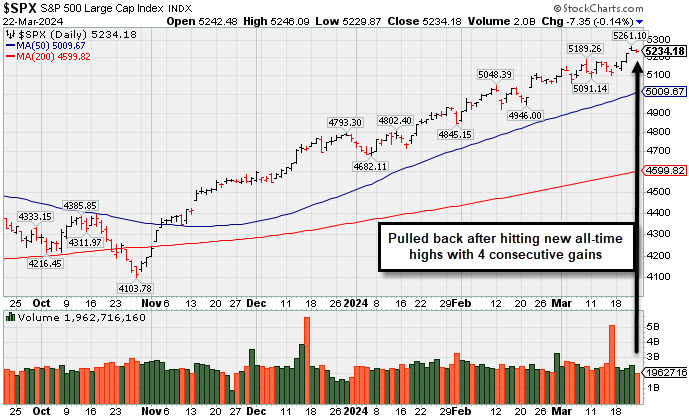
The Nasdaq Composite (+0.2%) finished at a fresh all-time high, meanwhile the S&P 500 (-0.1%) and Dow Jones Industrial Average (-0.8%) both closed with losses. Volume reported was lighter that the prior session totals on the NYSE and on the Nasdaq exchange, indicative of no increase in selling from the institutional crowd. Breadth was negative as decliners led advancers by a 2-1 margin on the NYSE and by more than a 5-3 margin on the Nasdaq exchange. There were 71 high-ranked companies from the Leaders List that hit new 52-week highs and were listed on the BreakOuts Page, versus the total of 152 on the prior session. New 52-week highs totals contracted yet still outnumbered new 52-week lows totals on the NYSE and on the Nasdaq exchange. The major indices are in a confirmed uptrend (M criteria). New buying efforts should be only made in stocks fitting all key criteria of the fact-based investment system.
PICTURED: The S&P 500 Index pulled back from its all-time high after 4 consecutive gains.
NVIDIA (NVDA +3.12%) was among the influential winners after an analyst raised thier target price. Alphabet (GOOG +2.04%) also posted a gain that added support for the broader market. FedEx (FDX +7.4%) was the top performing stock in the S&P 500 after reporting better than expected earnings and authorizing a new $5 billion share repurchase program.
The S&P 500 information technology (+0.5%) and communication services (+0.9%) sectors were top gainers. Lululemon Athletica (LULU -15.80%) and NIKE (NKE -6.90%) bot registered sharp declines after disappointing guidance. Tesla (TSLA -1.15%) sputtered after lowering production at its China plant amid slowing EV sales. The consumer discretionary sector (-0.6%) declined. The real estate (-1.2%) and financial (-1.2%) sectors underperformed the broader market.
The 2-yr note yield declined three basis points to 4.60%. The 10-yr note yield fell five basis points to 4.22%.
|
 Kenneth J. Gruneisen started out as a licensed stockbroker in August 1987, a couple of months prior to the historic stock market crash that took the Dow Jones Industrial Average down -22.6% in a single day. He has published daily fact-based fundamental and technical analysis on high-ranked stocks online for two decades. Through FACTBASEDINVESTING.COM, Kenneth provides educational articles, news, market commentary, and other information regarding proven investment systems that work in good times and bad.
Comments contained in the body of this report are technical opinions only and are not necessarily those of Gruneisen Growth Corp. The material herein has been obtained from sources believed to be reliable and accurate, however, its accuracy and completeness cannot be guaranteed. Our firm, employees, and customers may effect transactions, including transactions contrary to any recommendation herein, or have positions in the securities mentioned herein or options with respect thereto. Any recommendation contained in this report may not be suitable for all investors and it is not to be deemed an offer or solicitation on our part with respect to the purchase or sale of any securities. |
|
 |
Financial and Commodity-Linked Groups Lost Ground
Kenneth J. Gruneisen - Passed the CAN SLIM® Master's Exam
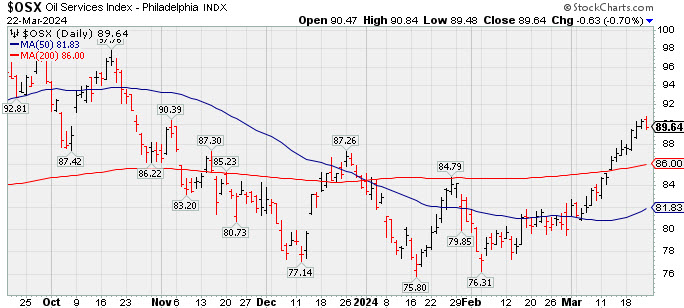
The Bank Index ($BKX -1.50) and the Broker/Dealer Index ($XBD -1.71%) both posted influential losses while the Retail Index ($RLX -0.03%) finsihed flat on Friday. The tech sector was mixed and little changed, led by the Semiconductor Index ($SOX +0.21%) as the Networking Index ($NWX -0.25%) and the Biotech Index ($BTK -0.46%) both edged lower. Commodity-linked groups had a slightly negative bias as the Gold & Silver Index ($XAU -1.36%) outpaced the Oil Services Index ($OSX -0.70%) to the downside and the Integrated Oil Index ($XOI -0.15%) ended lightly in the red.
![]() PICTURED: The Oil Services Index ($OSX -0.70%) pulled back on Friday breaking a streak of 9 consecutive gains.
| Oil Services |
$OSX |
89.64 |
-0.63 |
-0.70% |
+6.87% |
| Integrated Oil |
$XOI |
2,112.37 |
-3.17 |
-0.15% |
+13.42% |
| Semiconductor |
$SOX |
4,908.26 |
+10.39 |
+0.21% |
+17.55% |
| Networking |
$NWX |
804.82 |
-2.02 |
-0.25% |
-3.36% |
| Broker/Dealer |
$XBD |
601.76 |
-10.47 |
-1.71% |
+7.98% |
| Retail |
$RLX |
4,501.88 |
-1.18 |
-0.03% |
+15.77% |
| Gold & Silver |
$XAU |
119.21 |
-1.64 |
-1.36% |
-5.15% |
| Bank |
$BKX |
101.70 |
-1.55 |
-1.50% |
+5.92% |
| Biotech |
$BTK |
5,266.13 |
-24.11 |
-0.46% |
-2.82% |
|
|
|
 |
Hubbell Perched at All-Time High After 5 Weekly Gains
Kenneth J. Gruneisen - Passed the CAN SLIM® Master's Exam
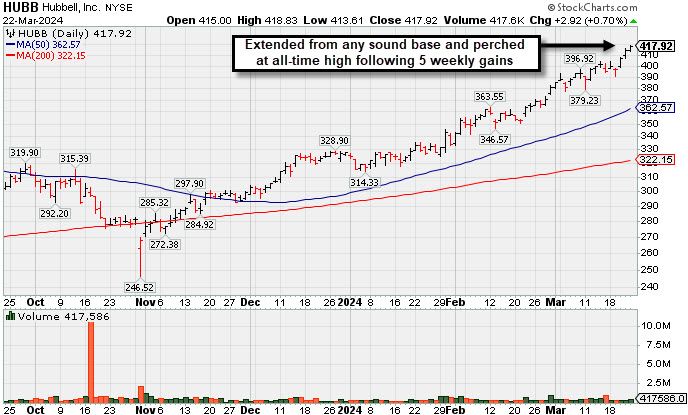
Hubbell (HUBB +$2.92 or +0.70% to $417.92) hit yet another new all-time high with today's 3rd consecutive gain backed by near average volume, getting very extended from the previously noted base. Its 50-day moving average (DMA) line ($363) defines important support to watch on pullbacks.
HUBB was highlighted yellow in the earlier mid-day report (read here) with pivot point cited based on its 1/22/24 high as it rose from a cup-with-handle base. It was last shown in great detail in this FSU section on 2/28/24 with an annotated graph under the headline "Inched to New Highs With Average Volume". Quarterly earnings increases have been above the +25% minimum (C criteria). Annual earnings history (A criteria) had a downturn in FY '20 like many companies during the pandemic. It has a 95 Earnings Per Share Rating, well above the 80+ minimum for buy candidates.The high-ranked Electrical-Power/Equipmt firm has 53.6 million shares outstanding (S criteria) which can contribute to greater price volatility in the event of institutional buying or selling. The number of top-rated funds owning its shares rose from 805 in Jun '22 to 1,755 in Dec '23, a reassuring sign concerning the I criteria. The current Up/Down Volume Ratio of 1.7 is an unbiased indication it has been under slight accumulation over the past 50 days. It has an A Timeliness Rating and a B Sponsorship Rating.
|
|
|
Color Codes Explained :
Y - Better candidates highlighted by our
staff of experts.
G - Previously featured
in past reports as yellow but may no longer be buyable under the
guidelines.
***Last / Change / Volume data in this table is the closing quote data***
Symbol/Exchange
Company Name
Industry Group |
PRICE |
CHANGE
(%Change) |
Day High |
Volume
(% DAV)
(% 50 day avg vol) |
52 Wk Hi
% From Hi |
Featured
Date |
Price
Featured |
Pivot Featured |
|
Max Buy |
 ANET
-
NYSE
ANET
-
NYSE
Arista Networks
Computer-Networking
|
$306.42
|
+1.82
0.60% |
$307.74
|
2,332,000
88.60% of 50 DAV
50 DAV is 2,632,000
|
$305.63
0.26%
|
3/18/2024
|
$188.84
|
PP = $292.76
|
|
MB = $307.40
|
Most Recent Note - 3/21/2024 5:31:18 PM
Y - Hit a new all-time high approaching its "max buy" level with today's 2nd consecutive gain backed by near average volume. Its 50 DMA line ($271) defines near-term support to watch on pullbacks. Color code was changed to yellow after forming a new flat base noted as a riskier "late stage" base.
>>> FEATURED STOCK ARTICLE : Best Ever Close for Arista Networks - 3/1/2024 |
View all notes |
Set NEW NOTE alert |
Company Profile |
SEC
News |
Chart |
Request a new note
C
A
S
I |
NVO
-
NYSE
Novo Nordisk ADR
Medical-Ethical Drugs
|
$128.76
|
-0.41
-0.31% |
$129.49
|
3,220,768
58.68% of 50 DAV
50 DAV is 5,489,000
|
$138.28
-6.88%
|
3/1/2024
|
$124.23
|
PP = $124.97
|
|
MB = $131.22
|
Most Recent Note - 3/21/2024 1:25:44 PM
G - Managed a "positive reversal" from today's early low. Volume totals have been cooling while stubbornly holding its ground after rallying from a noted new advanced "3-weeks tight" base with big volume-driven gains. Its 50 DMA line ($120) defines near-term support above prior lows in the $118 area.
>>> FEATURED STOCK ARTICLE : Perched at All-Time High After Rallying from Advanced "3-Weeks Tight" - 3/12/2024 |
View all notes |
Set NEW NOTE alert |
Company Profile |
SEC
News |
Chart |
Request a new note
C
A
S
I |
AXON
-
NASDAQ
Axon Enterprise
Security/Sfty
|
$316.32
|
+0.23
0.07% |
$318.18
|
373,002
76.12% of 50 DAV
50 DAV is 490,000
|
$325.63
-2.86%
|
11/8/2023
|
$127.84
|
PP = $223.30
|
|
MB = $234.47
|
Most Recent Note - 3/20/2024 5:06:33 PM
G - Posted a 4th consecutive small gain today with lighter volume, still hovering near its all-time high. Bullish action came after it reported Dec '23 quarterly earnings +60% on +29% sales revenues versus the year-ago period. Its 50-day moving average (DMA) line ($276) defines near-term support to watch.
>>> FEATURED STOCK ARTICLE : Hovering Near All-Time High; Spiked Higher Following Earnings - 3/14/2024 |
View all notes |
Set NEW NOTE alert |
Company Profile |
SEC
News |
Chart |
Request a new note
C
A
S
I |
TDG
-
NYSE
TransDigm Group
Aerospace/Defense
|
$1,231.20
|
-1.18
-0.10% |
$1,238.00
|
138,077
62.76% of 50 DAV
50 DAV is 220,000
|
$1,238.34
-0.58%
|
12/12/2023
|
$1,000.39
|
PP = $1,013.18
|
|
MB = $1,063.84
|
Most Recent Note - 3/20/2024 5:05:42 PM
G - Posted a 3rd consecutive gain today back by light volume, wedging to a new all-time high after 3 weeks of tight closes. Its 50 DMA line ($1,127) defines near-term support to watch.
>>> FEATURED STOCK ARTICLE : Perched in Tight Range Encountering Distribtion Near All-Time High - 3/15/2024 |
View all notes |
Set NEW NOTE alert |
Company Profile |
SEC
News |
Chart |
Request a new note
C
A
S
I |
CRWD
-
NASDAQ
CrowdStrike Holdings
Computer Sftwr-Security
|
$327.36
|
-2.10
-0.64% |
$328.39
|
2,572,745
61.33% of 50 DAV
50 DAV is 4,195,000
|
$365.00
-10.31%
|
1/2/2024
|
$246.42
|
PP = $261.91
|
|
MB = $275.01
|
 Most Recent Note - 3/22/2024 3:57:27 PM
G - Volume totals have been cooling while consolidating above its 50 DMA ($311.56) which recently acted as support. It has not formed a sound base of sufficient length. Fundamentals remain strong after it reported Jan '24 quarterly earnings +102% on +33% sales revenues versus the year-ago period.
>>> FEATURED STOCK ARTICLE : Encountered Distributional Pressure After Spiking to New High - 3/11/2024 |
View all notes |
Set NEW NOTE alert |
Company Profile |
SEC
News |
Chart |
Request a new note
C
A
S
I |
Symbol/Exchange
Company Name
Industry Group |
PRICE |
CHANGE
(%Change) |
Day High |
Volume
(% DAV)
(% 50 day avg vol) |
52 Wk Hi
% From Hi |
Featured
Date |
Price
Featured |
Pivot Featured |
|
Max Buy |
ELF
-
NYSE
e.l.f. Beauty
Cosmetics/Personal Care
|
$205.60
|
-1.71
-0.82% |
$209.70
|
976,790
62.74% of 50 DAV
50 DAV is 1,557,000
|
$221.83
-7.32%
|
1/2/2024
|
$138.23
|
PP = $153.63
|
|
MB = $161.31
|
Most Recent Note - 3/21/2024 5:33:34 PM
G - Posted a 2nd consecutive gain with below-average volume. It is very extended from any sound base. Its 50 DMA line ($180) defines important near-term support to watch. Fundamentals remain strong.
>>> FEATURED STOCK ARTICLE : Encountering Distributional Pressure Near All-Time High - 3/8/2024 |
View all notes |
Set NEW NOTE alert |
Company Profile |
SEC
News |
Chart |
Request a new note
C
A
S
I |
PCAR
-
NASDAQ
Paccar
Trucks and Parts-Hvy Duty
|
$123.75
|
-0.67
-0.54% |
$124.89
|
2,358,201
99.92% of 50 DAV
50 DAV is 2,360,000
|
$124.57
-0.66%
|
1/23/2024
|
$100.35
|
PP = $98.57
|
|
MB = $103.50
|
Most Recent Note - 3/21/2024 5:21:02 PM
G - Hit yet another new all-time high with today's 5th consecutive gain. Its 50 DMA line ($107) defines near-term support to watch on pullbacks. Fundamentals remain strong. See the latest FSU analysis for more details and a new annotated graph.
>>> FEATURED STOCK ARTICLE : Hit New High With 5th Consecutive Gain - 3/21/2024 |
View all notes |
Set NEW NOTE alert |
Company Profile |
SEC
News |
Chart |
Request a new note
C
A
S
I |
HUBB
-
NYSE
Hubbell
Electrical-Power/Equipmt
|
$417.92
|
+2.92
0.70% |
$418.83
|
414,122
96.08% of 50 DAV
50 DAV is 431,000
|
$416.06
0.45%
|
1/30/2024
|
$343.26
|
PP = $336.83
|
|
MB = $353.67
|
Most Recent Note - 3/22/2024 5:10:07 PM
G - Perched at a new all-time high after today's 3rd consecutive gain and 5th weekly gain, very extended from the previously noted base. Its 50 DMA line ($363) defines important support to watch on pullbacks. See the latest FSU analysis for more details and a new annotated graph.
>>> FEATURED STOCK ARTICLE : Hubbell Perched at All-Time High After 5 Weekly Gains - 3/22/2024 |
View all notes |
Set NEW NOTE alert |
Company Profile |
SEC
News |
Chart |
Request a new note
C
A
S
I |
MANH
-
NASDAQ
Manhattan Associates
Computer Sftwr-Enterprse
|
$250.84
|
-2.08
-0.82% |
$253.04
|
367,772
98.33% of 50 DAV
50 DAV is 374,000
|
$266.94
-6.03%
|
1/31/2024
|
$240.57
|
PP = $230.71
|
|
MB = $242.25
|
Most Recent Note - 3/21/2024 5:25:08 PM
G - Posted a 4th straight gain, consolidating above its 50 DMA line ($241) which defines near-term support to watch on pullbacks.
>>> FEATURED STOCK ARTICLE : Hovering Near All-Time High After Streak of Small Gains - 2/29/2024 |
View all notes |
Set NEW NOTE alert |
Company Profile |
SEC
News |
Chart |
Request a new note
C
A
S
I |
USLM
-
NASDAQ
U.S. Lime & Minerals
Bldg-Cement/Concrt/Ag
|
$299.40
|
-5.48
-1.80% |
$303.28
|
15,143
65.84% of 50 DAV
50 DAV is 23,000
|
$307.48
-2.63%
|
2/9/2024
|
$254.68
|
PP = $265.09
|
|
MB = $278.34
|
Most Recent Note - 3/22/2024 5:14:29 PM
G - Pulled back today from its all-time high with a small loss on light volume. It is extended from the previously noted base. Prior highs in the $265-266 area define initial near-term support to watch on pullbacks.
>>> FEATURED STOCK ARTICLE : Hit New All Time High With Light Volume Behind 5th Straight Gain - 3/13/2024 |
View all notes |
Set NEW NOTE alert |
Company Profile |
SEC
News |
Chart |
Request a new note
C
A
S
I |
Symbol/Exchange
Company Name
Industry Group |
PRICE |
CHANGE
(%Change) |
Day High |
Volume
(% DAV)
(% 50 day avg vol) |
52 Wk Hi
% From Hi |
Featured
Date |
Price
Featured |
Pivot Featured |
|
Max Buy |
NOW
-
NYSE
ServiceNow
Computer Sftwr-Enterprse
|
$774.15
|
+0.97
0.13% |
$779.89
|
802,643
62.22% of 50 DAV
50 DAV is 1,290,000
|
$815.32
-5.05%
|
2/22/2024
|
$771.75
|
PP = $815.32
|
|
MB = $856.09
|
Most Recent Note - 3/20/2024 5:02:22 PM
Y - Rebounded and closed above its 50 DMA line ($763.61) helping its outlook improve with today's 3rd consecutive gain backed by light volume and its color code is changed to yellow. Prior lows in the $730 area define the next important near-term support to watch. See the latest FSU analysis for more details and a new annotated graph.
>>> FEATURED STOCK ARTICLE : NOW Quietly Rebounded Above 50-Day Moving Average Line - 3/20/2024 |
View all notes |
Set NEW NOTE alert |
Company Profile |
SEC
News |
Chart |
Request a new note
C
A
S
I |
SNPS
-
NASDAQ
Synopsys
Computer Sftwr-Design
|
$593.69
|
-8.32
-1.38% |
$604.91
|
1,229,316
92.85% of 50 DAV
50 DAV is 1,324,000
|
$629.38
-5.67%
|
2/22/2024
|
$600.65
|
PP = $582.85
|
|
MB = $611.99
|
Most Recent Note - 3/21/2024 5:36:29 PM
Y - Posted a 4th consecutive gain today with +38% above-average volume and managed a best-ever close. Found support above its 50 DMA line ($554). Previously noted - " A strong volume-driven gain and close above the pivot point is needed to clinch a proper technical buy signal."
>>> FEATURED STOCK ARTICLE : Rallying From Support at 50-Day Moving Average Line - 3/19/2024 |
View all notes |
Set NEW NOTE alert |
Company Profile |
SEC
News |
Chart |
Request a new note
C
A
S
I |
PAY
-
NYSE
Paymentus Holdings
Finance-CrdtCard/PmtPr
|
$23.64
|
-0.26
-1.09% |
$24.10
|
168,073
54.04% of 50 DAV
50 DAV is 311,000
|
$24.99
-5.40%
|
3/5/2024
|
$19.97
|
PP = $18.89
|
|
MB = $19.83
|
Most Recent Note - 3/20/2024 12:44:21 PM
G - Posting a volume-driven gain today rebounding near its 52-week high. Very extended from the previously noted base. Prior highs in the $18 range define important initial support to watch on pullbacks.
>>> FEATURED STOCK ARTICLE : Big Gap Up Gain Triggered Technical Buy Signal - 3/5/2024 |
View all notes |
Set NEW NOTE alert |
Company Profile |
SEC
News |
Chart |
Request a new note
C
A
S
I |
|
|
|
THESE ARE NOT BUY RECOMMENDATIONS!
Comments contained in the body of this report are technical
opinions only. The material herein has been obtained
from sources believed to be reliable and accurate, however,
its accuracy and completeness cannot be guaranteed.
This site is not an investment advisor, hence it does
not endorse or recommend any securities or other investments.
Any recommendation contained in this report may not
be suitable for all investors and it is not to be deemed
an offer or solicitation on our part with respect to
the purchase or sale of any securities. All trademarks,
service marks and trade names appearing in this report
are the property of their respective owners, and are
likewise used for identification purposes only.
This report is a service available
only to active Paid Premium Members.
You may opt-out of receiving report notifications
at any time. Questions or comments may be submitted
by writing to Premium Membership Services 665 S.E. 10 Street, Suite 201 Deerfield Beach, FL 33441-5634 or by calling 1-800-965-8307
or 954-785-1121.
|
|
|