You are not logged in.
This means you
CAN ONLY VIEW reports that were published prior to Sunday, April 13, 2025.
You
MUST UPGRADE YOUR MEMBERSHIP if you want to see any current reports.
AFTER MARKET UPDATE - MONDAY, MARCH 25TH, 2024
Previous After Market Report Next After Market Report >>>
|
|
|
|
DOW |
-162.26 |
39,313.64 |
-0.41% |
|
Volume |
812,636,072 |
-3% |
|
Volume |
4,687,914,600 |
+7% |
|
NASDAQ |
-44.35 |
16,384.47 |
-0.27% |
|
Advancers |
1,140 |
41% |
|
Advancers |
1,789 |
42% |
|
S&P 500 |
-15.99 |
5,218.19 |
-0.31% |
|
Decliners |
1,631 |
59% |
|
Decliners |
2,446 |
58% |
|
Russell 2000 |
+2.17 |
2,074.16 |
+0.10% |
|
52 Wk Highs |
164 |
|
|
52 Wk Highs |
111 |
|
|
S&P 600 |
-3.65 |
1,307.94 |
-0.28% |
|
52 Wk Lows |
23 |
|
|
52 Wk Lows |
111 |
|
|
 |
Market Shows Less Leadership as Major Indices Pull Back
Kenneth J. Gruneisen - Passed the CAN SLIM® Master's Exam
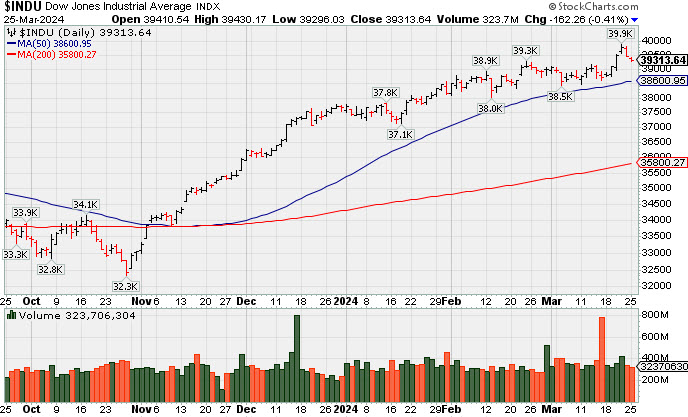
The S&P 500 fell -0.3%, Nasdaq Composite also logged a -0.3% decline, and the Dow Jones Industrial Average -0.4% also fell while the Russell 2000 eked out a small gain of +0.1%. Volume reported was mixed, lighter that the prior session total on the NYSE and slightly higher on the Nasdaq exchange. Breadth was slightly negative as decliners led advancers by a 4-3 margin on the NYSE and on the Nasdaq exchange. There were 51 high-ranked companies from the Leaders List that hit new 52-week highs and were listed on the BreakOuts Page, versus the total of 71 on the prior session. New 52-week highs totals contracted yet still outnumbered new 52-week lows on the NYSE while the new highs and new lows totals were evenly matched on the Nasdaq exchange. The major indices are in a confirmed uptrend (M criteria). New buying efforts should be only made in stocks fitting all key criteria of the fact-based investment system.
PICTURED: The Dow Jones Industrial Averageb is perched near its all-time high.
Alphabet (GOOG -0.41%), Meta Platforms (META -1.29%), and Apple (AAPL -0.83%) each ended slightly in the red after news that the EU commission opened non-compliance investigations against them. Meanwhile, news that China will not allow government computers to use chips from AMD (AMD -0.57%) and Intel (INTC -1.74%) weighed on the semiconductor group.
The energy sector logged the biggest gain by a wide margin amid rising oil prices ($81.95/bbl, +1.33, +1.7%). Eight of the 11 S&P 500 sectors fell as health care (-0.2%) and industrials (-0.7%) were laggards.
A fresh $66 billion 2-yr note auction was met with soft demand. The 10-yr note yield rose four basis points to 4.25% and the 2-yr note yield rose three basis points to 4.63%.
|
 Kenneth J. Gruneisen started out as a licensed stockbroker in August 1987, a couple of months prior to the historic stock market crash that took the Dow Jones Industrial Average down -22.6% in a single day. He has published daily fact-based fundamental and technical analysis on high-ranked stocks online for two decades. Through FACTBASEDINVESTING.COM, Kenneth provides educational articles, news, market commentary, and other information regarding proven investment systems that work in good times and bad.
Comments contained in the body of this report are technical opinions only and are not necessarily those of Gruneisen Growth Corp. The material herein has been obtained from sources believed to be reliable and accurate, however, its accuracy and completeness cannot be guaranteed. Our firm, employees, and customers may effect transactions, including transactions contrary to any recommendation herein, or have positions in the securities mentioned herein or options with respect thereto. Any recommendation contained in this report may not be suitable for all investors and it is not to be deemed an offer or solicitation on our part with respect to the purchase or sale of any securities. |
|
 |
Commodity-Linked Groups Edged Higher
Kenneth J. Gruneisen - Passed the CAN SLIM® Master's Exam
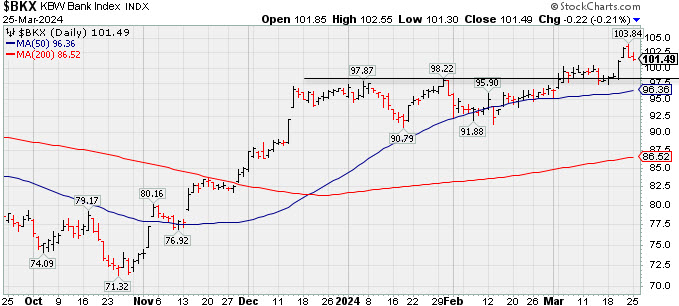
The Retail Index ($RLX -0.33%) and the Bank Index ($BKX -0.21) edged lower while the Broker/Dealer Index ($XBD +0.09%) finsihed flat. The tech sector had a slightly negative bias as the Semiconductor Index ($SOX -0.34%) and the Networking Index ($NWX -0.53%) both edged lower while the Biotech Index ($BTK +0.07%) held its ground. Commodity-linked groups had a positive bias as the Gold & Silver Index ($XAU +0.69%), Oil Services Index ($OSX +1.22%), and the Integrated Oil Index ($XOI +0.77%) each posted a modest gain.
![]() PICTURED: The Bank Index ($BKX -0.21) edged lower after hitting new 2024 highs last week.
| Oil Services |
$OSX |
90.73 |
+1.09 |
+1.22% |
+8.17% |
| Integrated Oil |
$XOI |
2,128.61 |
+16.24 |
+0.77% |
+14.29% |
| Semiconductor |
$SOX |
4,891.49 |
-16.77 |
-0.34% |
+17.15% |
| Networking |
$NWX |
800.53 |
-4.29 |
-0.53% |
-3.88% |
| Broker/Dealer |
$XBD |
602.29 |
+0.53 |
+0.09% |
+8.07% |
| Retail |
$RLX |
4,486.84 |
-15.04 |
-0.33% |
+15.38% |
| Gold & Silver |
$XAU |
120.03 |
+0.82 |
+0.69% |
-4.50% |
| Bank |
$BKX |
101.49 |
-0.22 |
-0.21% |
+5.69% |
| Biotech |
$BTK |
5,269.91 |
+3.79 |
+0.07% |
-2.75% |
|
|
|
 |
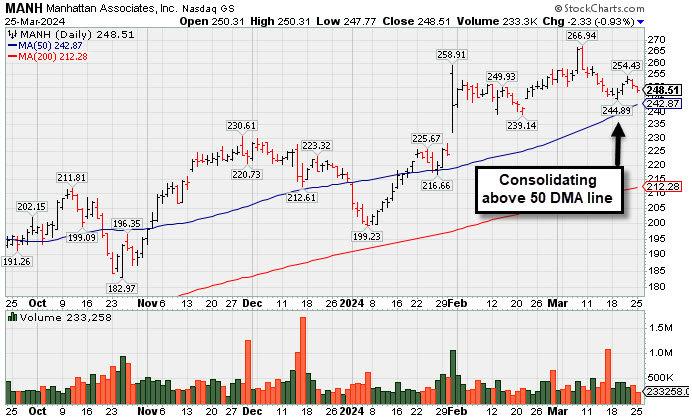
Manhattan Associates Consolidating Above 50-Day Moving Average
Kenneth J. Gruneisen - Passed the CAN SLIM® Master's Exam
Manhattan Associates Inc (MANH -$2.33 or -0.93% to $248.51) closed just -6.9% off its all-time high today and volume totals have been cooling. Its 50-day moving average (DMA) line ($242.87) defines near-term support to watch above the prior low ($239.14 on 2/21/24). More damaging losses could raise concerns and trigger technical sell signals. MANH was highlighted in yellow with pivot point cited based on its 11/29/23 high plus 10 cents in the 1/31/24 mid-day report (read here). It was last shown in great detail on 2/29/24 with an annotated graph under the headline, "Hovering Near All-Time High After Streak of Small Gains". Earnings increases were above the +25% minimum guideline in the 5 latest quarterly comparisons through Dec '23. Annual earnings growth has been strong. It has a 96 Earnings Per Share (EPS) rating. Its Relative Strength rating is 89. It has a small supply of 61.6 million shares (S criteria) outstanding, which can contribute to volatility in the event of institutional buying or selling. The number of top-rated funds owning its shares rose from 849 in Mar '23 to 1,296 in Dec '23, a reassuring sign concerning the I criteria. Charts courtesy www.stockcharts.com
|
|
|
Color Codes Explained :
Y - Better candidates highlighted by our
staff of experts.
G - Previously featured
in past reports as yellow but may no longer be buyable under the
guidelines.
***Last / Change / Volume data in this table is the closing quote data***
Symbol/Exchange
Company Name
Industry Group |
PRICE |
CHANGE
(%Change) |
Day High |
Volume
(% DAV)
(% 50 day avg vol) |
52 Wk Hi
% From Hi |
Featured
Date |
Price
Featured |
Pivot Featured |
|
Max Buy |
 ANET
-
NYSE
ANET
-
NYSE
Arista Networks
Computer-Networking
|
$305.50
|
-0.92
-0.30% |
$307.37
|
2,003,900
75.73% of 50 DAV
50 DAV is 2,646,000
|
$307.74
-0.73%
|
3/18/2024
|
$188.84
|
PP = $292.76
|
|
MB = $307.40
|
Most Recent Note - 3/21/2024 5:31:18 PM
Y - Hit a new all-time high approaching its "max buy" level with today's 2nd consecutive gain backed by near average volume. Its 50 DMA line ($271) defines near-term support to watch on pullbacks. Color code was changed to yellow after forming a new flat base noted as a riskier "late stage" base.
>>> FEATURED STOCK ARTICLE : Best Ever Close for Arista Networks - 3/1/2024 |
View all notes |
Set NEW NOTE alert |
Company Profile |
SEC
News |
Chart |
Request a new note
C
A
S
I |
NVO
-
NYSE
Novo Nordisk ADR
Medical-Ethical Drugs
|
$129.05
|
+0.29
0.23% |
$130.25
|
3,311,976
60.67% of 50 DAV
50 DAV is 5,459,000
|
$138.28
-6.67%
|
3/1/2024
|
$124.23
|
PP = $124.97
|
|
MB = $131.22
|
 Most Recent Note - 3/25/2024 5:34:38 PM
G - Posted a small gain with light volume today. Volume totals have been cooling while stubbornly holding its ground after rallying from a noted new advanced "3-weeks tight" base with big volume-driven gains. Its 50 DMA line ($120.55) defines near-term support above prior lows in the $118 area.
>>> FEATURED STOCK ARTICLE : Perched at All-Time High After Rallying from Advanced "3-Weeks Tight" - 3/12/2024 |
View all notes |
Set NEW NOTE alert |
Company Profile |
SEC
News |
Chart |
Request a new note
C
A
S
I |
AXON
-
NASDAQ
Axon Enterprise
Security/Sfty
|
$315.42
|
-0.90
-0.28% |
$317.53
|
629,680
129.03% of 50 DAV
50 DAV is 488,000
|
$325.63
-3.14%
|
11/8/2023
|
$220.13
|
PP = $223.30
|
|
MB = $234.47
|
Most Recent Note - 3/25/2024 9:19:25 AM
G - Posted 6 consecutive small gains hovering near its all-time high. Its 50-day moving average (DMA) line ($279) defines near-term support to watch. Fundamentals remain strong.
>>> FEATURED STOCK ARTICLE : Hovering Near All-Time High; Spiked Higher Following Earnings - 3/14/2024 |
View all notes |
Set NEW NOTE alert |
Company Profile |
SEC
News |
Chart |
Request a new note
C
A
S
I |
TDG
-
NYSE
TransDigm Group
Aerospace/Defense
|
$1,223.41
|
-7.79
-0.63% |
$1,238.13
|
114,329
52.21% of 50 DAV
50 DAV is 219,000
|
$1,238.34
-1.21%
|
12/12/2023
|
$1,000.39
|
PP = $1,013.18
|
|
MB = $1,063.84
|
Most Recent Note - 3/25/2024 5:36:07 PM
G - Volume totals have been cooling while stubbornly holding its ground after wedging to a new all-time high. Its 50 DMA line ($1,140) defines near-term support to watch.
>>> FEATURED STOCK ARTICLE : Perched in Tight Range Encountering Distribtion Near All-Time High - 3/15/2024 |
View all notes |
Set NEW NOTE alert |
Company Profile |
SEC
News |
Chart |
Request a new note
C
A
S
I |
CRWD
-
NASDAQ
CrowdStrike Holdings
Computer Sftwr-Security
|
$324.59
|
-2.99
-0.91% |
$329.25
|
1,690,671
40.70% of 50 DAV
50 DAV is 4,154,000
|
$365.00
-11.07%
|
1/2/2024
|
$246.42
|
PP = $261.91
|
|
MB = $275.01
|
Most Recent Note - 3/22/2024 3:57:27 PM
G - Volume totals have been cooling while consolidating above its 50 DMA ($311.56) which recently acted as support. It has not formed a sound base of sufficient length. Fundamentals remain strong after it reported Jan '24 quarterly earnings +102% on +33% sales revenues versus the year-ago period.
>>> FEATURED STOCK ARTICLE : Encountered Distributional Pressure After Spiking to New High - 3/11/2024 |
View all notes |
Set NEW NOTE alert |
Company Profile |
SEC
News |
Chart |
Request a new note
C
A
S
I |
Symbol/Exchange
Company Name
Industry Group |
PRICE |
CHANGE
(%Change) |
Day High |
Volume
(% DAV)
(% 50 day avg vol) |
52 Wk Hi
% From Hi |
Featured
Date |
Price
Featured |
Pivot Featured |
|
Max Buy |
ELF
-
NYSE
e.l.f. Beauty
Cosmetics/Personal Care
|
$200.04
|
-5.56
-2.70% |
$207.01
|
1,120,338
71.95% of 50 DAV
50 DAV is 1,557,000
|
$221.83
-9.82%
|
1/2/2024
|
$138.23
|
PP = $153.63
|
|
MB = $161.31
|
Most Recent Note - 3/25/2024 5:37:47 PM
G - Very extended from any sound base, consolidating well above its 50 DMA line ($181.56) which defines important near-term support to watch. Fundamentals remain strong.
>>> FEATURED STOCK ARTICLE : Encountering Distributional Pressure Near All-Time High - 3/8/2024 |
View all notes |
Set NEW NOTE alert |
Company Profile |
SEC
News |
Chart |
Request a new note
C
A
S
I |
PCAR
-
NASDAQ
Paccar
Trucks and Parts-Hvy Duty
|
$123.40
|
-0.35
-0.28% |
$124.23
|
1,310,199
55.07% of 50 DAV
50 DAV is 2,379,000
|
$124.89
-1.19%
|
1/23/2024
|
$100.35
|
PP = $98.57
|
|
MB = $103.50
|
Most Recent Note - 3/21/2024 5:21:02 PM
G - Hit yet another new all-time high with today's 5th consecutive gain. Its 50 DMA line ($107) defines near-term support to watch on pullbacks. Fundamentals remain strong. See the latest FSU analysis for more details and a new annotated graph.
>>> FEATURED STOCK ARTICLE : Hit New High With 5th Consecutive Gain - 3/21/2024 |
View all notes |
Set NEW NOTE alert |
Company Profile |
SEC
News |
Chart |
Request a new note
C
A
S
I |
HUBB
-
NYSE
Hubbell
Electrical-Power/Equipmt
|
$413.12
|
-4.80
-1.15% |
$419.65
|
286,124
66.23% of 50 DAV
50 DAV is 432,000
|
$418.83
-1.36%
|
1/30/2024
|
$343.26
|
PP = $336.83
|
|
MB = $353.67
|
Most Recent Note - 3/22/2024 5:10:07 PM
G - Perched at a new all-time high after today's 3rd consecutive gain and 5th weekly gain, very extended from the previously noted base. Its 50 DMA line ($363) defines important support to watch on pullbacks. See the latest FSU analysis for more details and a new annotated graph.
>>> FEATURED STOCK ARTICLE : Hubbell Perched at All-Time High After 5 Weekly Gains - 3/22/2024 |
View all notes |
Set NEW NOTE alert |
Company Profile |
SEC
News |
Chart |
Request a new note
C
A
S
I |
MANH
-
NASDAQ
Manhattan Associates
Computer Sftwr-Enterprse
|
$248.51
|
-2.33
-0.93% |
$250.84
|
233,322
61.89% of 50 DAV
50 DAV is 377,000
|
$266.94
-6.90%
|
1/31/2024
|
$240.57
|
PP = $230.71
|
|
MB = $242.25
|
Most Recent Note - 3/25/2024 5:20:07 PM
G - Volume totals have been cooling while consolidating above its 50 DMA line ($242.87) which defines near-term support. See the latest FSU analysis for more details and a new annotated graph.
>>> FEATURED STOCK ARTICLE : Manhattan Associates Consolidating Above 50-Day Moving Average - 3/25/2024 |
View all notes |
Set NEW NOTE alert |
Company Profile |
SEC
News |
Chart |
Request a new note
C
A
S
I |
USLM
-
NASDAQ
U.S. Lime & Minerals
Bldg-Cement/Concrt/Ag
|
$293.60
|
-6.33
-2.11% |
$304.17
|
9,817
42.68% of 50 DAV
50 DAV is 23,000
|
$307.48
-4.51%
|
2/9/2024
|
$254.68
|
PP = $265.09
|
|
MB = $278.34
|
Most Recent Note - 3/25/2024 5:36:49 PM
G - Pulled back today from its all-time high with a 2nd consecutive loss on lighter volume. It is extended from the previously noted base. Prior highs in the $265-266 area define initial near-term support to watch on pullbacks.
>>> FEATURED STOCK ARTICLE : Hit New All Time High With Light Volume Behind 5th Straight Gain - 3/13/2024 |
View all notes |
Set NEW NOTE alert |
Company Profile |
SEC
News |
Chart |
Request a new note
C
A
S
I |
Symbol/Exchange
Company Name
Industry Group |
PRICE |
CHANGE
(%Change) |
Day High |
Volume
(% DAV)
(% 50 day avg vol) |
52 Wk Hi
% From Hi |
Featured
Date |
Price
Featured |
Pivot Featured |
|
Max Buy |
NOW
-
NYSE
ServiceNow
Computer Sftwr-Enterprse
|
$774.64
|
+0.49
0.06% |
$775.91
|
716,834
55.70% of 50 DAV
50 DAV is 1,287,000
|
$815.32
-4.99%
|
2/22/2024
|
$771.75
|
PP = $815.32
|
|
MB = $856.09
|
Most Recent Note - 3/25/2024 5:33:28 PM
Y - Posted a 6th consecutive small gain with light volume, quietly consolidating and closing above its 50 DMA line ($767). Prior lows in the $730 area define the next important near-term support to watch.
>>> FEATURED STOCK ARTICLE : NOW Quietly Rebounded Above 50-Day Moving Average Line - 3/20/2024 |
View all notes |
Set NEW NOTE alert |
Company Profile |
SEC
News |
Chart |
Request a new note
C
A
S
I |
SNPS
-
NASDAQ
Synopsys
Computer Sftwr-Design
|
$584.32
|
-9.88
-1.66% |
$588.13
|
1,323,871
100.07% of 50 DAV
50 DAV is 1,323,000
|
$629.38
-7.16%
|
2/22/2024
|
$600.65
|
PP = $582.85
|
|
MB = $611.99
|
Most Recent Note - 3/21/2024 5:36:29 PM
Y - Posted a 4th consecutive gain today with +38% above-average volume and managed a best-ever close. Found support above its 50 DMA line ($554). Previously noted - " A strong volume-driven gain and close above the pivot point is needed to clinch a proper technical buy signal."
>>> FEATURED STOCK ARTICLE : Rallying From Support at 50-Day Moving Average Line - 3/19/2024 |
View all notes |
Set NEW NOTE alert |
Company Profile |
SEC
News |
Chart |
Request a new note
C
A
S
I |
PAY
-
NYSE
Paymentus Holdings
Finance-CrdtCard/PmtPr
|
$23.82
|
+0.18
0.76% |
$25.21
|
670,655
214.95% of 50 DAV
50 DAV is 312,000
|
$24.99
-4.68%
|
3/5/2024
|
$19.97
|
PP = $18.89
|
|
MB = $19.83
|
Most Recent Note - 3/25/2024 12:33:18 PM
G - Touched a new 52-week high with today's early volume-driven gain. Very extended from the previously noted base. Prior highs in the $18 range define important initial support to watch on pullbacks.
>>> FEATURED STOCK ARTICLE : Big Gap Up Gain Triggered Technical Buy Signal - 3/5/2024 |
View all notes |
Set NEW NOTE alert |
Company Profile |
SEC
News |
Chart |
Request a new note
C
A
S
I |
|
|
|
THESE ARE NOT BUY RECOMMENDATIONS!
Comments contained in the body of this report are technical
opinions only. The material herein has been obtained
from sources believed to be reliable and accurate, however,
its accuracy and completeness cannot be guaranteed.
This site is not an investment advisor, hence it does
not endorse or recommend any securities or other investments.
Any recommendation contained in this report may not
be suitable for all investors and it is not to be deemed
an offer or solicitation on our part with respect to
the purchase or sale of any securities. All trademarks,
service marks and trade names appearing in this report
are the property of their respective owners, and are
likewise used for identification purposes only.
This report is a service available
only to active Paid Premium Members.
You may opt-out of receiving report notifications
at any time. Questions or comments may be submitted
by writing to Premium Membership Services 665 S.E. 10 Street, Suite 201 Deerfield Beach, FL 33441-5634 or by calling 1-800-965-8307
or 954-785-1121.
|
|
|