You are not logged in.
This means you
CAN ONLY VIEW reports that were published prior to Tuesday, July 9, 2024.
You
MUST UPGRADE YOUR MEMBERSHIP if you want to see any current reports.
AFTER MARKET UPDATE - THURSDAY, MARCH 21ST, 2024
Previous After Market Report Next After Market Report >>>
|
|
|
|
DOW |
+269.24 |
39,781.37 |
+0.68% |
|
Volume |
1,019,738,637 |
+6% |
|
Volume |
5,218,740,500 |
-4% |
|
NASDAQ |
+32.43 |
16,401.84 |
+0.20% |
|
Advancers |
1,879 |
68% |
|
Advancers |
2,443 |
57% |
|
S&P 500 |
+16.91 |
5,241.53 |
+0.32% |
|
Decliners |
891 |
32% |
|
Decliners |
1,810 |
43% |
|
Russell 2000 |
+23.68 |
2,098.56 |
+1.14% |
|
52 Wk Highs |
420 |
|
|
52 Wk Highs |
341 |
|
|
S&P 600 |
+15.12 |
1,327.71 |
+1.15% |
|
52 Wk Lows |
17 |
|
|
52 Wk Lows |
57 |
|
|
 |
Major Indices Continue Hitting New Record Highs
Kenneth J. Gruneisen - Passed the CAN SLIM® Master's Exam
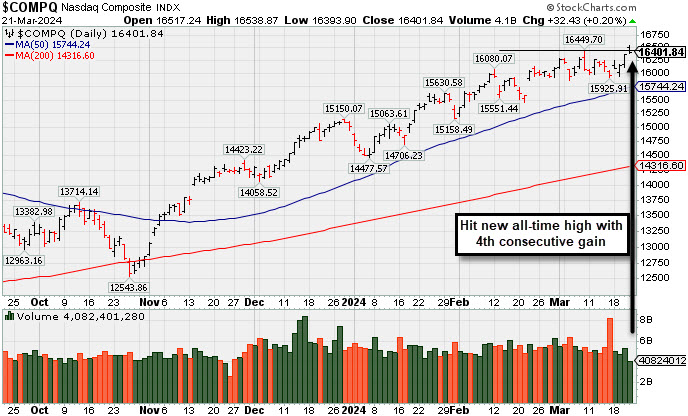
Unanimous gains for the S&P 500 (+0.3%), Nasdaq Composite (+0.2%), and Dow Jones Industrial Average (+0.7%) lifted the indices to fresh all-time highs. The Russell 2000 outperformed other major indices, logging a +1.1% gain. Volume reported was mixed, higher that the prior session total on the NYSE and lighter on the Nasdaq exchange. Breadth was clearly positive as advancers led decliners by more than a 2-1 margin on the NYSE and by a 4-3 margin on the Nasdaq exchange. Leadership expanded as there were 152 high-ranked companies from the Leaders List that hit new 52-week highs and were listed on the BreakOuts Page, versus the total of 109 on the prior session. New 52-week highs totals expanded and solidly outnumbered shrinking new 52-week lows totals on the NYSE and on the Nasdaq exchange. The major indices are in a confirmed uptrend (M criteria). New buying efforts should be only made in stocks fitting all key criteria of the fact-based investment system.
PICTURED: The S&P 600 Small Cap Index is still -11.2% off its October 2021 all time high.
Nine of the 11 S&P 500 sectors closed with gains led by the industrial (+1.0%) and financial (+0.9%) sectors. The utilities (-0.2%) and communication services (-0.2%) sectors were decliners. Apple (AAPL -4.09%) fell on news that the Department of Justice filed an antitrust lawsuit alleging the company blocked software and gaming companies from offering better options. An earnings-related decline in Accenture (ACN -9.31%) weighed on the information technology sector (+0.1%), meanwhile favorable earnings and guidance from Micron (MU +14.13%) helped. Broadcom (AVGO +5.64%) rose after an analyst upgrade. Reddit (RDDT +48.4%) priced its IPO at $34/share, opened at $47. and settled the session at $50.
The 10-yr note yield settled the session unchanged at 4.27% and the 2-yr note yield rose two basis points to 4.63%.
|
 Kenneth J. Gruneisen started out as a licensed stockbroker in August 1987, a couple of months prior to the historic stock market crash that took the Dow Jones Industrial Average down -22.6% in a single day. He has published daily fact-based fundamental and technical analysis on high-ranked stocks online for two decades. Through FACTBASEDINVESTING.COM, Kenneth provides educational articles, news, market commentary, and other information regarding proven investment systems that work in good times and bad.
Comments contained in the body of this report are technical opinions only and are not necessarily those of Gruneisen Growth Corp. The material herein has been obtained from sources believed to be reliable and accurate, however, its accuracy and completeness cannot be guaranteed. Our firm, employees, and customers may effect transactions, including transactions contrary to any recommendation herein, or have positions in the securities mentioned herein or options with respect thereto. Any recommendation contained in this report may not be suitable for all investors and it is not to be deemed an offer or solicitation on our part with respect to the purchase or sale of any securities. |
|
 |
Financial and Tech Indexes Led Group Gainers
Kenneth J. Gruneisen - Passed the CAN SLIM® Master's Exam
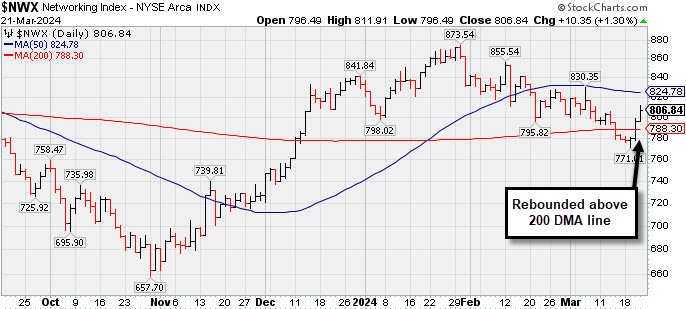
The Bank Index ($BKX +2.16%) and the Broker/Dealer Index ($XBD +2.23%) posted influential gains while the Retail Index ($RLX +0.78%) notched a smaller gains. The tech sector was led by the Semiconductor Index ($SOX +2.29%) and the Networking Index ($NWX +1.30%) while the Biotech Index ($BTK +0.72%) posted a smaller gain.Commodity-linked groups were mixed as the Gold & Silver Index ($XAU -0.39%) edged lower while energy-linked groups rose modestly as the Oil Services Index ($OSX +0.49%) and the Integrated Oil Index ($XOI +0.38%) both edged higher.
![]() PICTURED: The Networking Index ($NWX +1.30%) posted a 3rd consecutive gain while rebounding above its 200-day moving average (DMA) line.
| Oil Services |
$OSX |
90.27 |
+0.44 |
+0.49% |
+7.62% |
| Integrated Oil |
$XOI |
2,115.55 |
+7.94 |
+0.38% |
+13.59% |
| Semiconductor |
$SOX |
4,897.87 |
+109.69 |
+2.29% |
+17.30% |
| Networking |
$NWX |
806.84 |
+10.35 |
+1.30% |
-3.12% |
| Broker/Dealer |
$XBD |
612.24 |
+13.33 |
+2.23% |
+9.86% |
| Retail |
$RLX |
4,503.06 |
+34.93 |
+0.78% |
+15.80% |
| Gold & Silver |
$XAU |
120.85 |
-0.47 |
-0.39% |
-3.85% |
| Bank |
$BKX |
103.26 |
+2.18 |
+2.16% |
+7.53% |
| Biotech |
$BTK |
5,290.24 |
+37.72 |
+0.72% |
-2.37% |
|
|
|
 |
Hit New High With 5th Consecutive Gain
Kenneth J. Gruneisen - Passed the CAN SLIM® Master's Exam
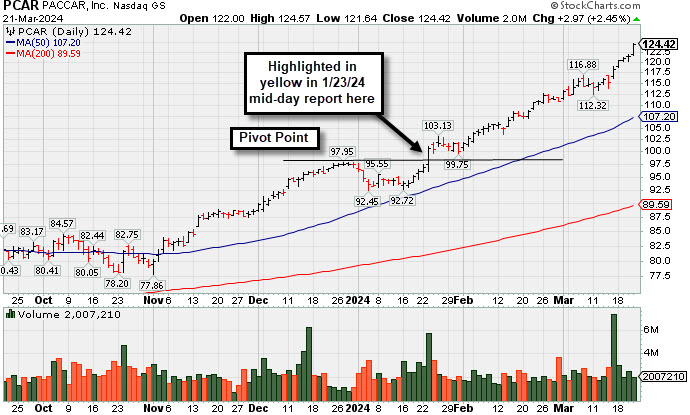
Paccar (PCAR +$2.61 or +2.15% to $124.06) hit yet another new all-time high with today's 5th consecutive gain. Its 50-day moving average (DMA) line ($107) defines near-term support to watch on pullbacks. Fundamentals remain strong.
Bullish action has continued after it reported Dec '23 quarterly earnings +53% on +11% sales revenues versus the year-ago period, its 9th quarterly comparison with better than the +25% minimum earnings guideline (C criteria). There was a downturn in FY' 20 annual earnings (A criteria) like many companies during the pandemic. PCAR has a 95 Earnings Per Share rating.
PCAR was highlighted in yellow in the 1/23/24 mid-day report (read here). Its gain backed by +153% above average volume for a new 52-week high cleared the pivot point based on its 12/13/23 high plus 10 cents triggering a technical buy signal. It was shown in detail on 2/26/24 with an annotated graph under the headline, "Extended From Any Sound Base After 7 Weekly Gains".
The number of top-rated funds owning its shares rose from 2,052 in Mar '23 to 2,193 in Dec '23, a reassuring sign concerning the I criteria. Its current Up/Down Volume Ratio of 2.1 is an unbiased indication its shares have been under accumulation over the past 50 days. It has a Timeliness rating of A and an Accumulation/Distribution rating of A.
Symbol/Exchange
Company Name
Industry Group | PRICE | CHANGE
(%Change) | Day High | Volume
(% DAV)
(% 50 day avg vol) | 52 Wk Hi
% From Hi | Featured
Date | Price
Featured | Pivot Featured | | Max Buy |  ANET - N ANET - N
Arista Networks
Computer-Networking | $304.60 | +8.02
2.70% | $305.63 | 2,919,504
112.25% of 50 DAV
50 DAV is 2,601,000 | $296.76
2.64%
| 3/18/2024 | $188.84 | PP = $292.76 | | MB = $307.40 |  Most Recent Note - 3/21/2024 5:31:18 PM Most Recent Note - 3/21/2024 5:31:18 PM
Y - Hit a new all-time high approaching its "max buy" level with today''s 2nd consecutive gain backed by near average volume. Its 50 DMA line ($271) defines near-term support to watch on pullbacks. Color code was changed to yellow after forming a new flat base noted as a riskier "late stage" base.
>>> FEATURED STOCK ARTICLE : Best Ever Close for Arista Networks - 3/1/2024 | View all notes | Set NEW NOTE alert | Company Profile | SEC News | Chart | Request a new note C A S I | NVO - N
Novo Nordisk ADR
Medical-Ethical Drugs | $129.83 | -0.53
-0.41% | $131.07 | 6,475,020
119.20% of 50 DAV
50 DAV is 5,432,000 | $138.28
-6.11%
| 3/1/2024 | $124.23 | PP = $124.97 | | MB = $131.22 | Most Recent Note - 3/21/2024 1:25:44 PM
G - Managed a "positive reversal" from today's early low. Volume totals have been cooling while stubbornly holding its ground after rallying from a noted new advanced "3-weeks tight" base with big volume-driven gains. Its 50 DMA line ($120) defines near-term support above prior lows in the $118 area.
>>> FEATURED STOCK ARTICLE : Perched at All-Time High After Rallying from Advanced "3-Weeks Tight" - 3/12/2024 | View all notes | Set NEW NOTE alert | Company Profile | SEC News | Chart | Request a new note C A S I | AXON - N
Axon Enterprise
Security/Sfty | $316.05 | +1.77
0.56% | $319.12 | 278,798
56.44% of 50 DAV
50 DAV is 494,000 | $325.63
-2.94%
| 11/8/2023 | $127.84 | PP = $223.30 | | MB = $234.47 | Most Recent Note - 3/20/2024 5:06:33 PM
G - Posted a 4th consecutive small gain today with lighter volume, still hovering near its all-time high. Bullish action came after it reported Dec ''23 quarterly earnings +60% on +29% sales revenues versus the year-ago period. Its 50-day moving average (DMA) line ($276) defines near-term support to watch.
>>> FEATURED STOCK ARTICLE : Hovering Near All-Time High; Spiked Higher Following Earnings - 3/14/2024 | View all notes | Set NEW NOTE alert | Company Profile | SEC News | Chart | Request a new note C A S I | TDG - N
TransDigm Group
Aerospace/Defense | $1,232.38 | +17.40
1.43% | $1,238.34 | 195,154
88.71% of 50 DAV
50 DAV is 220,000 | $1,217.00
1.26%
| 12/12/2023 | $1,000.39 | PP = $1,013.18 | | MB = $1,063.84 | Most Recent Note - 3/20/2024 5:05:42 PM
G - Posted a 3rd consecutive gain today back by light volume, wedging to a new all-time high after 3 weeks of tight closes. Its 50 DMA line ($1,127) defines near-term support to watch.
>>> FEATURED STOCK ARTICLE : Perched in Tight Range Encountering Distribtion Near All-Time High - 3/15/2024 | View all notes | Set NEW NOTE alert | Company Profile | SEC News | Chart | Request a new note C A S I | CRWD - N
CrowdStrike Holdings
Computer Sftwr-Security | $329.46 | +2.59
0.79% | $333.23 | 3,220,309
75.74% of 50 DAV
50 DAV is 4,252,000 | $365.00
-9.74%
| 1/2/2024 | $246.42 | PP = $261.91 | | MB = $275.01 | Most Recent Note - 3/19/2024 11:22:46 AM
G - Pulling back toward its 50 DMA ($308) which recently acted as support. It has not formed a sound base of sufficient length. Fundamentals remain strong after it reported Jan ''24 quarterly earnings +102% on +33% sales revenues versus the year-ago period.
>>> FEATURED STOCK ARTICLE : Encountered Distributional Pressure After Spiking to New High - 3/11/2024 | View all notes | Set NEW NOTE alert | Company Profile | SEC News | Chart | Request a new note C A S I | Symbol/Exchange
Company Name
Industry Group | PRICE | CHANGE
(%Change) | Day High | Volume
(% DAV)
(% 50 day avg vol) | 52 Wk Hi
% From Hi | Featured
Date | Price
Featured | Pivot Featured | | Max Buy | ELF - N
e.l.f. Beauty
Cosmetics/Personal Care | $207.31 | +6.77
3.38% | $209.36 | 1,359,604
87.55% of 50 DAV
50 DAV is 1,553,000 | $221.83
-6.55%
| 1/2/2024 | $138.23 | PP = $153.63 | | MB = $161.31 | Most Recent Note - 3/21/2024 5:33:34 PM
G - Posted a 2nd consecutive gain with below-average volume. It is very extended from any sound base. Its 50 DMA line ($180) defines important near-term support to watch. Fundamentals remain strong.
>>> FEATURED STOCK ARTICLE : Encountering Distributional Pressure Near All-Time High - 3/8/2024 | View all notes | Set NEW NOTE alert | Company Profile | SEC News | Chart | Request a new note C A S I | PCAR - N
Paccar
Trucks and Parts-Hvy Duty | $124.42 | +2.97
2.45% | $124.57 | 2,011,692
85.31% of 50 DAV
50 DAV is 2,358,000 | $121.88
2.08%
| 1/23/2024 | $100.35 | PP = $98.57 | | MB = $103.50 | Most Recent Note - 3/21/2024 5:21:02 PM
G - Hit yet another new all-time high with today's 5th consecutive gain. Its 50 DMA line ($107) defines near-term support to watch on pullbacks. Fundamentals remain strong. See the latest FSU analysis for more details and a new annotated graph.
>>> FEATURED STOCK ARTICLE : Hit New High With 5th Consecutive Gain - 3/21/2024 | View all notes | Set NEW NOTE alert | Company Profile | SEC News | Chart | Request a new note C A S I | HUBB - N
Hubbell
Electrical-Power/Equipmt | $415.00 | +8.35
2.05% | $416.06 | 285,969
65.74% of 50 DAV
50 DAV is 435,000 | $408.08
1.70%
| 1/30/2024 | $343.26 | PP = $336.83 | | MB = $353.67 | Most Recent Note - 3/21/2024 5:23:01 PM
G - Hit another new all-time high with today''s 2nd consecutive gain backed by below-average volume, getting very extended from the previously noted base. Its 50 DMA line ($361.46) defines important support to watch on pullbacks.
>>> FEATURED STOCK ARTICLE : Inched to New Highs With Average Volume - 2/28/2024 | View all notes | Set NEW NOTE alert | Company Profile | SEC News | Chart | Request a new note C A S I | MANH - N
Manhattan Associates
Computer Sftwr-Enterprse | $252.92 | +1.78
0.71% | $254.43 | 318,832
85.25% of 50 DAV
50 DAV is 374,000 | $266.94
-5.25%
| 1/31/2024 | $240.57 | PP = $230.71 | | MB = $242.25 | Most Recent Note - 3/21/2024 5:25:08 PM
G - Posted a 4th straight gain, consolidating above its 50 DMA line ($241) which defines near-term support to watch on pullbacks.
>>> FEATURED STOCK ARTICLE : Hovering Near All-Time High After Streak of Small Gains - 2/29/2024 | View all notes | Set NEW NOTE alert | Company Profile | SEC News | Chart | Request a new note C A S I | USLM - N
U.S. Lime & Minerals
Bldg-Cement/Concrt/Ag | $304.88 | +4.71
1.57% | $307.48 | 35,064
159.38% of 50 DAV
50 DAV is 22,000 | $303.16
0.57%
| 2/9/2024 | $254.68 | PP = $265.09 | | MB = $278.34 | Most Recent Note - 3/21/2024 1:33:22 PM
G - Today's volume-driven gain has it hitting another new all-time high, getting more extended from the previously noted base. Prior highs in the $265-266 area define initial near-term support to watch on pullbacks.
>>> FEATURED STOCK ARTICLE : Hit New All Time High With Light Volume Behind 5th Straight Gain - 3/13/2024 | View all notes | Set NEW NOTE alert | Company Profile | SEC News | Chart | Request a new note C A S I | Symbol/Exchange
Company Name
Industry Group | PRICE | CHANGE
(%Change) | Day High | Volume
(% DAV)
(% 50 day avg vol) | 52 Wk Hi
% From Hi | Featured
Date | Price
Featured | Pivot Featured | | Max Buy | NOW - N
ServiceNow
Computer Sftwr-Enterprse | $773.18 | +5.62
0.73% | $785.88 | 1,255,064
97.75% of 50 DAV
50 DAV is 1,284,000 | $815.32
-5.17%
| 2/22/2024 | $771.75 | PP = $815.32 | | MB = $856.09 | Most Recent Note - 3/20/2024 5:02:22 PM
Y - Rebounded and closed above its 50 DMA line ($763.61) helping its outlook improve with today''s 3rd consecutive gain backed by light volume and its color code is changed to yellow. Prior lows in the $730 area define the next important near-term support to watch. See the latest FSU analysis for more details and a new annotated graph.
>>> FEATURED STOCK ARTICLE : NOW Quietly Rebounded Above 50-Day Moving Average Line - 3/20/2024 | View all notes | Set NEW NOTE alert | Company Profile | SEC News | Chart | Request a new note C A S I | SNPS - N
Synopsys
Computer Sftwr-Design | $602.59 | +12.81
2.17% | $616.54 | 1,756,284
133.97% of 50 DAV
50 DAV is 1,311,000 | $629.38
-4.26%
| 2/22/2024 | $600.65 | PP = $582.85 | | MB = $611.99 | Most Recent Note - 3/21/2024 5:36:29 PM
Y - Posted a 4th consecutive gain today with +38% above-average volume and managed a best-ever close. Found support above its 50 DMA line ($554). Previously noted - " A strong volume-driven gain and close above the pivot point is needed to clinch a proper technical buy signal."
>>> FEATURED STOCK ARTICLE : Rallying From Support at 50-Day Moving Average Line - 3/19/2024 | View all notes | Set NEW NOTE alert | Company Profile | SEC News | Chart | Request a new note C A S I | PAY - N
Paymentus Holdings
Finance-CrdtCard/PmtPr | $23.90 | -0.23
-0.95% | $24.19 | 320,350
104.01% of 50 DAV
50 DAV is 308,000 | $24.99
-4.36%
| 3/5/2024 | $19.97 | PP = $18.89 | | MB = $19.83 | Most Recent Note - 3/20/2024 12:44:21 PM
G - Posting a volume-driven gain today rebounding near its 52-week high. Very extended from the previously noted base. Prior highs in the $18 range define important initial support to watch on pullbacks.
>>> FEATURED STOCK ARTICLE : Big Gap Up Gain Triggered Technical Buy Signal - 3/5/2024 | View all notes | Set NEW NOTE alert | Company Profile | SEC News | Chart | Request a new note C A S I |
|
|
|
Color Codes Explained :
Y - Better candidates highlighted by our
staff of experts.
G - Previously featured
in past reports as yellow but may no longer be buyable under the
guidelines.
***Last / Change / Volume data in this table is the closing quote data***
Symbol/Exchange
Company Name
Industry Group |
PRICE |
CHANGE
(%Change) |
Day High |
Volume
(% DAV)
(% 50 day avg vol) |
52 Wk Hi
% From Hi |
Featured
Date |
Price
Featured |
Pivot Featured |
|
Max Buy |
 ANET
-
N
ANET
-
N
Arista Networks
Computer-Networking
|
$304.00
|
+7.42
2.50% |
$304.34
|
1,144,115
43.99% of 50 DAV
50 DAV is 2,601,000
|
$296.76
2.44%
|
3/18/2024
|
$188.84
|
PP = $292.76
|
|
MB = $307.40
|
Most Recent Note - 3/19/2024 12:08:07 PM
Y - Slumping toward its 50 DMA line after a gap down today, abruptly retreating following a solid volume-driven gain on the prior session for a best-ever close. Color code was changed to yellow after forming a new flat base. Found support at its 50 DMA line ($268.66) during its ongoing ascent. Recently noted with caution - "It may be considered a riskier late-stage base, however, a gain above the pivot point backed by at least +80% above average volume may trigger a new technical buy signal."
>>> FEATURED STOCK ARTICLE : Best Ever Close for Arista Networks - 3/1/2024 |
View all notes |
Set NEW NOTE alert |
Company Profile |
SEC
News |
Chart |
Request a new note
C
A
S
I |
NVO
-
N
Novo Nordisk ADR
Medical-Ethical Drugs
|
$130.68
|
+0.32
0.25% |
$130.82
|
4,272,379
78.65% of 50 DAV
50 DAV is 5,432,000
|
$138.28
-5.50%
|
3/1/2024
|
$124.23
|
PP = $124.97
|
|
MB = $131.22
|
 Most Recent Note - 3/21/2024 1:25:44 PM
G - Managed a "positive reversal" from today's early low. Volume totals have been cooling while stubbornly holding its ground after rallying from a noted new advanced "3-weeks tight" base with big volume-driven gains. Its 50 DMA line ($120) defines near-term support above prior lows in the $118 area.
>>> FEATURED STOCK ARTICLE : Perched at All-Time High After Rallying from Advanced "3-Weeks Tight" - 3/12/2024 |
View all notes |
Set NEW NOTE alert |
Company Profile |
SEC
News |
Chart |
Request a new note
C
A
S
I |
AXON
-
N
Axon Enterprise
Security/Sfty
|
$316.98
|
+2.70
0.86% |
$319.12
|
92,056
18.63% of 50 DAV
50 DAV is 494,000
|
$325.63
-2.66%
|
11/8/2023
|
$127.84
|
PP = $223.30
|
|
MB = $234.47
|
Most Recent Note - 3/20/2024 5:06:33 PM
G - Posted a 4th consecutive small gain today with lighter volume, still hovering near its all-time high. Bullish action came after it reported Dec '23 quarterly earnings +60% on +29% sales revenues versus the year-ago period. Its 50-day moving average (DMA) line ($276) defines near-term support to watch.
>>> FEATURED STOCK ARTICLE : Hovering Near All-Time High; Spiked Higher Following Earnings - 3/14/2024 |
View all notes |
Set NEW NOTE alert |
Company Profile |
SEC
News |
Chart |
Request a new note
C
A
S
I |
TDG
-
N
TransDigm Group
Aerospace/Defense
|
$1,226.73
|
+11.75
0.97% |
$1,232.28
|
56,175
25.53% of 50 DAV
50 DAV is 220,000
|
$1,217.00
0.80%
|
12/12/2023
|
$1,000.39
|
PP = $1,013.18
|
|
MB = $1,063.84
|
Most Recent Note - 3/20/2024 5:05:42 PM
G - Posted a 3rd consecutive gain today back by light volume, wedging to a new all-time high after 3 weeks of tight closes. Its 50 DMA line ($1,127) defines near-term support to watch.
>>> FEATURED STOCK ARTICLE : Perched in Tight Range Encountering Distribtion Near All-Time High - 3/15/2024 |
View all notes |
Set NEW NOTE alert |
Company Profile |
SEC
News |
Chart |
Request a new note
C
A
S
I |
CRWD
-
N
CrowdStrike Holdings
Computer Sftwr-Security
|
$330.63
|
+3.76
1.15% |
$333.23
|
1,889,399
44.44% of 50 DAV
50 DAV is 4,252,000
|
$365.00
-9.42%
|
1/2/2024
|
$246.42
|
PP = $261.91
|
|
MB = $275.01
|
Most Recent Note - 3/19/2024 11:22:46 AM
G - Pulling back toward its 50 DMA ($308) which recently acted as support. It has not formed a sound base of sufficient length. Fundamentals remain strong after it reported Jan '24 quarterly earnings +102% on +33% sales revenues versus the year-ago period.
>>> FEATURED STOCK ARTICLE : Encountered Distributional Pressure After Spiking to New High - 3/11/2024 |
View all notes |
Set NEW NOTE alert |
Company Profile |
SEC
News |
Chart |
Request a new note
C
A
S
I |
Symbol/Exchange
Company Name
Industry Group |
PRICE |
CHANGE
(%Change) |
Day High |
Volume
(% DAV)
(% 50 day avg vol) |
52 Wk Hi
% From Hi |
Featured
Date |
Price
Featured |
Pivot Featured |
|
Max Buy |
ELF
-
N
e.l.f. Beauty
Cosmetics/Personal Care
|
$203.92
|
+3.38
1.69% |
$204.50
|
427,167
27.51% of 50 DAV
50 DAV is 1,553,000
|
$221.83
-8.07%
|
1/2/2024
|
$138.23
|
PP = $153.63
|
|
MB = $161.31
|
Most Recent Note - 3/19/2024 11:21:25 AM
G - Gapped down today, on track for a 4th consecutive loss after getting very extended from any sound base. Its 50 DMA line ($177.69) defines important near-term support to watch. Fundamentals remain strong.
>>> FEATURED STOCK ARTICLE : Encountering Distributional Pressure Near All-Time High - 3/8/2024 |
View all notes |
Set NEW NOTE alert |
Company Profile |
SEC
News |
Chart |
Request a new note
C
A
S
I |
PCAR
-
N
Paccar
Trucks and Parts-Hvy Duty
|
$124.02
|
+2.57
2.11% |
$124.08
|
646,115
27.40% of 50 DAV
50 DAV is 2,358,000
|
$121.88
1.75%
|
1/23/2024
|
$100.35
|
PP = $98.57
|
|
MB = $103.50
|
Most Recent Note - 3/20/2024 5:03:43 PM
G - Hit yet another new all-time high with today's 4th consecutive gain. Its 50 DMA line ($106.73) defines near-term support to watch on pullbacks. Fundamentals remain strong.
>>> FEATURED STOCK ARTICLE : Extended From Any Sound Base After 7 Weekly Gains - 2/26/2024 |
View all notes |
Set NEW NOTE alert |
Company Profile |
SEC
News |
Chart |
Request a new note
C
A
S
I |
HUBB
-
N
Hubbell
Electrical-Power/Equipmt
|
$413.49
|
+6.84
1.68% |
$414.73
|
57,998
13.33% of 50 DAV
50 DAV is 435,000
|
$408.08
1.33%
|
1/30/2024
|
$343.26
|
PP = $336.83
|
|
MB = $353.67
|
Most Recent Note - 3/18/2024 5:07:24 PM
G - Perched at its all-time high, very extended from the previously noted base. Its 50 DMA line ($356.47) defines important support to watch on pullbacks.
>>> FEATURED STOCK ARTICLE : Inched to New Highs With Average Volume - 2/28/2024 |
View all notes |
Set NEW NOTE alert |
Company Profile |
SEC
News |
Chart |
Request a new note
C
A
S
I |
MANH
-
N
Manhattan Associates
Computer Sftwr-Enterprse
|
$252.56
|
+1.42
0.57% |
$254.43
|
79,105
21.15% of 50 DAV
50 DAV is 374,000
|
$266.94
-5.39%
|
1/31/2024
|
$240.57
|
PP = $230.71
|
|
MB = $242.25
|
Most Recent Note - 3/18/2024 5:08:57 PM
G - Halted its slide with a small gain today on light volume following 3 straight losses marked by above-average volume. It is extended from the previously noted base. Its 50 DMA line ($238) defines near-term support to watch above prior highs in the $230 area.
>>> FEATURED STOCK ARTICLE : Hovering Near All-Time High After Streak of Small Gains - 2/29/2024 |
View all notes |
Set NEW NOTE alert |
Company Profile |
SEC
News |
Chart |
Request a new note
C
A
S
I |
USLM
-
N
U.S. Lime & Minerals
Bldg-Cement/Concrt/Ag
|
$305.58
|
+5.41
1.80% |
$307.48
|
23,778
108.08% of 50 DAV
50 DAV is 22,000
|
$303.16
0.80%
|
2/9/2024
|
$254.68
|
PP = $265.09
|
|
MB = $278.34
|
Most Recent Note - 3/21/2024 1:33:22 PM
G - Today's volume-driven gain has it hitting another new all-time high, getting more extended from the previously noted base. Prior highs in the $265-266 area define initial near-term support to watch on pullbacks.
>>> FEATURED STOCK ARTICLE : Hit New All Time High With Light Volume Behind 5th Straight Gain - 3/13/2024 |
View all notes |
Set NEW NOTE alert |
Company Profile |
SEC
News |
Chart |
Request a new note
C
A
S
I |
Symbol/Exchange
Company Name
Industry Group |
PRICE |
CHANGE
(%Change) |
Day High |
Volume
(% DAV)
(% 50 day avg vol) |
52 Wk Hi
% From Hi |
Featured
Date |
Price
Featured |
Pivot Featured |
|
Max Buy |
NOW
-
N
ServiceNow
Computer Sftwr-Enterprse
|
$779.06
|
+11.50
1.50% |
$785.04
|
501,270
39.04% of 50 DAV
50 DAV is 1,284,000
|
$815.32
-4.45%
|
2/22/2024
|
$771.75
|
PP = $815.32
|
|
MB = $856.09
|
Most Recent Note - 3/20/2024 5:02:22 PM
Y - Rebounded and closed above its 50 DMA line ($763.61) helping its outlook improve with today's 3rd consecutive gain backed by light volume and its color code is changed to yellow. Prior lows in the $730 area define the next important near-term support to watch. See the latest FSU analysis for more details and a new annotated graph.
>>> FEATURED STOCK ARTICLE : NOW Quietly Rebounded Above 50-Day Moving Average Line - 3/20/2024 |
View all notes |
Set NEW NOTE alert |
Company Profile |
SEC
News |
Chart |
Request a new note
C
A
S
I |
SNPS
-
N
Synopsys
Computer Sftwr-Design
|
$609.99
|
+20.21
3.43% |
$610.28
|
570,854
43.54% of 50 DAV
50 DAV is 1,311,000
|
$629.38
-3.08%
|
2/22/2024
|
$600.65
|
PP = $582.85
|
|
MB = $611.99
|
Most Recent Note - 3/19/2024 6:57:33 PM
Y - Posted a big gain today with +14% above-average volume, finding support above its 50 DMA line ($550). Volume totals had cooled in recent weeks while consolidating. Previously noted - " A strong volume-driven gain and close above the pivot point is needed to clinch a proper technical buy signal. See the latest FSU analysis for more details and a new annotated graph.
>>> FEATURED STOCK ARTICLE : Rallying From Support at 50-Day Moving Average Line - 3/19/2024 |
View all notes |
Set NEW NOTE alert |
Company Profile |
SEC
News |
Chart |
Request a new note
C
A
S
I |
PAY
-
N
Paymentus Holdings
Finance-CrdtCard/PmtPr
|
$23.70
|
-0.43
-1.78% |
$24.19
|
98,037
31.83% of 50 DAV
50 DAV is 308,000
|
$24.99
-5.16%
|
3/5/2024
|
$19.97
|
PP = $18.89
|
|
MB = $19.83
|
Most Recent Note - 3/20/2024 12:44:21 PM
G - Posting a volume-driven gain today rebounding near its 52-week high. Very extended from the previously noted base. Prior highs in the $18 range define important initial support to watch on pullbacks.
>>> FEATURED STOCK ARTICLE : Big Gap Up Gain Triggered Technical Buy Signal - 3/5/2024 |
View all notes |
Set NEW NOTE alert |
Company Profile |
SEC
News |
Chart |
Request a new note
C
A
S
I |
|
|
|
THESE ARE NOT BUY RECOMMENDATIONS!
Comments contained in the body of this report are technical
opinions only. The material herein has been obtained
from sources believed to be reliable and accurate, however,
its accuracy and completeness cannot be guaranteed.
This site is not an investment advisor, hence it does
not endorse or recommend any securities or other investments.
Any recommendation contained in this report may not
be suitable for all investors and it is not to be deemed
an offer or solicitation on our part with respect to
the purchase or sale of any securities. All trademarks,
service marks and trade names appearing in this report
are the property of their respective owners, and are
likewise used for identification purposes only.
This report is a service available
only to active Paid Premium Members.
You may opt-out of receiving report notifications
at any time. Questions or comments may be submitted
by writing to Premium Membership Services 665 S.E. 10 Street, Suite 201 Deerfield Beach, FL 33441-5634 or by calling 1-800-965-8307
or 954-785-1121.
|
|
|