You are not logged in.
This means you
CAN ONLY VIEW reports that were published prior to Tuesday, July 9, 2024.
You
MUST UPGRADE YOUR MEMBERSHIP if you want to see any current reports.
AFTER MARKET UPDATE - WEDNESDAY, MARCH 20TH, 2024
Previous After Market Report Next After Market Report >>>
|
|
|
|
DOW |
+401.37 |
39,512.13 |
+1.03% |
|
Volume |
959,149,498 |
-12% |
|
Volume |
5,423,047,200 |
+12% |
|
NASDAQ |
+202.62 |
16,369.41 |
+1.25% |
|
Advancers |
2,136 |
78% |
|
Advancers |
3,161 |
74% |
|
S&P 500 |
+46.11 |
5,224.62 |
+0.89% |
|
Decliners |
606 |
22% |
|
Decliners |
1,108 |
26% |
|
Russell 2000 |
+39.17 |
2,074.88 |
+1.92% |
|
52 Wk Highs |
269 |
|
|
52 Wk Highs |
219 |
|
|
S&P 600 |
+21.33 |
1,312.59 |
+1.65% |
|
52 Wk Lows |
30 |
|
|
52 Wk Lows |
99 |
|
|
 |
Breadth Positive and Leadership Improved as Indices Hit New Records
Kenneth J. Gruneisen - Passed the CAN SLIM® Master's Exam
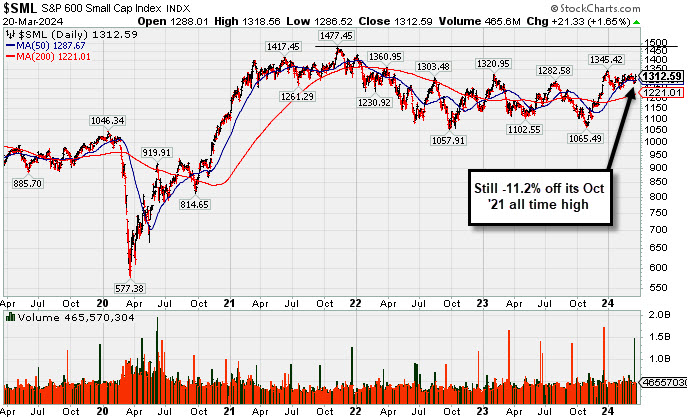
The major indices hit fresh record highs as the S&P 500 closed above 5,200 for the first time, the Dow Jones Industrial Average jumped 400 points, and the Nasdaq Composite gained 1.3%. Volume reported was mixed, lighter that the prior session total on the NYSE and higher on the Nasdaq exchange. Breadth was clearly positive as advancers led decliners by more than a 3-1 margin on the NYSE and by nearly a 3-1 margin on the Nasdaq exchange. Leadership expanded as there were 109 high-ranked companies from the Leaders List that hit new 52-week highs and were listed on the BreakOuts Page, versus the total of 66 on the prior session. New 52-week highs totals expanded and solidly outnumbered shrinking new 52-week lows totals on the NYSE and on the Nasdaq exchange. The major indices are in a confirmed uptrend (M criteria). New buying efforts should be only made in stocks fitting all key criteria of the fact-based investment system.
PICTURED: The S&P 600 Small Cap Index is still -11.2% off its October 2021 all time high.
The FOMC voted unanimously to leave the target range for the fed funds rate unchanged at 5.25-5.50%. The market's favorable reaction was believed to be more in response to the dot plot included in the updated Summary of Economic Projections (SEP). The Fed still anticipates three rate cuts this year, despite recent inflation data that has been hotter than expected. The 2-yr note yield dropped eight basis points to 4.61% and the 10-yr note yield declined two basis points to 4.27%.
Nine of the 11 S&P 500 sectors closed higher and six of them rose at least +1.0%. The consumer discretionary sector logged the largest gain, up +1.5%, followed by the communication services sector up +1.3%.
|
 Kenneth J. Gruneisen started out as a licensed stockbroker in August 1987, a couple of months prior to the historic stock market crash that took the Dow Jones Industrial Average down -22.6% in a single day. He has published daily fact-based fundamental and technical analysis on high-ranked stocks online for two decades. Through FACTBASEDINVESTING.COM, Kenneth provides educational articles, news, market commentary, and other information regarding proven investment systems that work in good times and bad.
Comments contained in the body of this report are technical opinions only and are not necessarily those of Gruneisen Growth Corp. The material herein has been obtained from sources believed to be reliable and accurate, however, its accuracy and completeness cannot be guaranteed. Our firm, employees, and customers may effect transactions, including transactions contrary to any recommendation herein, or have positions in the securities mentioned herein or options with respect thereto. Any recommendation contained in this report may not be suitable for all investors and it is not to be deemed an offer or solicitation on our part with respect to the purchase or sale of any securities. |
|
 |
Financial, Retail, Tech, and Commodity-Linked Groups Rose
Kenneth J. Gruneisen - Passed the CAN SLIM® Master's Exam
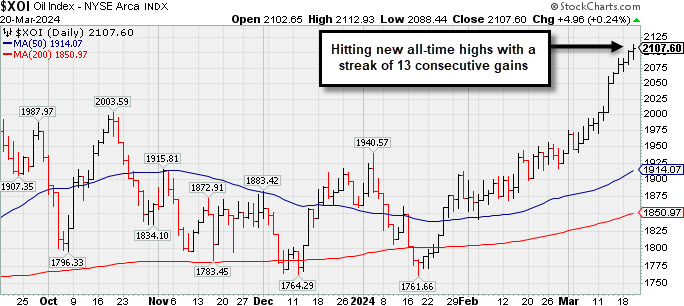
The Retail Index ($RLX +1.19%), Bank Index ($BKX +2.38%), and the Broker/Dealer Index ($XBD +1.91%) posted influential gains. Commodity-linked groups were led by the Gold & Silver Index ($XAU +3.85%) while energy-linked groups rose mor modestly as the Oil Services Index ($OSX +0.44%) and the Integrated Oil Index ($XOI +0.24%) both edged higher. The tech sector was led by the Semiconductor Index ($SOX +1.60%) and the Networking Index ($NWX +2.17%) while the Biotech Index ($BTK +0.06%)finished flat.
![]() PICTURED: The Integrated Oil Index ($XOI +0.24%) posted a 13th consecutive gain while hitting new all-time highs.
| Oil Services |
$OSX |
89.92 |
+0.49 |
+0.54% |
+7.20% |
| Integrated Oil |
$XOI |
2,112.23 |
+9.58 |
+0.46% |
+13.41% |
| Semiconductor |
$SOX |
4,774.99 |
+62.18 |
+1.32% |
+14.36% |
| Networking |
$NWX |
794.50 |
+14.90 |
+1.91% |
-4.60% |
| Broker/Dealer |
$XBD |
598.36 |
+10.66 |
+1.81% |
+7.37% |
| Retail |
$RLX |
4,464.04 |
+48.36 |
+1.10% |
+14.79% |
| Gold & Silver |
$XAU |
121.65 |
+4.82 |
+4.12% |
-3.22% |
| Bank |
$BKX |
100.93 |
+2.20 |
+2.23% |
+5.11% |
| Biotech |
$BTK |
5,239.29 |
-10.15 |
-0.19% |
-3.31% |
|
|
|
 |
NOW Quietly Rebounded Above 50-Day Moving Average Line
Kenneth J. Gruneisen - Passed the CAN SLIM® Master's Exam
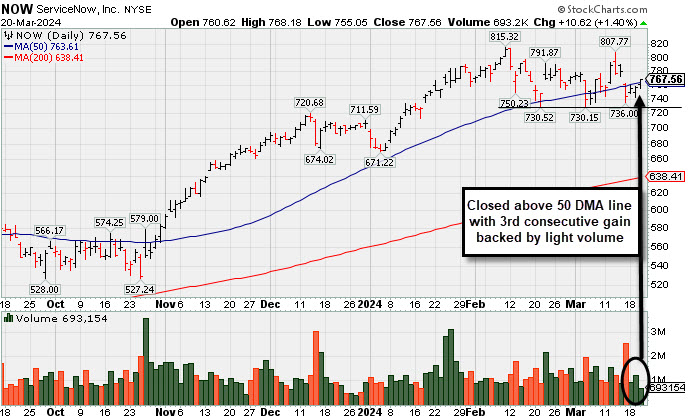
ServiceNow Inc (NOW +$9.97 or +1.32% to $766.91) rebounded and closed back above its 50-day moving average (DMA) line with light volume behind today's 3rd consecutive gain. It found support above prior lows in the $730 area. It faces some near-term resistance due to overhead supply up to the $815 level.
The Computer Software - Enterprise group is currently ranked 41st on the 197 Industry Groups list with a Group Relative Strength Rating of A- (79). NOW was highlighted in yellow in the 2/22/24 mid-day report (read here). It was last shown in this FSU section on 2/23/24 with an annotated graph under the headline, "Found Support With a Solid Gap Up from 10-Week Moving Average".
NOW has a 99 Earnings Per Share Rating. It reported Dec '23 quarterly earnings +36% on +26% sales revenues versus the year-ago period, its 6th quarterly comparison above the +25% minimum guideline (C criteria) of the fact-based investment system. Annual earnings growth has been strong and steady.
The number of top-rated funds owning its shares rose from 3,287 in Mar '23 to 3,739 in Dec '23, a reassuring sign concerning the I criteria. It has a Timeliness Rating of A and a Sponsorship Rating of B. Its current Up/Down Volume Ratio of 1.8 is an unbiased indication its shares have been under slight accumulation over the past 50 days. Charts courtesy www.stockcharts.com
Symbol/Exchange
Company Name
Industry Group | PRICE | CHANGE
(%Change) | Day High | Volume
(% DAV)
(% 50 day avg vol) | 52 Wk Hi
% From Hi | Featured
Date | Price
Featured | Pivot Featured | | Max Buy |  ANET - N ANET - N
Arista Networks
Computer-Networking | $296.58 | +9.66
3.37% | $296.76 | 3,276,200
127.03% of 50 DAV
50 DAV is 2,579,000 | $292.66
1.34%
| 3/18/2024 | $188.84 | PP = $292.76 | | MB = $307.40 | Most Recent Note - 3/19/2024 12:08:07 PM
Y - Slumping toward its 50 DMA line after a gap down today, abruptly retreating following a solid volume-driven gain on the prior session for a best-ever close. Color code was changed to yellow after forming a new flat base. Found support at its 50 DMA line ($268.66) during its ongoing ascent. Recently noted with caution - "It may be considered a riskier late-stage base, however, a gain above the pivot point backed by at least +80% above average volume may trigger a new technical buy signal."
>>> FEATURED STOCK ARTICLE : Best Ever Close for Arista Networks - 3/1/2024 | View all notes | Set NEW NOTE alert | Company Profile | SEC News | Chart | Request a new note C A S I | NVO - N
Novo Nordisk ADR
Medical-Ethical Drugs | $130.36 | -1.01
-0.77% | $131.43 | 4,374,691
81.00% of 50 DAV
50 DAV is 5,401,000 | $138.28
-5.73%
| 3/1/2024 | $124.23 | PP = $124.97 | | MB = $131.22 | Most Recent Note - 3/19/2024 11:24:40 AM
G - Volume totals have been cooling while stubbornly holding its ground after rallying from a noted new advanced "3-weeks tight" base with big volume-driven gains. Recent lows in the $118 area define important support to watch coinciding with its 50 DMA line ($118.76).
>>> FEATURED STOCK ARTICLE : Perched at All-Time High After Rallying from Advanced "3-Weeks Tight" - 3/12/2024 | View all notes | Set NEW NOTE alert | Company Profile | SEC News | Chart | Request a new note C A S I | AXON - N
Axon Enterprise
Security/Sfty | $314.35 | +2.22
0.71% | $314.51 | 298,448
60.29% of 50 DAV
50 DAV is 495,000 | $325.63
-3.46%
| 11/8/2023 | $127.84 | PP = $223.30 | | MB = $234.47 |  Most Recent Note - 3/20/2024 5:06:33 PM Most Recent Note - 3/20/2024 5:06:33 PM
G - Posted a 4th consecutive small gain today with lighter volume, still hovering near its all-time high. Bullish action came after it reported Dec ''23 quarterly earnings +60% on +29% sales revenues versus the year-ago period. Its 50-day moving average (DMA) line ($276) defines near-term support to watch.
>>> FEATURED STOCK ARTICLE : Hovering Near All-Time High; Spiked Higher Following Earnings - 3/14/2024 | View all notes | Set NEW NOTE alert | Company Profile | SEC News | Chart | Request a new note C A S I | TDG - N
TransDigm Group
Aerospace/Defense | $1,214.98 | +14.06
1.17% | $1,217.00 | 203,293
91.99% of 50 DAV
50 DAV is 221,000 | $1,207.58
0.61%
| 12/12/2023 | $1,000.39 | PP = $1,013.18 | | MB = $1,063.84 | Most Recent Note - 3/20/2024 5:05:42 PM
G - Posted a 3rd consecutive gain today back by light volume, wedging to a new all-time high after 3 weeks of tight closes. Its 50 DMA line ($1,127) defines near-term support to watch.
>>> FEATURED STOCK ARTICLE : Perched in Tight Range Encountering Distribtion Near All-Time High - 3/15/2024 | View all notes | Set NEW NOTE alert | Company Profile | SEC News | Chart | Request a new note C A S I | CRWD - N
CrowdStrike Holdings
Computer Sftwr-Security | $326.87 | +6.01
1.87% | $328.47 | 2,505,474
58.53% of 50 DAV
50 DAV is 4,281,000 | $365.00
-10.45%
| 1/2/2024 | $246.42 | PP = $261.91 | | MB = $275.01 | Most Recent Note - 3/19/2024 11:22:46 AM
G - Pulling back toward its 50 DMA ($308) which recently acted as support. It has not formed a sound base of sufficient length. Fundamentals remain strong after it reported Jan ''24 quarterly earnings +102% on +33% sales revenues versus the year-ago period.
>>> FEATURED STOCK ARTICLE : Encountered Distributional Pressure After Spiking to New High - 3/11/2024 | View all notes | Set NEW NOTE alert | Company Profile | SEC News | Chart | Request a new note C A S I | Symbol/Exchange
Company Name
Industry Group | PRICE | CHANGE
(%Change) | Day High | Volume
(% DAV)
(% 50 day avg vol) | 52 Wk Hi
% From Hi | Featured
Date | Price
Featured | Pivot Featured | | Max Buy | ELF - N
e.l.f. Beauty
Cosmetics/Personal Care | $200.54 | +9.87
5.18% | $201.41 | 1,091,304
69.78% of 50 DAV
50 DAV is 1,564,000 | $221.83
-9.60%
| 1/2/2024 | $138.23 | PP = $153.63 | | MB = $161.31 | Most Recent Note - 3/19/2024 11:21:25 AM
G - Gapped down today, on track for a 4th consecutive loss after getting very extended from any sound base. Its 50 DMA line ($177.69) defines important near-term support to watch. Fundamentals remain strong.
>>> FEATURED STOCK ARTICLE : Encountering Distributional Pressure Near All-Time High - 3/8/2024 | View all notes | Set NEW NOTE alert | Company Profile | SEC News | Chart | Request a new note C A S I | PCAR - N
Paccar
Trucks and Parts-Hvy Duty | $121.42 | +0.42
0.35% | $121.88 | 2,534,448
107.67% of 50 DAV
50 DAV is 2,354,000 | $121.23
0.16%
| 1/23/2024 | $100.35 | PP = $98.57 | | MB = $103.50 | Most Recent Note - 3/20/2024 5:03:43 PM
G - Hit yet another new all-time high with today's 4th consecutive gain. Its 50 DMA line ($106.73) defines near-term support to watch on pullbacks. Fundamentals remain strong.
>>> FEATURED STOCK ARTICLE : Extended From Any Sound Base After 7 Weekly Gains - 2/26/2024 | View all notes | Set NEW NOTE alert | Company Profile | SEC News | Chart | Request a new note C A S I | HUBB - N
Hubbell
Electrical-Power/Equipmt | $406.65 | +9.94
2.51% | $408.08 | 388,419
89.70% of 50 DAV
50 DAV is 433,000 | $404.15
0.62%
| 1/30/2024 | $343.26 | PP = $336.83 | | MB = $353.67 | Most Recent Note - 3/18/2024 5:07:24 PM
G - Perched at its all-time high, very extended from the previously noted base. Its 50 DMA line ($356.47) defines important support to watch on pullbacks.
>>> FEATURED STOCK ARTICLE : Inched to New Highs With Average Volume - 2/28/2024 | View all notes | Set NEW NOTE alert | Company Profile | SEC News | Chart | Request a new note C A S I | MANH - N
Manhattan Associates
Computer Sftwr-Enterprse | $251.14 | +3.54
1.43% | $251.30 | 433,785
116.61% of 50 DAV
50 DAV is 372,000 | $266.94
-5.92%
| 1/31/2024 | $240.57 | PP = $230.71 | | MB = $242.25 | Most Recent Note - 3/18/2024 5:08:57 PM
G - Halted its slide with a small gain today on light volume following 3 straight losses marked by above-average volume. It is extended from the previously noted base. Its 50 DMA line ($238) defines near-term support to watch above prior highs in the $230 area.
>>> FEATURED STOCK ARTICLE : Hovering Near All-Time High After Streak of Small Gains - 2/29/2024 | View all notes | Set NEW NOTE alert | Company Profile | SEC News | Chart | Request a new note C A S I | USLM - N
U.S. Lime & Minerals
Bldg-Cement/Concrt/Ag | $300.26 | -0.97
-0.32% | $303.16 | 20,422
92.83% of 50 DAV
50 DAV is 22,000 | $302.72
-0.81%
| 2/9/2024 | $254.68 | PP = $265.09 | | MB = $278.34 | Most Recent Note - 3/19/2024 6:59:14 PM
G - Big gain today for a new all-time high was backed by +55% above average volume, getting more extended from the previously noted base. Prior highs in the $265-266 area define initial near-term support to watch on pullbacks.
>>> FEATURED STOCK ARTICLE : Hit New All Time High With Light Volume Behind 5th Straight Gain - 3/13/2024 | View all notes | Set NEW NOTE alert | Company Profile | SEC News | Chart | Request a new note C A S I | Symbol/Exchange
Company Name
Industry Group | PRICE | CHANGE
(%Change) | Day High | Volume
(% DAV)
(% 50 day avg vol) | 52 Wk Hi
% From Hi | Featured
Date | Price
Featured | Pivot Featured | | Max Buy | NOW - N
ServiceNow
Computer Sftwr-Enterprse | $767.56 | +10.62
1.40% | $768.18 | 698,118
53.95% of 50 DAV
50 DAV is 1,294,000 | $815.32
-5.86%
| 2/22/2024 | $771.75 | PP = $815.32 | | MB = $856.09 | Most Recent Note - 3/20/2024 5:02:22 PM
Y - Rebounded and closed above its 50 DMA line ($763.61) helping its outlook improve with today''s 3rd consecutive gain backed by light volume and its color code is changed to yellow. Prior lows in the $730 area define the next important near-term support to watch. See the latest FSU analysis for more details and a new annotated graph.
>>> FEATURED STOCK ARTICLE : NOW Quietly Rebounded Above 50-Day Moving Average Line - 3/20/2024 | View all notes | Set NEW NOTE alert | Company Profile | SEC News | Chart | Request a new note C A S I | SNPS - N
Synopsys
Computer Sftwr-Design | $590.03 | +5.32
0.91% | $598.00 | 1,129,091
85.21% of 50 DAV
50 DAV is 1,325,000 | $629.38
-6.25%
| 2/22/2024 | $600.65 | PP = $582.85 | | MB = $611.99 | Most Recent Note - 3/19/2024 6:57:33 PM
Y - Posted a big gain today with +14% above-average volume, finding support above its 50 DMA line ($550). Volume totals had cooled in recent weeks while consolidating. Previously noted - " A strong volume-driven gain and close above the pivot point is needed to clinch a proper technical buy signal. See the latest FSU analysis for more details and a new annotated graph.
>>> FEATURED STOCK ARTICLE : Rallying From Support at 50-Day Moving Average Line - 3/19/2024 | View all notes | Set NEW NOTE alert | Company Profile | SEC News | Chart | Request a new note C A S I | PAY - N
Paymentus Holdings
Finance-CrdtCard/PmtPr | $24.13 | +1.74
7.77% | $24.39 | 616,246
207.49% of 50 DAV
50 DAV is 297,000 | $24.99
-3.44%
| 3/5/2024 | $19.97 | PP = $18.89 | | MB = $19.83 | Most Recent Note - 3/20/2024 12:44:21 PM
G - Posting a volume-driven gain today rebounding near its 52-week high. Very extended from the previously noted base. Prior highs in the $18 range define important initial support to watch on pullbacks.
>>> FEATURED STOCK ARTICLE : Big Gap Up Gain Triggered Technical Buy Signal - 3/5/2024 | View all notes | Set NEW NOTE alert | Company Profile | SEC News | Chart | Request a new note C A S I |
|
|
|
Color Codes Explained :
Y - Better candidates highlighted by our
staff of experts.
G - Previously featured
in past reports as yellow but may no longer be buyable under the
guidelines.
***Last / Change / Volume data in this table is the closing quote data***
Symbol/Exchange
Company Name
Industry Group |
PRICE |
CHANGE
(%Change) |
Day High |
Volume
(% DAV)
(% 50 day avg vol) |
52 Wk Hi
% From Hi |
Featured
Date |
Price
Featured |
Pivot Featured |
|
Max Buy |
 ANET
-
N
ANET
-
N
Arista Networks
Computer-Networking
|
$286.92
|
-2.40
-0.83% |
$288.24
|
5,269,589
210.95% of 50 DAV
50 DAV is 2,498,000
|
$292.66
-1.96%
|
3/18/2024
|
$188.84
|
PP = $292.76
|
|
MB = $307.40
|
 Most Recent Note - 3/19/2024 12:08:07 PM
Y - Slumping toward its 50 DMA line after a gap down today, abruptly retreating following a solid volume-driven gain on the prior session for a best-ever close. Color code was changed to yellow after forming a new flat base. Found support at its 50 DMA line ($268.66) during its ongoing ascent. Recently noted with caution - "It may be considered a riskier late-stage base, however, a gain above the pivot point backed by at least +80% above average volume may trigger a new technical buy signal."
>>> FEATURED STOCK ARTICLE : Best Ever Close for Arista Networks - 3/1/2024 |
View all notes |
Set NEW NOTE alert |
Company Profile |
SEC
News |
Chart |
Request a new note
C
A
S
I |
NVO
-
N
Novo Nordisk ADR
Medical-Ethical Drugs
|
$131.37
|
-1.52
-1.14% |
$132.21
|
4,388,749
81.38% of 50 DAV
50 DAV is 5,393,000
|
$138.28
-5.00%
|
3/1/2024
|
$124.23
|
PP = $124.97
|
|
MB = $131.22
|
Most Recent Note - 3/19/2024 11:24:40 AM
G - Volume totals have been cooling while stubbornly holding its ground after rallying from a noted new advanced "3-weeks tight" base with big volume-driven gains. Recent lows in the $118 area define important support to watch coinciding with its 50 DMA line ($118.76).
>>> FEATURED STOCK ARTICLE : Perched at All-Time High After Rallying from Advanced "3-Weeks Tight" - 3/12/2024 |
View all notes |
Set NEW NOTE alert |
Company Profile |
SEC
News |
Chart |
Request a new note
C
A
S
I |
AXON
-
N
Axon Enterprise
Security/Sfty
|
$312.12
|
+3.67
1.19% |
$312.91
|
410,657
82.96% of 50 DAV
50 DAV is 495,000
|
$325.63
-4.15%
|
11/8/2023
|
$127.84
|
PP = $223.30
|
|
MB = $234.47
|
Most Recent Note - 3/15/2024 7:26:16 PM
G - Posted a small gain today with heavy volume, still hovering near its all-time high. Bullish action came after it reported Dec '23 quarterly earnings +60% on +29% sales revenues versus the year-ago period. Its 50-day moving average (DMA) line ($272) defines near-term support to watch. See the latest FSU analysis for more details and an annotated graph.
>>> FEATURED STOCK ARTICLE : Hovering Near All-Time High; Spiked Higher Following Earnings - 3/14/2024 |
View all notes |
Set NEW NOTE alert |
Company Profile |
SEC
News |
Chart |
Request a new note
C
A
S
I |
TDG
-
N
TransDigm Group
Aerospace/Defense
|
$1,200.92
|
+19.92
1.69% |
$1,202.70
|
174,657
78.67% of 50 DAV
50 DAV is 222,000
|
$1,207.58
-0.55%
|
12/12/2023
|
$1,000.39
|
PP = $1,013.18
|
|
MB = $1,063.84
|
Most Recent Note - 3/15/2024 7:19:54 PM
G - Pulled back with higher volume yet remains perched near its all-time high after 3 weeks of tight closes. Its 50 DMA line ($1,114) defines near-term support to watch. See the latest FSU analysis for more details and a new annotated graph.
>>> FEATURED STOCK ARTICLE : Perched in Tight Range Encountering Distribtion Near All-Time High - 3/15/2024 |
View all notes |
Set NEW NOTE alert |
Company Profile |
SEC
News |
Chart |
Request a new note
C
A
S
I |
CRWD
-
N
CrowdStrike Holdings
Computer Sftwr-Security
|
$320.85
|
-0.21
-0.07% |
$321.48
|
2,924,594
68.48% of 50 DAV
50 DAV is 4,271,000
|
$365.00
-12.10%
|
1/2/2024
|
$246.42
|
PP = $261.91
|
|
MB = $275.01
|
Most Recent Note - 3/19/2024 11:22:46 AM
G - Pulling back toward its 50 DMA ($308) which recently acted as support. It has not formed a sound base of sufficient length. Fundamentals remain strong after it reported Jan '24 quarterly earnings +102% on +33% sales revenues versus the year-ago period.
>>> FEATURED STOCK ARTICLE : Encountered Distributional Pressure After Spiking to New High - 3/11/2024 |
View all notes |
Set NEW NOTE alert |
Company Profile |
SEC
News |
Chart |
Request a new note
C
A
S
I |
Symbol/Exchange
Company Name
Industry Group |
PRICE |
CHANGE
(%Change) |
Day High |
Volume
(% DAV)
(% 50 day avg vol) |
52 Wk Hi
% From Hi |
Featured
Date |
Price
Featured |
Pivot Featured |
|
Max Buy |
ELF
-
N
e.l.f. Beauty
Cosmetics/Personal Care
|
$190.67
|
-6.19
-3.14% |
$195.24
|
1,493,727
96.12% of 50 DAV
50 DAV is 1,554,000
|
$221.83
-14.05%
|
1/2/2024
|
$138.23
|
PP = $153.63
|
|
MB = $161.31
|
Most Recent Note - 3/19/2024 11:21:25 AM
G - Gapped down today, on track for a 4th consecutive loss after getting very extended from any sound base. Its 50 DMA line ($177.69) defines important near-term support to watch. Fundamentals remain strong.
>>> FEATURED STOCK ARTICLE : Encountering Distributional Pressure Near All-Time High - 3/8/2024 |
View all notes |
Set NEW NOTE alert |
Company Profile |
SEC
News |
Chart |
Request a new note
C
A
S
I |
PCAR
-
N
Paccar
Trucks and Parts-Hvy Duty
|
$121.00
|
+0.66
0.55% |
$121.23
|
1,949,506
82.92% of 50 DAV
50 DAV is 2,351,000
|
$120.43
0.47%
|
1/23/2024
|
$100.35
|
PP = $98.57
|
|
MB = $103.50
|
Most Recent Note - 3/15/2024 12:45:03 PM
G - Hitting a new all-time high with today's gain, steadily wedging higher with gains lacking great volume conviction. Its 50 DMA line ($105.12) defines near-term support to watch on pullbacks. Fundamentals remain strong.
>>> FEATURED STOCK ARTICLE : Extended From Any Sound Base After 7 Weekly Gains - 2/26/2024 |
View all notes |
Set NEW NOTE alert |
Company Profile |
SEC
News |
Chart |
Request a new note
C
A
S
I |
HUBB
-
N
Hubbell
Electrical-Power/Equipmt
|
$396.71
|
-2.90
-0.73% |
$398.11
|
377,464
87.17% of 50 DAV
50 DAV is 433,000
|
$404.15
-1.84%
|
1/30/2024
|
$343.26
|
PP = $336.83
|
|
MB = $353.67
|
Most Recent Note - 3/18/2024 5:07:24 PM
G - Perched at its all-time high, very extended from the previously noted base. Its 50 DMA line ($356.47) defines important support to watch on pullbacks.
>>> FEATURED STOCK ARTICLE : Inched to New Highs With Average Volume - 2/28/2024 |
View all notes |
Set NEW NOTE alert |
Company Profile |
SEC
News |
Chart |
Request a new note
C
A
S
I |
MANH
-
N
Manhattan Associates
Computer Sftwr-Enterprse
|
$247.60
|
+0.60
0.24% |
$249.42
|
428,601
113.99% of 50 DAV
50 DAV is 376,000
|
$266.94
-7.25%
|
1/31/2024
|
$240.57
|
PP = $230.71
|
|
MB = $242.25
|
Most Recent Note - 3/18/2024 5:08:57 PM
G - Halted its slide with a small gain today on light volume following 3 straight losses marked by above-average volume. It is extended from the previously noted base. Its 50 DMA line ($238) defines near-term support to watch above prior highs in the $230 area.
>>> FEATURED STOCK ARTICLE : Hovering Near All-Time High After Streak of Small Gains - 2/29/2024 |
View all notes |
Set NEW NOTE alert |
Company Profile |
SEC
News |
Chart |
Request a new note
C
A
S
I |
USLM
-
N
U.S. Lime & Minerals
Bldg-Cement/Concrt/Ag
|
$301.23
|
+12.45
4.31% |
$302.72
|
34,359
156.18% of 50 DAV
50 DAV is 22,000
|
$298.36
0.96%
|
2/9/2024
|
$254.68
|
PP = $265.09
|
|
MB = $278.34
|
Most Recent Note - 3/19/2024 6:59:14 PM
G - Big gain today for a new all-time high was backed by +55% above average volume, getting more extended from the previously noted base. Prior highs in the $265-266 area define initial near-term support to watch on pullbacks.
>>> FEATURED STOCK ARTICLE : Hit New All Time High With Light Volume Behind 5th Straight Gain - 3/13/2024 |
View all notes |
Set NEW NOTE alert |
Company Profile |
SEC
News |
Chart |
Request a new note
C
A
S
I |
Symbol/Exchange
Company Name
Industry Group |
PRICE |
CHANGE
(%Change) |
Day High |
Volume
(% DAV)
(% 50 day avg vol) |
52 Wk Hi
% From Hi |
Featured
Date |
Price
Featured |
Pivot Featured |
|
Max Buy |
NOW
-
N
ServiceNow
Computer Sftwr-Enterprse
|
$756.94
|
+1.14
0.15% |
$758.32
|
1,223,758
95.31% of 50 DAV
50 DAV is 1,284,000
|
$815.32
-7.16%
|
2/22/2024
|
$771.75
|
PP = $815.32
|
|
MB = $856.09
|
Most Recent Note - 3/15/2024 7:24:49 PM
G - Gapped down today and violated its 50 DMA line ($759) with a volume-driven loss raising concerns and triggering a technical sell signal. Its color code is changed to green. Prior lows in the &30 area define the next important near-term support to watch. A rebound above the 50 DMA line is needed for its outlook to improve.
>>> FEATURED STOCK ARTICLE : Found Support With a Solid Gap Up from 10-Week Moving Average - 2/23/2024 |
View all notes |
Set NEW NOTE alert |
Company Profile |
SEC
News |
Chart |
Request a new note
C
A
S
I |
SNPS
-
N
Synopsys
Computer Sftwr-Design
|
$584.71
|
+24.08
4.30% |
$585.74
|
1,537,646
113.56% of 50 DAV
50 DAV is 1,354,000
|
$629.38
-7.10%
|
2/22/2024
|
$600.65
|
PP = $582.85
|
|
MB = $611.99
|
Most Recent Note - 3/19/2024 6:57:33 PM
Y - Posted a big gain today with +14% above-average volume, finding support above its 50 DMA line ($550). Volume totals had cooled in recent weeks while consolidating. Previously noted - " A strong volume-driven gain and close above the pivot point is needed to clinch a proper technical buy signal. See the latest FSU analysis for more details and a new annotated graph.
>>> FEATURED STOCK ARTICLE : Rallying From Support at 50-Day Moving Average Line - 3/19/2024 |
View all notes |
Set NEW NOTE alert |
Company Profile |
SEC
News |
Chart |
Request a new note
C
A
S
I |
PAY
-
N
Paymentus Holdings
Finance-CrdtCard/PmtPr
|
$22.39
|
+0.02
0.09% |
$22.59
|
359,776
123.21% of 50 DAV
50 DAV is 292,000
|
$24.99
-10.40%
|
3/5/2024
|
$19.97
|
PP = $18.89
|
|
MB = $19.83
|
Most Recent Note - 3/18/2024 5:06:00 PM
G - Pulled back from its 52-week high with today's 3rd consecutive volume-driven loss after getting very extended from the previously noted base. Prior highs in the $18 range define important initial support to watch on pullbacks.
>>> FEATURED STOCK ARTICLE : Big Gap Up Gain Triggered Technical Buy Signal - 3/5/2024 |
View all notes |
Set NEW NOTE alert |
Company Profile |
SEC
News |
Chart |
Request a new note
C
A
S
I |
|
|
|
THESE ARE NOT BUY RECOMMENDATIONS!
Comments contained in the body of this report are technical
opinions only. The material herein has been obtained
from sources believed to be reliable and accurate, however,
its accuracy and completeness cannot be guaranteed.
This site is not an investment advisor, hence it does
not endorse or recommend any securities or other investments.
Any recommendation contained in this report may not
be suitable for all investors and it is not to be deemed
an offer or solicitation on our part with respect to
the purchase or sale of any securities. All trademarks,
service marks and trade names appearing in this report
are the property of their respective owners, and are
likewise used for identification purposes only.
This report is a service available
only to active Paid Premium Members.
You may opt-out of receiving report notifications
at any time. Questions or comments may be submitted
by writing to Premium Membership Services 665 S.E. 10 Street, Suite 201 Deerfield Beach, FL 33441-5634 or by calling 1-800-965-8307
or 954-785-1121.
|
|
|