You are not logged in.
This means you
CAN ONLY VIEW reports that were published prior to Friday, April 11, 2025.
You
MUST UPGRADE YOUR MEMBERSHIP if you want to see any current reports.
AFTER MARKET UPDATE - MONDAY, NOVEMBER 9TH, 2015
Previous After Market Report Next After Market Report >>>
|
|
|
|
DOW |
-179.85 |
17,730.48 |
-1.00% |
|
Volume |
948,965,350 |
-3% |
|
Volume |
1,680,255,710 |
-12% |
|
NASDAQ |
-51.82 |
5,095.30 |
-1.01% |
|
Advancers |
633 |
20% |
|
Advancers |
861 |
29% |
|
S&P 500 |
-20.62 |
2,078.58 |
-0.98% |
|
Decliners |
2,469 |
80% |
|
Decliners |
2,077 |
71% |
|
Russell 2000 |
-15.31 |
1,184.43 |
-1.28% |
|
52 Wk Highs |
30 |
|
|
52 Wk Highs |
106 |
|
|
S&P 600 |
-10.53 |
697.86 |
-1.49% |
|
52 Wk Lows |
84 |
|
|
52 Wk Lows |
76 |
|
|
 |
Major Averages Fell With Lighter Volume Totals
Kenneth J. Gruneisen - Passed the CAN SLIM® Master's Exam
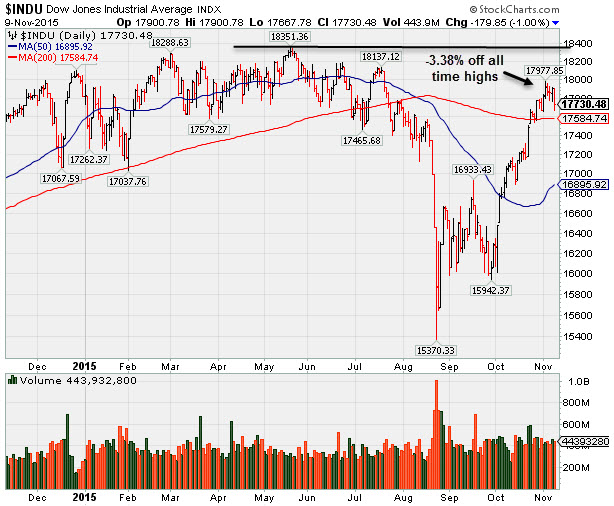
Stocks retreated on Monday’s session. The Dow fell 180 points to 17730. The S&P 500 lost 21 points to 2078, and the NASDAQ Composite fell 52 points to 5095. Volume totals were reported lighter on the NYSE and on the Nasdaq exchange. Decliners led advancers by nearly a 4-1 margin on the NYSE and by 5-2 on the Nasdaq exchange. Leadership contracted as there were 47 high-ranked companies from the Leaders List that made new 52-week highs and were listed on the BreakOuts Page, down from 81 on the prior session. New 52-week highs outnumbered new 52-week lows on the Nasdaq exchange, but new lows outnumbered new highs on the NYSE. There was only 1 gainer from the 11 high-ranked companies currently on the Featured Stocks Page, a disproportionately negative bias versus the broader market.
PICTURED: The Dow Jones Industrial Average is perched only -3.38% off its all-time high.
The major indices have established a confirmed uptrend (M criteria). Coupled with a reassuring expansion in leadership (stocks hitting new 52-week highs) big gains helped the S&P 500 Index, Dow Jones Industrial Average, and Nasdaq Composite Index unanimously rally above their respective 200-day moving average lines. The market environment is technically in healthier shape. New buying efforts may be considered in stocks meeting all key criteria, and some new candidates have met the strict guidelines of the fact-based investment system in the recent recovery.
The major averages finished firmly in negative territory as investors weighed
the prospects for the Fed to begin raising interest rates by yearend. In a
speech today, Boston regional president Eric Rosengren indicated the central
bank could consider tightening as soon as next month due to an improved labor
market and consumer spending. Market weakness was also attributed to a report
that showed China’s imports dropped 18.8% in October.
Consumer Discretionary and financials were the worst-performing sectors on
the session. Priceline (PCLN -9.57%) fell after the online travel agent
reduced its fourth-quarter forecast. Affiliated Managers (AMG +5.87%) as sales trailed analyst estimates.
In M&A news, Plum Creek Timber (PCL +17.30%) rose after it agreed to
be acquired by rival Weyerhaeuser (WX -2.96%) or $8.4 billion. Norfolk Southern (NSC +10.96%) amid reports Canadian Pacific (CP +5.86%) was exploring a possible takeover of the
railroad operator.
Treasuries were lower amid the increased expectations of a Fed rate hike in
December. Benchmark 10-year notes declined 7/32 to yield 2.35% and the 30-year
bond lost 18/32 to 3.12%. In commodities, NYMEX WTI crude declined 0.7% to
$44.00/barrel. COMEX gold rose 0.3% to $1090.80/ounce.
The Featured Stocks Page saw some new names recently added. The most current notes with headline links help members have access to more detailed letter-by-letter analysis including price/volume graphs annotated by our experts. See the Premium Member Homepage for archives to all prior pay reports.
|
 Kenneth J. Gruneisen started out as a licensed stockbroker in August 1987, a couple of months prior to the historic stock market crash that took the Dow Jones Industrial Average down -22.6% in a single day. He has published daily fact-based fundamental and technical analysis on high-ranked stocks online for two decades. Through FACTBASEDINVESTING.COM, Kenneth provides educational articles, news, market commentary, and other information regarding proven investment systems that work in good times and bad.
Comments contained in the body of this report are technical opinions only and are not necessarily those of Gruneisen Growth Corp. The material herein has been obtained from sources believed to be reliable and accurate, however, its accuracy and completeness cannot be guaranteed. Our firm, employees, and customers may effect transactions, including transactions contrary to any recommendation herein, or have positions in the securities mentioned herein or options with respect thereto. Any recommendation contained in this report may not be suitable for all investors and it is not to be deemed an offer or solicitation on our part with respect to the purchase or sale of any securities. |
|
 |
Biotech and Gold & Silver Indexes Posted Gains
Kenneth J. Gruneisen - Passed the CAN SLIM® Master's Exam
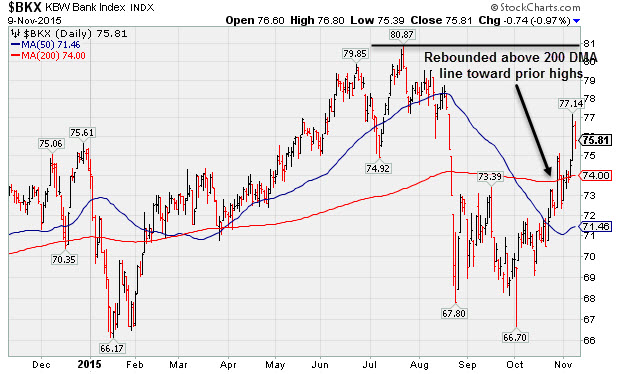
The Retail Index ($RLX -2.13%) created a drag and the Broker/Dealer Index ($XBD -0.78%) and Bank Index ($BKX -0.97%) both had a negative influence on the major averages on Monday. The Networking Index ($NWX -2.28%) and the Semiconductor Index ($SOX -0.96%) led the tech sector higher lower while the Biotechnology Index ($BTK +1.12%) posted a gain. The Integrated Oil Index ($XOI -1.24%) and the Oil Services Index ($OSX -0.78%) ended with small losses. The Gold & Silver Index ($XAU +2.26%) was a standout gainer.PICTURED: The Bank Index ($BKX -0.97%) recently rebounded above its 200-day moving average (DMA) line toward prior highs.
| Oil Services |
$OSX |
181.38 |
-1.43 |
-0.78% |
-13.98% |
| Integrated Oil |
$XOI |
1,215.44 |
-15.30 |
-1.24% |
-9.84% |
| Semiconductor |
$SOX |
669.94 |
-6.53 |
-0.97% |
-2.46% |
| Networking |
$NWX |
393.48 |
-9.17 |
-2.28% |
+9.93% |
| Broker/Dealer |
$XBD |
185.84 |
-1.46 |
-0.78% |
+0.65% |
| Retail |
$RLX |
1,281.45 |
-27.94 |
-2.13% |
+24.08% |
| Gold & Silver |
$XAU |
47.05 |
+1.04 |
+2.26% |
-31.59% |
| Bank |
$BKX |
75.81 |
-0.74 |
-0.97% |
+2.09% |
| Biotech |
$BTK |
3,715.44 |
+41.04 |
+1.12% |
+8.03% |
|
|
|
 |
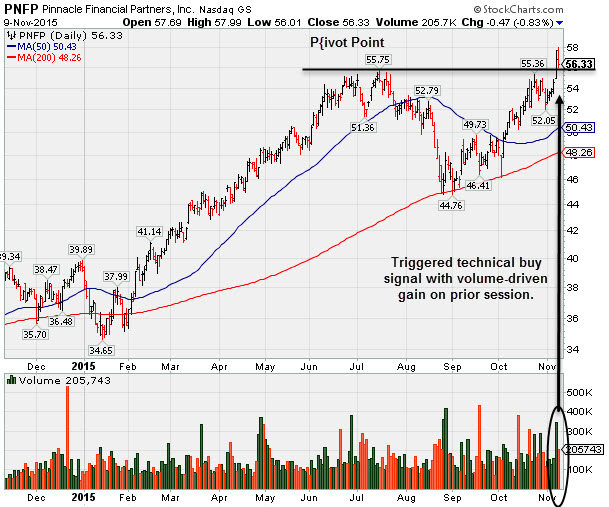
Perched at High Following Breakout
Kenneth J. Gruneisen - Passed the CAN SLIM® Master's Exam
Pinnacle Financial Prtnr (PNFP -$0.47 or -0.83% to $56.33) pulled back today with volume closer to average. It finished strong after highlighted in yellow with pivot point cited based on its 10/23/15 high plus 10 cents in the 11/06/15 mid-day report (read here). While hitting a new 52-week high the strong gain and finish above the pivot point backed by +98% above average volume clinched a technical buy signal. PNFP found support at its 200-day moving average (DMA) line during its consolidation. Reported earnings +27% on +35% sales revenues for the Sep '15 quarter, its 3rd consecutive quarterly comparison with earnings above the +25% minimum guideline (C criteria) helping it better match the fact-based investment system's guidelines. The number of top-rated funds owning its shares rose from 269 in Dec '14 to 313 in Sep '15, a reassuring sign concerning the I criteria. Its current Up/Down Volume Ratio of 1.5 is also an unbiased indication its shares have been under accumulation over the past 50 days. Its small supply of only 33.1 million shares in the public float can contribute to greater volatility in the event of institutional buying or selling.
|
|
|
Color Codes Explained :
Y - Better candidates highlighted by our
staff of experts.
G - Previously featured
in past reports as yellow but may no longer be buyable under the
guidelines.
***Last / Change / Volume data in this table is the closing quote data***
Symbol/Exchange
Company Name
Industry Group |
PRICE |
CHANGE
(%Change) |
Day High |
Volume
(% DAV)
(% 50 day avg vol) |
52 Wk Hi
% From Hi |
Featured
Date |
Price
Featured |
Pivot Featured |
|
Max Buy |
PNFP
-
NASDAQ
Pinnacle Financial Prtnr
BANKING - Regional - Southeast Banks
|
$56.33
|
-0.47
-0.83% |
$57.99
|
205,672
119.58% of 50 DAV
50 DAV is 172,000
|
$57.69
-2.36%
|
11/6/2015
|
$56.34
|
PP = $55.58
|
|
MB = $58.36
|
 Most Recent Note - 11/9/2015 5:41:45 PM
Y - Pulled back today after triggering a technical buy signal on the prior session. Found support at its 200 DMA line during its consolidation in prior months. Reported earnings +27% on +35% sales revenues for the Sep '15 quarter, its 3rd consecutive quarterly comparison with earnings above the +25% minimum guideline (C criteria) helping it better match the fact-based investment system's guidelines. See the latest FSU analysis for more details and a new annotated graph.
>>> FEATURED STOCK ARTICLE : Perched at High Following Breakout - 11/9/2015 |
View all notes |
Set NEW NOTE alert |
Company Profile |
SEC
News |
Chart |
Request a new note
C
A
S
I |
SFNC
-
NASDAQ
Simmons First Natl Cp A
BANKING - Regional - Southeast Banks
|
$55.35
|
-0.58
-1.04% |
$55.92
|
110,093
55.88% of 50 DAV
50 DAV is 197,000
|
$56.95
-2.81%
|
10/22/2015
|
$50.13
|
PP = $48.98
|
|
MB = $51.43
|
Most Recent Note - 11/6/2015 3:07:23 PM
G - Rallying further above its "max buy" level today for another new 52-week high. Prior highs in the $48 area define initial support to watch on pullbacks.
>>> FEATURED STOCK ARTICLE : Slightly Extended From Prior Base After Breakout - 11/3/2015 |
View all notes |
Set NEW NOTE alert |
Company Profile |
SEC
News |
Chart |
Request a new note
C
A
S
I |
MANH
-
NASDAQ
Manhattan Associates Inc
COMPUTER SOFTWARE and SERVICES - Technical and System Software
|
$74.33
|
-2.07
-2.71% |
$76.49
|
534,046
101.34% of 50 DAV
50 DAV is 527,000
|
$76.49
-2.82%
|
10/21/2015
|
$69.18
|
PP = $69.91
|
|
MB = $73.41
|
Most Recent Note - 11/9/2015 5:43:22 PM
G - Pulled back on average volume after hitting a new high on the prior session. Prior highs in the $69 area define initial support to watch on pullbacks.
>>> FEATURED STOCK ARTICLE : Prior Highs Define Support Following Recent Breakout - 11/2/2015 |
View all notes |
Set NEW NOTE alert |
Company Profile |
SEC
News |
Chart |
Request a new note
C
A
S
I |
JBSS
-
NASDAQ
Sanfilippo John B & Son
FOOD and BEVERAGE - Processed and Packaged Goods
|
$61.21
|
-0.17
-0.28% |
$62.09
|
50,185
67.82% of 50 DAV
50 DAV is 74,000
|
$66.29
-7.66%
|
10/27/2015
|
$56.00
|
PP = $57.33
|
|
MB = $60.20
|
Most Recent Note - 11/6/2015 1:19:41 PM
G - Color code was changed to green after rallying above its "max buy" level. Prior highs in the $57 area define initial support to watch on pullbacks.
>>> FEATURED STOCK ARTICLE : Small Supply in Food Firm Tecnically Breaking Out - 10/27/2015 |
View all notes |
Set NEW NOTE alert |
Company Profile |
SEC
News |
Chart |
Request a new note
C
A
S
I |
STMP
-
NASDAQ
Stamps.com Inc
INTERNET - Internet Software and Services
|
$97.70
|
-7.23
-6.89% |
$102.87
|
743,503
277.43% of 50 DAV
50 DAV is 268,000
|
$106.43
-8.20%
|
11/6/2015
|
$100.75
|
PP = $88.97
|
|
MB = $93.42
|
Most Recent Note - 11/9/2015 1:14:11 PM
G - Pulling back today after quickly getting very extended from prior highs with a "breakaway gap" backed by nearly 8 times average volume on the prior session. Disciplined investors avoid chasing extended stocks. See the latest FSU analysis for more details and an annotated graph.
>>> FEATURED STOCK ARTICLE : Big Breakaway Gap With Heavy Volume Following Earnings News - 11/6/2015 |
View all notes |
Set NEW NOTE alert |
Company Profile |
SEC
News |
Chart |
Request a new note
C
A
S
I |
Symbol/Exchange
Company Name
Industry Group |
PRICE |
CHANGE
(%Change) |
Day High |
Volume
(% DAV)
(% 50 day avg vol) |
52 Wk Hi
% From Hi |
Featured
Date |
Price
Featured |
Pivot Featured |
|
Max Buy |
ULTI
-
NASDAQ
Ultimate Software Group
INTERNET - Internet Software and Services
|
$208.15
|
-2.79
-1.32% |
$216.27
|
153,394
60.63% of 50 DAV
50 DAV is 253,000
|
$211.09
-1.39%
|
10/28/2015
|
$204.38
|
PP = $195.28
|
|
MB = $205.04
|
Most Recent Note - 11/6/2015 1:21:22 PM
G - Color code is changed to green after rising above its "max buy" level. Prior highs in the $195 area define initial support to watch on pullbacks.
>>> FEATURED STOCK ARTICLE : Technical Breakout Backed By Heavy Volume - 10/28/2015 |
View all notes |
Set NEW NOTE alert |
Company Profile |
SEC
News |
Chart |
Request a new note
C
A
S
I |
ULTA
-
NASDAQ
Ulta Salon Cosm & Frag
SPECIALTY RETAIL - Specialty Retail, Other
|
$171.56
|
-1.08
-0.63% |
$172.27
|
409,170
51.47% of 50 DAV
50 DAV is 795,000
|
$176.77
-2.95%
|
10/22/2015
|
$168.02
|
PP = $170.31
|
|
MB = $178.83
|
Most Recent Note - 11/4/2015 11:23:55 AM
Y - Perched near its all-time high and no resistance remains due to overhead supply. It has not posted a gain above the pivot point backed by at least +40% above average volume, and a convincing gain is still needed to trigger a proper technical buy signal.
>>> FEATURED STOCK ARTICLE : Recent Gains Lacked Volume Indicative of Institutional Buying Demand - 10/29/2015 |
View all notes |
Set NEW NOTE alert |
Company Profile |
SEC
News |
Chart |
Request a new note
C
A
S
I |
FLTX
-
NYSE
Fleetmatics Group Plc
Computer Sftwr-Enterprse
|
$59.64
|
-0.39
-0.65% |
$60.48
|
285,935
69.74% of 50 DAV
50 DAV is 410,000
|
$60.50
-1.42%
|
9/23/2015
|
$51.26
|
PP = $52.55
|
|
MB = $55.18
|
Most Recent Note - 11/4/2015 12:27:23 PM
G - Volume and volatility often increase near earnings news. Reported earnings +41% on +22% sales revenues for the Sep '15 quarter and rallied to a new high today, getting more extended from its prior base. Prior highs in the $52 area acted as support during its consolidation.
>>> FEATURED STOCK ARTICLE : Earnings News Due May Contribute to Volatility Next Week - 10/30/2015 |
View all notes |
Set NEW NOTE alert |
Company Profile |
SEC
News |
Chart |
Request a new note
C
A
S
I |
LXFT
-
NYSE
Luxoft Holding Inc Cl A
Comp Sftwr-Spec Enterprs
|
$69.58
|
-0.28
-0.40% |
$70.17
|
174,160
79.89% of 50 DAV
50 DAV is 218,000
|
$71.92
-3.25%
|
10/22/2015
|
$66.65
|
PP = $68.95
|
|
MB = $72.40
|
Most Recent Note - 11/4/2015 11:20:49 AM
Y - No resistance remains due to overhead supply while hitting a new 52-week high today and approaching its "max buy" level. Due to report Sep '15 earnings after the close on Tuesday, 11/10/15.
>>> FEATURED STOCK ARTICLE : Retreat Into Prior Base Following Latest Breakout - 10/26/2015 |
View all notes |
Set NEW NOTE alert |
Company Profile |
SEC
News |
Chart |
Request a new note
C
A
S
I |
VBTX
-
NASDAQ
Veritex Holdings Inc
BANKING - Regional - Southwest Banks
|
$17.25
|
-0.10
-0.58% |
$17.40
|
12,556
73.86% of 50 DAV
50 DAV is 17,000
|
$17.95
-3.90%
|
11/4/2015
|
$17.00
|
PP = $18.05
|
|
MB = $18.95
|
Most Recent Note - 11/4/2015 7:18:10 PM
Y - Posted a gain with above average volume. It was highlighted in yellow with pivot point cited based on its 7/08/15 high plus 10 cents. Subsequent gains above its pivot point backed by at least +40% above average volume may trigger a technical buy signal. The 200 DMA line recently acted as support. Reported earnings +64% on +31% sales revenue for the Sep '15 quarter and prior quarterly earnings increases were above the +25% minimum guideline (C criteria). See the latest FSU analysis for more details and a new annotated graph.
>>> FEATURED STOCK ARTICLE : Perched Within Striking Distance of Highs in 19-Week Base - 11/4/2015 |
View all notes |
Set NEW NOTE alert |
Company Profile |
SEC
News |
Chart |
Request a new note
C
A
S
I |
Symbol/Exchange
Company Name
Industry Group |
PRICE |
CHANGE
(%Change) |
Day High |
Volume
(% DAV)
(% 50 day avg vol) |
52 Wk Hi
% From Hi |
Featured
Date |
Price
Featured |
Pivot Featured |
|
Max Buy |
NHTC
-
NASDAQ
Natural Health Trends
Cosmetics/Personal Care
|
$52.55
|
+1.66
3.26% |
$52.79
|
297,335
87.97% of 50 DAV
50 DAV is 338,000
|
$55.45
-5.23%
|
10/23/2015
|
$42.12
|
PP = $44.85
|
|
MB = $47.09
|
Most Recent Note - 11/9/2015 5:45:30 PM
G - Perched near its best-ever close after 3 consecutive gains. Disciplined investors avoid chasing stocks extended more than +5% above prior highs and always limit losses by selling any stock that falls more than -7% from their purchase price.
>>> FEATURED STOCK ARTICLE : Finished Strong But Approaching Prior Resistance - 10/23/2015 |
View all notes |
Set NEW NOTE alert |
Company Profile |
SEC
News |
Chart |
Request a new note
C
A
S
I |
|
|
|
THESE ARE NOT BUY RECOMMENDATIONS!
Comments contained in the body of this report are technical
opinions only. The material herein has been obtained
from sources believed to be reliable and accurate, however,
its accuracy and completeness cannot be guaranteed.
This site is not an investment advisor, hence it does
not endorse or recommend any securities or other investments.
Any recommendation contained in this report may not
be suitable for all investors and it is not to be deemed
an offer or solicitation on our part with respect to
the purchase or sale of any securities. All trademarks,
service marks and trade names appearing in this report
are the property of their respective owners, and are
likewise used for identification purposes only.
This report is a service available
only to active Paid Premium Members.
You may opt-out of receiving report notifications
at any time. Questions or comments may be submitted
by writing to Premium Membership Services 665 S.E. 10 Street, Suite 201 Deerfield Beach, FL 33441-5634 or by calling 1-800-965-8307
or 954-785-1121.
|
|
|