You are not logged in.
This means you
CAN ONLY VIEW reports that were published prior to Friday, January 10, 2025.
You
MUST UPGRADE YOUR MEMBERSHIP if you want to see any current reports.
AFTER MARKET UPDATE - FRIDAY, NOVEMBER 6TH, 2015
Previous After Market Report Next After Market Report >>>
|
|
|
|
DOW |
+46.90 |
17,910.33 |
+0.26% |
|
Volume |
981,793,200 |
+8% |
|
Volume |
1,903,451,490 |
-1% |
|
NASDAQ |
+19.38 |
5,147.12 |
+0.38% |
|
Advancers |
1,189 |
38% |
|
Advancers |
1,801 |
61% |
|
S&P 500 |
-0.73 |
2,099.20 |
-0.03% |
|
Decliners |
1,918 |
62% |
|
Decliners |
1,132 |
39% |
|
Russell 2000 |
+9.06 |
1,199.75 |
+0.76% |
|
52 Wk Highs |
60 |
|
|
52 Wk Highs |
147 |
|
|
S&P 600 |
+3.38 |
708.39 |
+0.48% |
|
52 Wk Lows |
84 |
|
|
52 Wk Lows |
75 |
|
|
 |
Major Averages Posted Solid Weekly Gains
Kenneth J. Gruneisen - Passed the CAN SLIM® Master's Exam
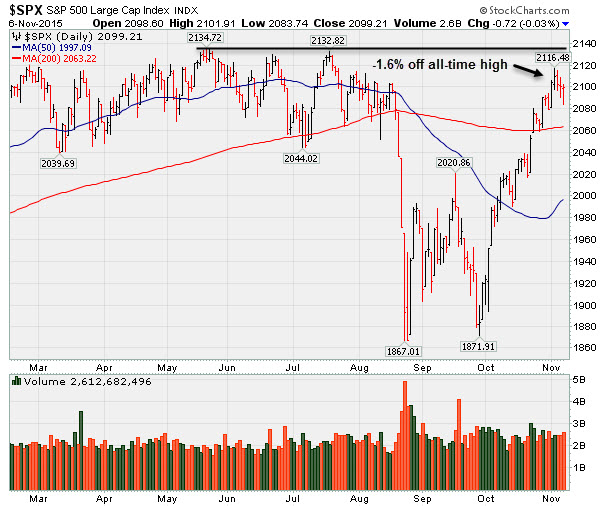
For the week the Dow advanced 1.4%, the S&P 500 was up 1% and the NASDAQ climbed 1.9%. Stocks were mostly higher on Friday. The Dow added 46 points to 17910. The S&P 500 slid less than a point to 2099. The NASDAQ climbed 19 points to 5147. Volume totals were reported mixed, higher on the NYSE and slightly lower on the Nasdaq exchange. Decliners led advancers by a 3-2 margin on the NYSE, meanwhile advancers led decliners by 3-2 on the Nasdaq exchange. Healthy leadership was evident as there were 81 high-ranked companies from the Leaders List that made new 52-week highs and were listed on the BreakOuts Page. New 52-week highs outnumbered new 52-week lows on the Nasdaq exchange, but new lows outnumbered new highs on the NYSE. There were gains for 9 of the 11 high-ranked companies currently on the Featured Stocks Page.
PICTURED: The benchmark S&P 500 Index suffered 3 consecutive losses yet remains perched only -1.6% off its all-time high.
The major indices have established a confirmed uptrend (M criteria). Coupled with a reassuring expansion in leadership (stocks hitting new 52-week highs) big gains helped the S&P 500 Index, Dow Jones Industrial Average, and Nasdaq Composite Index unanimously rally above their respective 200-day moving average lines. The market environment is technically in healthier shape. New buying efforts may be considered in stocks meeting all key criteria, and some new candidates have met the strict guidelines of the fact-based investment system in the recent recovery.
The major averages fluctuated throughout the session after a stellar nonfarm jobs report. The U.S. labor market added 271,000 jobs in October, dwarfing the 185,000 that economists were projecting. The underemployment rate ticked down to 9.8%, the lowest level since May 2008. In the immediate aftermath of the release, futures markets are pricing in a 70% change of an interest rate increase in December, up from a 56% likelihood after the close on Thursday. On the earnings front, Disney (DIS +2.4%) rose after beating profit projections but slightly missing revenue expectations. Men’s Warehouse (MW -43.4%) tumbled hard after posting earnings that were 50% below analyst consensus. Six out of ten sectors traded lower on Friday. Utilities and consumer staples lagged while financials outperformed on the expectation of higher interest rates. Treasuries sold off after the jobs report. Benchmark 10-year notes lost 26/32 to 2.33%. The short dated two-year maturity retreated 4/32 to yield 0.89%, the highest level since 2010. Commodities were mostly lower. NYMEX WTI crude fell 1.7% to $44.42/barrel. COMEX gold was off 1.5% to $1088.20/ounce. In FOREX, the Bloomberg Dollar index surged 1.2% against its peers. The Featured Stocks Page saw some new names recently added. The most current notes with headline links help members have access to more detailed letter-by-letter analysis including price/volume graphs annotated by our experts. See the Premium Member Homepage for archives to all prior pay reports.
|
 Kenneth J. Gruneisen started out as a licensed stockbroker in August 1987, a couple of months prior to the historic stock market crash that took the Dow Jones Industrial Average down -22.6% in a single day. He has published daily fact-based fundamental and technical analysis on high-ranked stocks online for two decades. Through FACTBASEDINVESTING.COM, Kenneth provides educational articles, news, market commentary, and other information regarding proven investment systems that work in good times and bad.
Comments contained in the body of this report are technical opinions only and are not necessarily those of Gruneisen Growth Corp. The material herein has been obtained from sources believed to be reliable and accurate, however, its accuracy and completeness cannot be guaranteed. Our firm, employees, and customers may effect transactions, including transactions contrary to any recommendation herein, or have positions in the securities mentioned herein or options with respect thereto. Any recommendation contained in this report may not be suitable for all investors and it is not to be deemed an offer or solicitation on our part with respect to the purchase or sale of any securities. |
|
 |
Financials and Semiconductors Led Gainers: XAU Fell Hard
Kenneth J. Gruneisen - Passed the CAN SLIM® Master's Exam
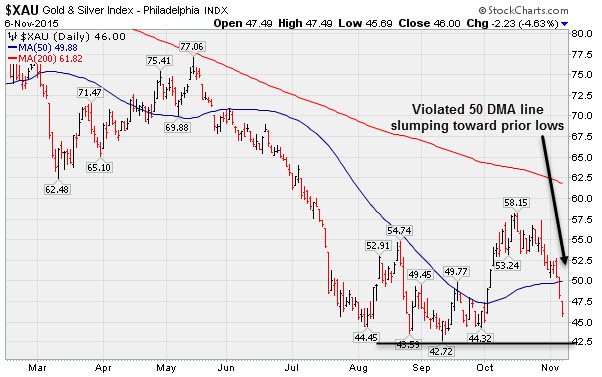
The Broker/Dealer Index ($XBD +2.79%) and the Bank Index ($BKX +2.73%) both had a positive influence on the major averages on Friday, meanwhile the Retail Index ($RLX -0.40%) created a drag The Semiconductor Index ($SOX +2.59%) led the tech sector higher and the Networking Index ($NWX +0.46%) edged higher, but the Biotechnology Index ($BTK -0.17%) ended the session slightly lower. The Integrated Oil Index ($XOI -0.92%) fell while the Oil Services Index ($OSX +0.14%) eked out a small gain. PICTURED: The Gold & Silver Index ($XAU -4.62%) was a standout decliner, slumping below its 50-day moving average (DMA) line toward prior lows.
| Oil Services |
$OSX |
182.81 |
+0.26 |
+0.14% |
-13.31% |
| Integrated Oil |
$XOI |
1,230.74 |
-11.41 |
-0.92% |
-8.71% |
| Semiconductor |
$SOX |
676.47 |
+17.11 |
+2.59% |
-1.51% |
| Networking |
$NWX |
402.65 |
+1.83 |
+0.46% |
+12.49% |
| Broker/Dealer |
$XBD |
187.29 |
+5.08 |
+2.79% |
+1.44% |
| Retail |
$RLX |
1,309.39 |
-5.23 |
-0.40% |
+26.79% |
| Gold & Silver |
$XAU |
46.01 |
-2.23 |
-4.62% |
-33.11% |
| Bank |
$BKX |
76.55 |
+2.04 |
+2.74% |
+3.08% |
| Biotech |
$BTK |
3,674.40 |
-6.24 |
-0.17% |
+6.84% |
|
|
|
 |
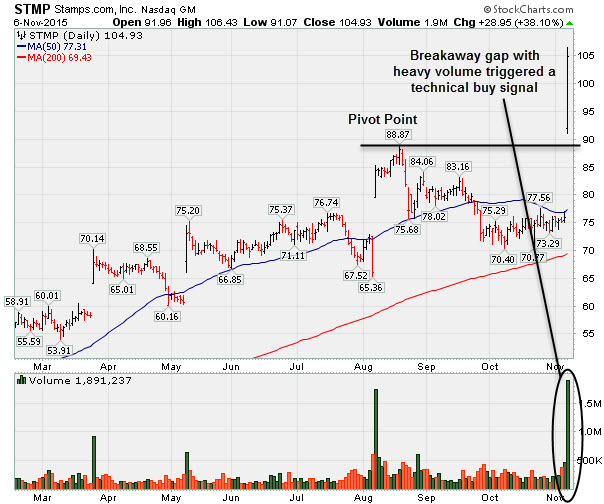
Big Breakaway Gap With Heavy Volume Following Earnings News
Kenneth J. Gruneisen - Passed the CAN SLIM® Master's Exam
Stamps.Com Inc (STMP +$28.95 or +38.10% to $104.93) was highlighted in yellow with pivot point cited based on its 8/19/15 high plus 10 cents (read here). It hit a new 52-week high with nearly 8 times average volume behind today's considerable "breakaway gap". Breakaway gaps are one noted exception where chasing a stock more than +5% above prior highs is permitted under the fact-based investment system guidelines, but risk increases the further above prior highs one makes any purchases. Bullish action came after it reported earnings +61% on +37% sales revenues for the Sep '15 quarter, well above the +25% minimum guideline (C criteria), continuing its strong earnings history matching the fact-based investment system's winning models. Earnings rose +44%, +76%, and 61% in the Mar, Jun, and Sep '15 quarters, respectively, versus the year ago periods. Sales revenues rose +32%, +41%, and +37% during that same span. STMP has managed a choppy ascent following a deep consolidation after last shown in this FSU section with an annotated graph on 12/02/13 under the headline, " Upward Trendline and 50-Day Average Define Important Near-Term Support". It has earned an Earnings Per Share Rating of 99, putting it in the top 1% of all publicly traded stocks based on its earnings history over the past 5 years. The Retail - Internet firm has other strong leaders in the group confirming the L criteria, as the group has an A+ Group Relative Strength Rating. Its annual earnings (A criteria) history has shown strong and steady increases since FY '09 following a couple of flat years. The number of top-rated funds owning its shares rose from 232 in Dec '14 to 303 in Sep '15, a reassuring sign concerning the I criteria. Its small supply of only 16.5 million shares outstanding (S criteria) can contribute to greater price volatility in the event of institutional buying or selling. Charts courtesy www.stockcharts.com
 |
|
|
Color Codes Explained :
Y - Better candidates highlighted by our
staff of experts.
G - Previously featured
in past reports as yellow but may no longer be buyable under the
guidelines.
***Last / Change / Volume data in this table is the closing quote data***
Symbol/Exchange
Company Name
Industry Group |
PRICE |
CHANGE
(%Change) |
Day High |
Volume
(% DAV)
(% 50 day avg vol) |
52 Wk Hi
% From Hi |
Featured
Date |
Price
Featured |
Pivot Featured |
|
Max Buy |
PNFP
-
NASDAQ
Pinnacle Financial Prtnr
BANKING - Regional - Southeast Banks
|
$56.84
|
+2.26
4.14% |
$57.69
|
311,997
179.31% of 50 DAV
50 DAV is 174,000
|
$56.00
1.50%
|
11/6/2015
|
$56.34
|
PP = $55.58
|
|
MB = $58.36
|
 Most Recent Note - 11/6/2015 12:47:28 PM
Y - Color code is changed to yellow with pivot point cited based on its 10/23/15 high plus 10 cents. Hitting a new 52-week high today, and a strong gain and finish above the pivot point backed by at least +40% above average volume may clinch a technical buy signal. Found support at its 200 DMA line during its consolidation. Reported earnings +27% on +35% sales revenues for the Sep '15 quarter, its 3rd consecutive quarterly comparison with earnings above the +25% minimum guideline (C criteria) helping it better match the fact-based investment system's guidelines.
There are no Featured Stock Updates™ available for this stock at this time. You may request one by clicking the Request a New Note link below |
View all notes |
Set NEW NOTE alert |
Company Profile |
SEC
News |
Chart |
Request a new note
C
A
S
I |
SFNC
-
NASDAQ
Simmons First Natl Cp A
BANKING - Regional - Southeast Banks
|
$55.90
|
+1.79
3.31% |
$56.95
|
196,301
100.15% of 50 DAV
50 DAV is 196,000
|
$54.17
3.19%
|
10/22/2015
|
$50.13
|
PP = $48.98
|
|
MB = $51.43
|
Most Recent Note - 11/6/2015 3:07:23 PM
G - Rallying further above its "max buy" level today for another new 52-week high. Prior highs in the $48 area define initial support to watch on pullbacks.
>>> FEATURED STOCK ARTICLE : Slightly Extended From Prior Base After Breakout - 11/3/2015 |
View all notes |
Set NEW NOTE alert |
Company Profile |
SEC
News |
Chart |
Request a new note
C
A
S
I |
MANH
-
NASDAQ
Manhattan Associates Inc
COMPUTER SOFTWARE and SERVICES - Technical and System Software
|
$76.37
|
+2.88
3.92% |
$76.42
|
579,246
110.33% of 50 DAV
50 DAV is 525,000
|
$75.49
1.17%
|
10/21/2015
|
$69.18
|
PP = $69.91
|
|
MB = $73.41
|
Most Recent Note - 11/6/2015 3:06:06 PM
G - Hitting another new high today. Prior highs in the $69 area define initial support to watch on pullbacks.
>>> FEATURED STOCK ARTICLE : Prior Highs Define Support Following Recent Breakout - 11/2/2015 |
View all notes |
Set NEW NOTE alert |
Company Profile |
SEC
News |
Chart |
Request a new note
C
A
S
I |
JBSS
-
NASDAQ
Sanfilippo John B & Son
FOOD and BEVERAGE - Processed and Packaged Goods
|
$61.23
|
-1.20
-1.92% |
$62.32
|
99,342
136.08% of 50 DAV
50 DAV is 73,000
|
$66.29
-7.63%
|
10/27/2015
|
$56.00
|
PP = $57.33
|
|
MB = $60.20
|
Most Recent Note - 11/6/2015 1:19:41 PM
G - Color code was changed to green after rallying above its "max buy" level. Prior highs in the $57 area define initial support to watch on pullbacks.
>>> FEATURED STOCK ARTICLE : Small Supply in Food Firm Tecnically Breaking Out - 10/27/2015 |
View all notes |
Set NEW NOTE alert |
Company Profile |
SEC
News |
Chart |
Request a new note
C
A
S
I |
STMP
-
NASDAQ
Stamps.com Inc
INTERNET - Internet Software and Services
|
$104.32
|
+28.34
37.30% |
$106.43
|
1,782,265
736.47% of 50 DAV
50 DAV is 242,000
|
$88.87
17.38%
|
11/6/2015
|
$100.75
|
PP = $88.97
|
|
MB = $93.42
|
Most Recent Note - 11/6/2015 1:02:28 PM
Y - Color code is changed to yellow with pivot point cited based on its 8/19/15 high plus 10 cents. Hit a new 52-week high with today's considerable "breakaway gap". Breakaway gaps are one noted exception where chasing a stock more than +5% above prior highs is permitted under the fact-based investment system guidelines, but risk increases the further above prior highs one makes any purchases. Reported earnings +61% on +37% sales revenues for the Sep '15 quarter, above the +25% minimum guideline (C criteria), continuing its strong earnings history matching the fact-based investment system's winning models.
>>> FEATURED STOCK ARTICLE : Upward Trendline and 50-Day Average Define Important Near-Term Support - 12/2/2013 |
View all notes |
Set NEW NOTE alert |
Company Profile |
SEC
News |
Chart |
Request a new note
C
A
S
I |
Symbol/Exchange
Company Name
Industry Group |
PRICE |
CHANGE
(%Change) |
Day High |
Volume
(% DAV)
(% 50 day avg vol) |
52 Wk Hi
% From Hi |
Featured
Date |
Price
Featured |
Pivot Featured |
|
Max Buy |
ULTI
-
NASDAQ
Ultimate Software Group
INTERNET - Internet Software and Services
|
$210.95
|
+7.01
3.44% |
$211.09
|
242,416
95.82% of 50 DAV
50 DAV is 253,000
|
$209.60
0.64%
|
10/28/2015
|
$204.38
|
PP = $195.28
|
|
MB = $205.04
|
Most Recent Note - 11/6/2015 1:21:22 PM
G - Color code is changed to green after rising above its "max buy" level. Prior highs in the $195 area define initial support to watch on pullbacks.
>>> FEATURED STOCK ARTICLE : Technical Breakout Backed By Heavy Volume - 10/28/2015 |
View all notes |
Set NEW NOTE alert |
Company Profile |
SEC
News |
Chart |
Request a new note
C
A
S
I |
ULTA
-
NASDAQ
Ulta Salon Cosm & Frag
SPECIALTY RETAIL - Specialty Retail, Other
|
$172.69
|
+0.16
0.09% |
$173.21
|
299,190
35.70% of 50 DAV
50 DAV is 838,000
|
$176.77
-2.31%
|
10/22/2015
|
$168.02
|
PP = $170.31
|
|
MB = $178.83
|
Most Recent Note - 11/4/2015 11:23:55 AM
Y - Perched near its all-time high and no resistance remains due to overhead supply. It has not posted a gain above the pivot point backed by at least +40% above average volume, and a convincing gain is still needed to trigger a proper technical buy signal.
>>> FEATURED STOCK ARTICLE : Recent Gains Lacked Volume Indicative of Institutional Buying Demand - 10/29/2015 |
View all notes |
Set NEW NOTE alert |
Company Profile |
SEC
News |
Chart |
Request a new note
C
A
S
I |
FLTX
-
NYSE
Fleetmatics Group Plc
Computer Sftwr-Enterprse
|
$60.12
|
+1.72
2.95% |
$60.50
|
368,509
90.10% of 50 DAV
50 DAV is 409,000
|
$59.73
0.65%
|
9/23/2015
|
$51.26
|
PP = $52.55
|
|
MB = $55.18
|
Most Recent Note - 11/4/2015 12:27:23 PM
G - Volume and volatility often increase near earnings news. Reported earnings +41% on +22% sales revenues for the Sep '15 quarter and rallied to a new high today, getting more extended from its prior base. Prior highs in the $52 area acted as support during its consolidation.
>>> FEATURED STOCK ARTICLE : Earnings News Due May Contribute to Volatility Next Week - 10/30/2015 |
View all notes |
Set NEW NOTE alert |
Company Profile |
SEC
News |
Chart |
Request a new note
C
A
S
I |
LXFT
-
NYSE
Luxoft Holding Inc Cl A
Comp Sftwr-Spec Enterprs
|
$69.82
|
-0.08
-0.11% |
$70.00
|
240,873
111.00% of 50 DAV
50 DAV is 217,000
|
$71.92
-2.92%
|
10/22/2015
|
$66.65
|
PP = $68.95
|
|
MB = $72.40
|
Most Recent Note - 11/4/2015 11:20:49 AM
Y - No resistance remains due to overhead supply while hitting a new 52-week high today and approaching its "max buy" level. Due to report Sep '15 earnings after the close on Tuesday, 11/10/15.
>>> FEATURED STOCK ARTICLE : Retreat Into Prior Base Following Latest Breakout - 10/26/2015 |
View all notes |
Set NEW NOTE alert |
Company Profile |
SEC
News |
Chart |
Request a new note
C
A
S
I |
VBTX
-
NASDAQ
Veritex Holdings Inc
BANKING - Regional - Southwest Banks
|
$17.35
|
+0.08
0.46% |
$17.45
|
15,741
92.59% of 50 DAV
50 DAV is 17,000
|
$17.95
-3.34%
|
11/4/2015
|
$17.00
|
PP = $18.05
|
|
MB = $18.95
|
Most Recent Note - 11/4/2015 7:18:10 PM
Y - Posted a gain with above average volume. It was highlighted in yellow with pivot point cited based on its 7/08/15 high plus 10 cents. Subsequent gains above its pivot point backed by at least +40% above average volume may trigger a technical buy signal. The 200 DMA line recently acted as support. Reported earnings +64% on +31% sales revenue for the Sep '15 quarter and prior quarterly earnings increases were above the +25% minimum guideline (C criteria). See the latest FSU analysis for more details and a new annotated graph.
>>> FEATURED STOCK ARTICLE : Perched Within Striking Distance of Highs in 19-Week Base - 11/4/2015 |
View all notes |
Set NEW NOTE alert |
Company Profile |
SEC
News |
Chart |
Request a new note
C
A
S
I |
Symbol/Exchange
Company Name
Industry Group |
PRICE |
CHANGE
(%Change) |
Day High |
Volume
(% DAV)
(% 50 day avg vol) |
52 Wk Hi
% From Hi |
Featured
Date |
Price
Featured |
Pivot Featured |
|
Max Buy |
NHTC
-
NASDAQ
Natural Health Trends
Cosmetics/Personal Care
|
$50.76
|
-0.02
-0.05% |
$52.33
|
370,278
109.87% of 50 DAV
50 DAV is 337,000
|
$55.45
-8.46%
|
10/23/2015
|
$42.12
|
PP = $44.85
|
|
MB = $47.09
|
Most Recent Note - 11/4/2015 12:46:28 PM
G - Pulling back after a streak of volume-driven gains. Prior highs in the $44 area define initial support to watch following its recent breakout. Disciplined investors avoid chasing stocks extended more than +5% above prior highs and always limit losses by selling any stock that falls more than -7% from their purchase price.
>>> FEATURED STOCK ARTICLE : Finished Strong But Approaching Prior Resistance - 10/23/2015 |
View all notes |
Set NEW NOTE alert |
Company Profile |
SEC
News |
Chart |
Request a new note
C
A
S
I |
|
|
|
THESE ARE NOT BUY RECOMMENDATIONS!
Comments contained in the body of this report are technical
opinions only. The material herein has been obtained
from sources believed to be reliable and accurate, however,
its accuracy and completeness cannot be guaranteed.
This site is not an investment advisor, hence it does
not endorse or recommend any securities or other investments.
Any recommendation contained in this report may not
be suitable for all investors and it is not to be deemed
an offer or solicitation on our part with respect to
the purchase or sale of any securities. All trademarks,
service marks and trade names appearing in this report
are the property of their respective owners, and are
likewise used for identification purposes only.
This report is a service available
only to active Paid Premium Members.
You may opt-out of receiving report notifications
at any time. Questions or comments may be submitted
by writing to Premium Membership Services 665 S.E. 10 Street, Suite 201 Deerfield Beach, FL 33441-5634 or by calling 1-800-965-8307
or 954-785-1121.
|
|
|