You are not logged in.
This means you
CAN ONLY VIEW reports that were published prior to Monday, March 31, 2025.
You
MUST UPGRADE YOUR MEMBERSHIP if you want to see any current reports.
AFTER MARKET UPDATE - MONDAY, NOVEMBER 2ND, 2015
Previous After Market Report Next After Market Report >>>
|
|
|
|
DOW |
+165.22 |
17,828.76 |
+0.94% |
|
Volume |
845,602,750 |
-24% |
|
Volume |
1,745,146,600 |
-5% |
|
NASDAQ |
+73.40 |
5,127.15 |
+1.45% |
|
Advancers |
2,529 |
82% |
|
Advancers |
2,351 |
79% |
|
S&P 500 |
+24.69 |
2,104.05 |
+1.19% |
|
Decliners |
564 |
18% |
|
Decliners |
632 |
21% |
|
Russell 2000 |
+24.23 |
1,186.09 |
+2.09% |
|
52 Wk Highs |
103 |
|
|
52 Wk Highs |
91 |
|
|
S&P 600 |
+12.65 |
702.01 |
+1.84% |
|
52 Wk Lows |
28 |
|
|
52 Wk Lows |
47 |
|
|
 |
Major Averages Rose With Lighter Volume Totals
Kenneth J. Gruneisen - Passed the CAN SLIM® Master's Exam
Stocks pushed higher on Monday. The Dow gained 165 points to 17828. The S&P 500 was up 24 points to 2104. The NASDAQ advanced 73 points to 5127. Volume totals were reported lighter on the NYSE and on the Nasdaq exchange. Breadth was positive as advancers led decliners by more than a 4-1 margin on the NYSE and nearly 4-1 on the Nasdaq exchange. There were 50 stocks that made it onto the BreakOuts Page, up from the prior session total of 45 high-ranked companies from the Leaders List that made a new 52-week high. New 52-week highs outnumbered new 52-week lows on the NYSE and on the Nasdaq exchange. There were gains for 5 of the 8 high-ranked companies currently on the Featured Stocks Page.
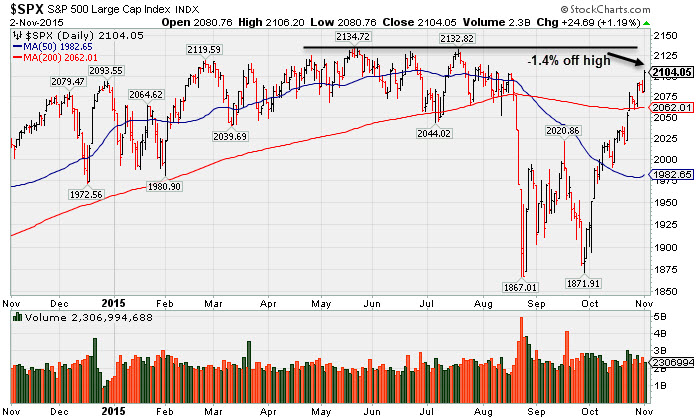
PICTURED: The S&P 500 Index finished -1.4% off its all-time high.
The major indices have established a confirmed uptrend (M criteria). Coupled with a reassuring expansion in leadership (stocks hitting new 52-week highs) big gains helped the S&P 500 Index, Dow Jones Industrial Average, and Nasdaq Composite Index unanimously rally above their respective 200-day moving average lines. The market environment is technically in healthier shape. New buying efforts may be considered in stocks meeting all key criteria, and some new candidates have met the strict guidelines of the fact-based investment system in the recent recovery.
The major averages rallied on the heels of their best monthly performance since 2011 in October, investors focused on economic data and earnings as well as a flurry of M&A activity. In economic news, Markit and ISM manufacturing numbers were both slightly above analyst projections, as was September construction spending. M&A news remains at the forefront with Dyax (DYAX +28.41%) surging after agreeing to a takeover offer from Britain’s Shire (SHPG -1.04%). In earnings, Visa (V -3.04%) fell after missing profit forecasts but slightly exceeding revenue expectations. The company also confirmed the expected $23 billion purchase of Visa Europe. Este Lauder (EL +8.09%) rose after exceeding analyst projections on both the top and bottom line. All ten sectors in the S&P finished higher on Monday. The energy, financials and healthcare sectors paced the gains, with each climbing more than 1.5%. Treasuries moved lower on the day. The benchmark U.S. 10-year Treasury note lost 10/32 to yield 2.18%. Commodities were mostly lower. WTI crude was off 1.0% to $46.12/barrel while COMEX gold declined 0.7% to $1133.40/ounce. In FOREX, the dollar was little changed with mild weakness against the euro and strength against the yen. The Featured Stocks Page saw some new names recently added. The most current notes with headline links help members have access to more detailed letter-by-letter analysis including price/volume graphs annotated by our experts. See the Premium Member Homepage for archives to all prior pay reports. |
 Kenneth J. Gruneisen started out as a licensed stockbroker in August 1987, a couple of months prior to the historic stock market crash that took the Dow Jones Industrial Average down -22.6% in a single day. He has published daily fact-based fundamental and technical analysis on high-ranked stocks online for two decades. Through FACTBASEDINVESTING.COM, Kenneth provides educational articles, news, market commentary, and other information regarding proven investment systems that work in good times and bad.
Comments contained in the body of this report are technical opinions only and are not necessarily those of Gruneisen Growth Corp. The material herein has been obtained from sources believed to be reliable and accurate, however, its accuracy and completeness cannot be guaranteed. Our firm, employees, and customers may effect transactions, including transactions contrary to any recommendation herein, or have positions in the securities mentioned herein or options with respect thereto. Any recommendation contained in this report may not be suitable for all investors and it is not to be deemed an offer or solicitation on our part with respect to the purchase or sale of any securities. |
|
 |
Energy, Financial, and Tech Groups Rose
Kenneth J. Gruneisen - Passed the CAN SLIM® Master's Exam
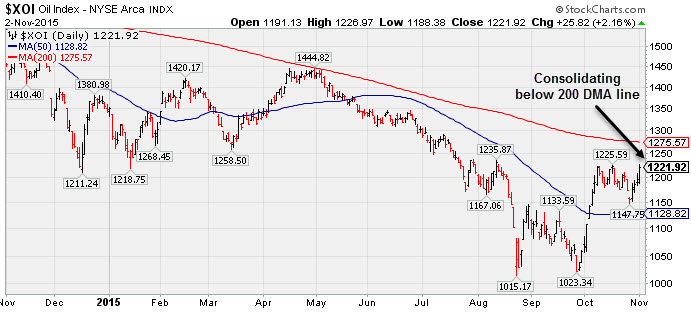
Financial shares had a positive influence on the major averages as the Broker/Dealer Index ($XBD +2.38%) and the Bank Index ($BKX +1.57%) both rose on Monday. The Retail Index ($RLX +0.32%) posted a small gain. The Biotechnology Index ($BTK +5.13%) was a standout gainer while the Semiconductor Index ($SOX +0.91%) and the Networking Index ($NWX +0.87%) each posted a modest gain. Energy-related shares had a positive bias as the Oil Services Index ($OSX +3.23%) and the Integrated Oil Index ($XOI +2.16%) both posted solid gains, and the Gold & Silver Index ($XAU +0.91%) tallied a smaller gain.PICTURED: The Integrated Oil Index ($XOI +2.16%) is consolidating below its 200-day moving average (DMA) line.
| Oil Services |
$OSX |
182.98 |
+5.72 |
+3.23% |
-13.23% |
| Integrated Oil |
$XOI |
1,221.92 |
+25.82 |
+2.16% |
-9.36% |
| Semiconductor |
$SOX |
668.53 |
+6.01 |
+0.91% |
-2.67% |
| Networking |
$NWX |
399.92 |
+3.43 |
+0.87% |
+11.73% |
| Broker/Dealer |
$XBD |
180.36 |
+4.20 |
+2.38% |
-2.32% |
| Retail |
$RLX |
1,291.75 |
+4.07 |
+0.32% |
+25.08% |
| Gold & Silver |
$XAU |
51.92 |
+0.47 |
+0.91% |
-24.51% |
| Bank |
$BKX |
73.72 |
+1.14 |
+1.57% |
-0.73% |
| Biotech |
$BTK |
3,700.53 |
+180.60 |
+5.13% |
+7.60% |
|
|
|
 |
Prior Highs Define Support Following Recent Breakout
Kenneth J. Gruneisen - Passed the CAN SLIM® Master's Exam
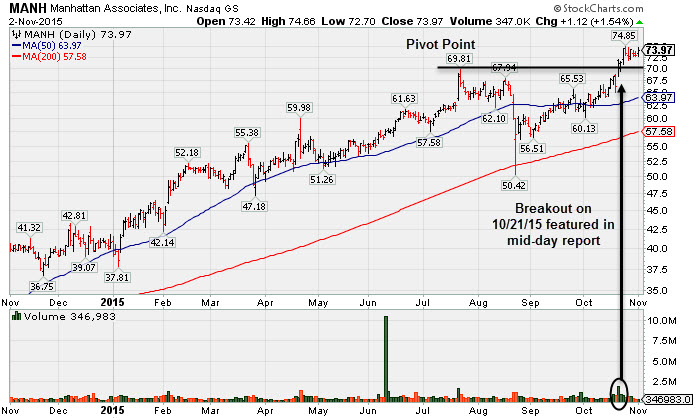
Manhattan Associates Inc (MANH +$1.12 or +1.54% to $73.97) is consolidating above its "max buy" level following volume-driven gains. Prior highs in the $69 area define initial support to watch on pullbacks. It was last shown in this FSU section on 10/21/15 with an annotated graph under the headline, "Finished Strong With Gain Backed By Heavy Volume". The considerable gain helped it rise from a choppy 3-month base. It was highlighted in yellow with pivot point cited based on its 7/23/15 high plus 10 cents in the 10/21/15 mid-day report (read here). It reported earnings +31% on +13% sales revenues for the Sep '15 quarter, its 4th consecutive quarterly comparison above the +25% minimum earnings guideline (C criteria). Earnings were +25%, +31%, +28%, and +31% in the Dec '14, Mar, Jun, and Sep '15 quarters, respectively, versus the year ago periods. Sales revenues rose +21%, +18%, +14%, and +13% during that same span. The Computer Software group has shown a good leadership (L criteria). MANH has a 98 Earnings Per Share (EPS) rating. Its Relative Strength line recently rallied to new highs ahead of the shares' move into new high territory, a reassuring sign. It has a small supply of 73.1 million shares (S criteria) outstanding, which can contribute to volatility in the event of institutional buying or selling. The number of top-rated funds owning its share rose from 422 in Dec '14 to 512 in Sep '15, a reassuring sign concerning the I criteria. Its current Up/Down Volume Ratio of 1.6 is an unbiased indication its shares have been under accumulation over the past 50 days. MANH was previously noted on 7/22/15 - "Patient investors may watch for a new base or secondary buy point to possibly develop and be noted in the weeks ahead. Following a downturn in its FY '09 earnings (A criteria) it has shown strong earnings growth." Charts courtesy www.stockcharts.com
 |
|
|
Color Codes Explained :
Y - Better candidates highlighted by our
staff of experts.
G - Previously featured
in past reports as yellow but may no longer be buyable under the
guidelines.
***Last / Change / Volume data in this table is the closing quote data***
Symbol/Exchange
Company Name
Industry Group |
PRICE |
CHANGE
(%Change) |
Day High |
Volume
(% DAV)
(% 50 day avg vol) |
52 Wk Hi
% From Hi |
Featured
Date |
Price
Featured |
Pivot Featured |
|
Max Buy |
SFNC
-
NASDAQ
Simmons First Natl Cp A
BANKING - Regional - Southeast Banks
|
$52.96
|
+1.42
2.76% |
$52.98
|
140,657
72.13% of 50 DAV
50 DAV is 195,000
|
$54.00
-1.93%
|
10/22/2015
|
$50.13
|
PP = $48.98
|
|
MB = $51.43
|
Most Recent Note - 10/28/2015 5:57:02 PM
G - Color code was changed to green after rallying well above its "max buy" level. Prior highs in the $48 area define initial support to watch on pullbacks.
>>> FEATURED STOCK ARTICLE : Triple Average Volume Behind Spike to New HIgh Territory - 10/22/2015 |
View all notes |
Set NEW NOTE alert |
Company Profile |
SEC
News |
Chart |
Request a new note
C
A
S
I |
MANH
-
NASDAQ
Manhattan Associates Inc
COMPUTER SOFTWARE and SERVICES - Technical and System Software
|
$73.97
|
+1.12
1.54% |
$74.66
|
346,641
61.57% of 50 DAV
50 DAV is 563,000
|
$74.85
-1.18%
|
10/21/2015
|
$69.18
|
PP = $69.91
|
|
MB = $73.41
|
 Most Recent Note - 11/2/2015 5:34:01 PM
G - Consolidating above "max buy" level following volume-driven gains. Prior highs in the $69 area define initial support to watch on pullbacks. See the latest FSU analysis for more details and a new annotated graph.
>>> FEATURED STOCK ARTICLE : Prior Highs Define Support Following Recent Breakout - 11/2/2015 |
View all notes |
Set NEW NOTE alert |
Company Profile |
SEC
News |
Chart |
Request a new note
C
A
S
I |
JBSS
-
NASDAQ
Sanfilippo John B & Son
FOOD and BEVERAGE - Processed and Packaged Goods
|
$60.01
|
-4.71
-7.28% |
$66.29
|
135,265
182.79% of 50 DAV
50 DAV is 74,000
|
$65.28
-8.07%
|
10/27/2015
|
$56.00
|
PP = $57.33
|
|
MB = $60.20
|
Most Recent Note - 11/2/2015 5:35:32 PM
G - Pulled back with heavy volume today following 4 consecutive volume-driven gains. Prior highs in the $57 area define initial support to watch on pullbacks.
>>> FEATURED STOCK ARTICLE : Small Supply in Food Firm Tecnically Breaking Out - 10/27/2015 |
View all notes |
Set NEW NOTE alert |
Company Profile |
SEC
News |
Chart |
Request a new note
C
A
S
I |
ULTI
-
NASDAQ
Ultimate Software Group
INTERNET - Internet Software and Services
|
$205.09
|
+0.74
0.36% |
$207.08
|
233,394
87.09% of 50 DAV
50 DAV is 268,000
|
$209.60
-2.15%
|
10/28/2015
|
$204.38
|
PP = $195.28
|
|
MB = $205.04
|
Most Recent Note - 10/29/2015 6:39:10 PM
Y - Volume-driven gains above the pivot point clinched a technical buy signal. Reported earnings +38% on +22% sales revenues for the Sep '15 quarter. See the latest FSU analysis for more details and an annotated graph.
>>> FEATURED STOCK ARTICLE : Technical Breakout Backed By Heavy Volume - 10/28/2015 |
View all notes |
Set NEW NOTE alert |
Company Profile |
SEC
News |
Chart |
Request a new note
C
A
S
I |
ULTA
-
NASDAQ
Ulta Salon Cosm & Frag
SPECIALTY RETAIL - Specialty Retail, Other
|
$172.76
|
-1.20
-0.69% |
$175.78
|
611,169
64.00% of 50 DAV
50 DAV is 955,000
|
$176.77
-2.27%
|
10/22/2015
|
$168.02
|
PP = $170.31
|
|
MB = $178.83
|
Most Recent Note - 10/29/2015 6:36:47 PM
Y - Posted low volume gains above its pivot point for its best-ever close and no resistance remains due to overhead supply. Gains above the pivot point backed by at least +40% above average volume may trigger a proper technical buy signal. See the latest FSU analysis for more details and a new annotated graph.
>>> FEATURED STOCK ARTICLE : Recent Gains Lacked Volume Indicative of Institutional Buying Demand - 10/29/2015 |
View all notes |
Set NEW NOTE alert |
Company Profile |
SEC
News |
Chart |
Request a new note
C
A
S
I |
Symbol/Exchange
Company Name
Industry Group |
PRICE |
CHANGE
(%Change) |
Day High |
Volume
(% DAV)
(% 50 day avg vol) |
52 Wk Hi
% From Hi |
Featured
Date |
Price
Featured |
Pivot Featured |
|
Max Buy |
FLTX
-
NYSE
Fleetmatics Group Plc
Computer Sftwr-Enterprse
|
$55.37
|
-0.29
-0.52% |
$56.50
|
326,315
86.33% of 50 DAV
50 DAV is 378,000
|
$57.15
-3.11%
|
9/23/2015
|
$51.26
|
PP = $52.55
|
|
MB = $55.18
|
Most Recent Note - 10/30/2015 5:25:56 PM
G - Color code is changed to green after rising back above its "max buy" level. Prior highs in the $52 area acted as support during its consolidation. Earnings news is due on 11/03/15. See the latest FSU analysis for more details and a new annotated graph.
>>> FEATURED STOCK ARTICLE : Earnings News Due May Contribute to Volatility Next Week - 10/30/2015 |
View all notes |
Set NEW NOTE alert |
Company Profile |
SEC
News |
Chart |
Request a new note
C
A
S
I |
LXFT
-
NYSE
Luxoft Holding Inc Cl A
Comp Sftwr-Spec Enterprs
|
$69.78
|
+3.14
4.71% |
$70.50
|
408,050
180.55% of 50 DAV
50 DAV is 226,000
|
$70.94
-1.64%
|
10/22/2015
|
$66.65
|
PP = $68.95
|
|
MB = $72.40
|
Most Recent Note - 11/2/2015 5:36:18 PM
Y - Posted a solid gain today with higher volume. Gap up on 10/23/15 and new 52-week high triggered a new (or add-on) technical buy signal. New pivot point cited was based on its 9/17/15 high plus 10 cents.
>>> FEATURED STOCK ARTICLE : Retreat Into Prior Base Following Latest Breakout - 10/26/2015 |
View all notes |
Set NEW NOTE alert |
Company Profile |
SEC
News |
Chart |
Request a new note
C
A
S
I |
NHTC
-
NASDAQ
Natural Health Trends
Cosmetics/Personal Care
|
$52.79
|
+3.53
7.17% |
$53.87
|
692,196
223.29% of 50 DAV
50 DAV is 310,000
|
$49.90
5.79%
|
10/23/2015
|
$42.12
|
PP = $44.85
|
|
MB = $47.09
|
Most Recent Note - 11/2/2015 12:47:37 PM
G - Rallying further into new high territory above its "max buy" level with today's 4th consecutive volume-driven gains. Disciplined investors avoid chasing stocks extended more than +5% above prior highs and always limit losses by selling any stock that falls more than -7% from their purchase price.
>>> FEATURED STOCK ARTICLE : Finished Strong But Approaching Prior Resistance - 10/23/2015 |
View all notes |
Set NEW NOTE alert |
Company Profile |
SEC
News |
Chart |
Request a new note
C
A
S
I |
|
|
|
THESE ARE NOT BUY RECOMMENDATIONS!
Comments contained in the body of this report are technical
opinions only. The material herein has been obtained
from sources believed to be reliable and accurate, however,
its accuracy and completeness cannot be guaranteed.
This site is not an investment advisor, hence it does
not endorse or recommend any securities or other investments.
Any recommendation contained in this report may not
be suitable for all investors and it is not to be deemed
an offer or solicitation on our part with respect to
the purchase or sale of any securities. All trademarks,
service marks and trade names appearing in this report
are the property of their respective owners, and are
likewise used for identification purposes only.
This report is a service available
only to active Paid Premium Members.
You may opt-out of receiving report notifications
at any time. Questions or comments may be submitted
by writing to Premium Membership Services 665 S.E. 10 Street, Suite 201 Deerfield Beach, FL 33441-5634 or by calling 1-800-965-8307
or 954-785-1121.
|
|
|