You are not logged in.
This means you
CAN ONLY VIEW reports that were published prior to Friday, April 11, 2025.
You
MUST UPGRADE YOUR MEMBERSHIP if you want to see any current reports.
AFTER MARKET UPDATE - TUESDAY, NOVEMBER 10TH, 2015
Previous After Market Report Next After Market Report >>>
|
|
|
|
DOW |
+27.73 |
17,758.21 |
+0.16% |
|
Volume |
823,223,880 |
-13% |
|
Volume |
1,739,536,330 |
+4% |
|
NASDAQ |
-12.06 |
5,083.24 |
-0.24% |
|
Advancers |
1,748 |
57% |
|
Advancers |
1,398 |
48% |
|
S&P 500 |
+3.14 |
2,081.72 |
+0.15% |
|
Decliners |
1,330 |
43% |
|
Decliners |
1,491 |
52% |
|
Russell 2000 |
+3.26 |
1,187.70 |
+0.28% |
|
52 Wk Highs |
33 |
|
|
52 Wk Highs |
82 |
|
|
S&P 600 |
+1.70 |
699.56 |
+0.24% |
|
52 Wk Lows |
89 |
|
|
52 Wk Lows |
103 |
|
|
 |
Leadership Thinned and Major Averages Ended Mixed
Kenneth J. Gruneisen - Passed the CAN SLIM® Master's Exam
Stocks were mixed on Tuesday. The Dow was up 27 points to 17758. The S&P 500 was 3 points higher to 2081. The NASDAQ slid 12 points to 5083. Volume totals were reported mixed, lighter on the NYSE and higher on the Nasdaq exchange. Advancers led decliners by almost a 3-2 margin on the NYSE but decliners narrowly led advancers on the Nasdaq exchange. Leadership contracted as there were 32 high-ranked companies from the Leaders List that made new 52-week highs and were listed on the BreakOuts Page, down from 47 on the prior session. New 52-week lows outnumbered new 52-week highs on the Nasdaq exchange and on the NYSE. There were 8 gainers from the 11 high-ranked companies currently on the Featured Stocks Page.
PICTURED: The Nasdaq Composite Index is perched only -2.83% off its all-time high.
The major indices have established a confirmed uptrend (M criteria). Coupled with a reassuring expansion in leadership (stocks hitting new 52-week highs) big gains helped the S&P 500 Index, Dow Jones Industrial Average, and Nasdaq Composite Index unanimously rally above their respective 200-day moving average lines. The market environment is technically in healthier shape. New buying efforts may be considered in stocks meeting all key criteria, and some new candidates have met the strict guidelines of the fact-based investment system in the recent recovery.
The major averages fluctuated on a light day of market news. An economic release showed that wholesale inventories increased more than expected in September. A separate report showed import prices fell 0.5% in October. Overseas, concerns over global growth reappeared after a report showed a lower than expected rise in Chinese inflation.In earnings news, D.R. Horton (DHI +8.27%) rose after slightly beating analyst earnings expectations and raising its dividend. SunEdison (SUNE -22.03%) fell sharply after announcing a change in strategy due to turbulence in the energy markets. Gap (GPS -1.44%) edged lower after the retailer reported declining sales. Seven out of ten sectors in the S&P 500 finished higher on the session. Apple (AAPL -3.15%) led tech stocks lower after negative analyst commentary. The materials sector also underperformed while consumer discretionary and utilities stocks paced the gains. Treasuries finished slightly higher. The benchmark 10-year Treasury note added 3/32 to yield 2.33%. In commodities, WTI crude advanced 0.6% to $44.15/barrel. Gold ebbed 0.1% to $1091.90/ounce on the COMEX. In FOREX, the dollar gained modestly with strength against the euro.h The Featured Stocks Page saw some new names recently added. The most current notes with headline links help members have access to more detailed letter-by-letter analysis including price/volume graphs annotated by our experts. See the Premium Member Homepage for archives to all prior pay reports.
|
 Kenneth J. Gruneisen started out as a licensed stockbroker in August 1987, a couple of months prior to the historic stock market crash that took the Dow Jones Industrial Average down -22.6% in a single day. He has published daily fact-based fundamental and technical analysis on high-ranked stocks online for two decades. Through FACTBASEDINVESTING.COM, Kenneth provides educational articles, news, market commentary, and other information regarding proven investment systems that work in good times and bad.
Comments contained in the body of this report are technical opinions only and are not necessarily those of Gruneisen Growth Corp. The material herein has been obtained from sources believed to be reliable and accurate, however, its accuracy and completeness cannot be guaranteed. Our firm, employees, and customers may effect transactions, including transactions contrary to any recommendation herein, or have positions in the securities mentioned herein or options with respect thereto. Any recommendation contained in this report may not be suitable for all investors and it is not to be deemed an offer or solicitation on our part with respect to the purchase or sale of any securities. |
|
 |
Retail and Biotech Indexes Rose
Kenneth J. Gruneisen - Passed the CAN SLIM® Master's Exam
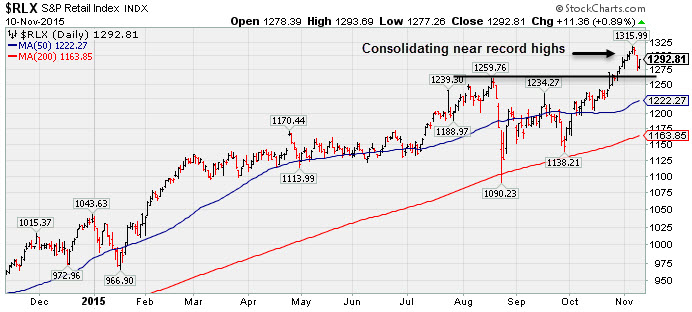
The Retail Index ($RLX +0.89%) had a positive influence on the major averages while the Bank Index ($BKX +0.22%) eked out a small gain but the Broker/Dealer Index ($XBD -0.72%) had a negative influence. The Networking Index ($NWX -1.26%) and the Semiconductor Index ($SOX -1.79%) pressured the tech sector while the Biotechnology Index ($BTK +0.81%) posted a gain. The Integrated Oil Index ($XOI +0.03%) and the Oil Services Index ($OSX -0.14%) both ended virtually flat. The Gold & Silver Index ($XAU -2.91%) was a standout decliner. PICTURED: The Retail Index ($RLX +0.89%) is consolidating after rallying into new record high territory.
| Oil Services |
$OSX |
181.13 |
-0.25 |
-0.14% |
-14.10% |
| Integrated Oil |
$XOI |
1,215.77 |
+0.33 |
+0.03% |
-9.82% |
| Semiconductor |
$SOX |
657.96 |
-11.98 |
-1.79% |
-4.21% |
| Networking |
$NWX |
388.52 |
-4.96 |
-1.26% |
+8.54% |
| Broker/Dealer |
$XBD |
184.49 |
-1.35 |
-0.72% |
-0.08% |
| Retail |
$RLX |
1,292.81 |
+11.36 |
+0.89% |
+25.18% |
| Gold & Silver |
$XAU |
45.68 |
-1.37 |
-2.91% |
-33.59% |
| Bank |
$BKX |
75.97 |
+0.17 |
+0.22% |
+2.30% |
| Biotech |
$BTK |
3,745.67 |
+30.23 |
+0.81% |
+8.91% |
|
|
|
 |
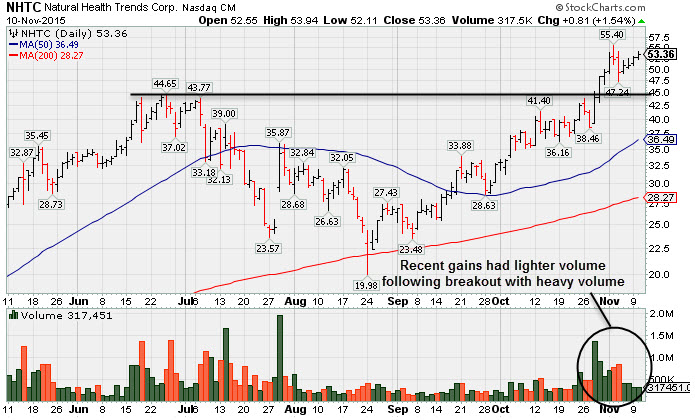
Wedging Higher Following Volume-Driven Breakout
Kenneth J. Gruneisen - Passed the CAN SLIM® Master's Exam
Natural Health Trends (NHTC +$0.81 or +1.54% to $53.36) is perched near its all-time high after 4 consecutive gains on lighter volume totals. It faces no overhead supply up to act as resistance. Disciplined investors avoid chasing stocks extended more than +5% above prior highs and always limit losses by selling any stock that falls more than -7% from their purchase price. Volume-driven gains triggered a technical buy signal after it was last shown in this FSU section on 10/23/15 with an annotated graph under the headline, "Finished Strong But Approaching Prior Resistance". It was highlighted in yellow with new pivot point cited based on its 6/25/15 high plus 10 cents in the 10/23/15 mid-day report (read here). Convincing signs of fresh institutional buying demand might mark the beginning of a substantial new leg up in price. The high-ranked Cosmetics / Personal Care firm reported Sep '15 quarterly earnings +181% on +154% sales revenues versus the year ago period, continuing its track record of strong sales and earnings increases well above the +25% minimum guideline (C criteria). Earnings rose +767%, +513%, +250%, +221%, +108%, and +100% in the Mar, Jun, Sep, Dec '14, Mar and Jun '15 quarters, versus the year earlier periods, respectively. Sales revenues rose +168%, +223%, +124%, 85%, +76%, and +104% during than span. There are 119 top-rated funds reportedly owning an interest through Sep '15, up from only 2 in Dec '14, a reassuring sign concerning the I criteria.It has a Timeliness Rating of A and a Sponsorship Rating of C. The current Up/Down Volume Ratio of 1.6 also is an unbiased indication its shares have been under accumulation over the past 50 days. |
|
|
Color Codes Explained :
Y - Better candidates highlighted by our
staff of experts.
G - Previously featured
in past reports as yellow but may no longer be buyable under the
guidelines.
***Last / Change / Volume data in this table is the closing quote data***
Symbol/Exchange
Company Name
Industry Group |
PRICE |
CHANGE
(%Change) |
Day High |
Volume
(% DAV)
(% 50 day avg vol) |
52 Wk Hi
% From Hi |
Featured
Date |
Price
Featured |
Pivot Featured |
|
Max Buy |
PNFP
-
NASDAQ
Pinnacle Financial Prtnr
BANKING - Regional - Southeast Banks
|
$55.99
|
-0.34
-0.60% |
$56.89
|
170,377
98.48% of 50 DAV
50 DAV is 173,000
|
$57.99
-3.45%
|
11/6/2015
|
$56.34
|
PP = $55.58
|
|
MB = $58.36
|
Most Recent Note - 11/9/2015 5:41:45 PM
Y - Pulled back today after triggering a technical buy signal on the prior session. Found support at its 200 DMA line during its consolidation in prior months. Reported earnings +27% on +35% sales revenues for the Sep '15 quarter, its 3rd consecutive quarterly comparison with earnings above the +25% minimum guideline (C criteria) helping it better match the fact-based investment system's guidelines. See the latest FSU analysis for more details and a new annotated graph.
>>> FEATURED STOCK ARTICLE : Perched at High Following Breakout - 11/9/2015 |
View all notes |
Set NEW NOTE alert |
Company Profile |
SEC
News |
Chart |
Request a new note
C
A
S
I |
SFNC
-
NASDAQ
Simmons First Natl Cp A
BANKING - Regional - Southeast Banks
|
$56.65
|
+1.30
2.35% |
$56.70
|
180,196
91.47% of 50 DAV
50 DAV is 197,000
|
$56.95
-0.53%
|
10/22/2015
|
$50.13
|
PP = $48.98
|
|
MB = $51.43
|
Most Recent Note - 11/6/2015 3:07:23 PM
G - Rallying further above its "max buy" level today for another new 52-week high. Prior highs in the $48 area define initial support to watch on pullbacks.
>>> FEATURED STOCK ARTICLE : Slightly Extended From Prior Base After Breakout - 11/3/2015 |
View all notes |
Set NEW NOTE alert |
Company Profile |
SEC
News |
Chart |
Request a new note
C
A
S
I |
MANH
-
NASDAQ
Manhattan Associates Inc
COMPUTER SOFTWARE and SERVICES - Technical and System Software
|
$75.12
|
+0.79
1.06% |
$75.26
|
489,131
92.64% of 50 DAV
50 DAV is 528,000
|
$76.49
-1.79%
|
10/21/2015
|
$69.18
|
PP = $69.91
|
|
MB = $73.41
|
Most Recent Note - 11/9/2015 5:43:22 PM
G - Pulled back on average volume after hitting a new high on the prior session. Prior highs in the $69 area define initial support to watch on pullbacks.
>>> FEATURED STOCK ARTICLE : Prior Highs Define Support Following Recent Breakout - 11/2/2015 |
View all notes |
Set NEW NOTE alert |
Company Profile |
SEC
News |
Chart |
Request a new note
C
A
S
I |
JBSS
-
NASDAQ
Sanfilippo John B & Son
FOOD and BEVERAGE - Processed and Packaged Goods
|
$61.11
|
-0.10
-0.16% |
$62.28
|
48,258
66.11% of 50 DAV
50 DAV is 73,000
|
$66.29
-7.81%
|
10/27/2015
|
$56.00
|
PP = $57.33
|
|
MB = $60.20
|
Most Recent Note - 11/6/2015 1:19:41 PM
G - Color code was changed to green after rallying above its "max buy" level. Prior highs in the $57 area define initial support to watch on pullbacks.
>>> FEATURED STOCK ARTICLE : Small Supply in Food Firm Tecnically Breaking Out - 10/27/2015 |
View all notes |
Set NEW NOTE alert |
Company Profile |
SEC
News |
Chart |
Request a new note
C
A
S
I |
STMP
-
NASDAQ
Stamps.com Inc
INTERNET - Internet Software and Services
|
$100.14
|
+2.44
2.50% |
$100.29
|
378,718
137.22% of 50 DAV
50 DAV is 276,000
|
$106.43
-5.91%
|
11/6/2015
|
$100.75
|
PP = $88.97
|
|
MB = $93.42
|
Most Recent Note - 11/9/2015 1:14:11 PM
G - Pulling back today after quickly getting very extended from prior highs with a "breakaway gap" backed by nearly 8 times average volume on the prior session. Disciplined investors avoid chasing extended stocks. See the latest FSU analysis for more details and an annotated graph.
>>> FEATURED STOCK ARTICLE : Big Breakaway Gap With Heavy Volume Following Earnings News - 11/6/2015 |
View all notes |
Set NEW NOTE alert |
Company Profile |
SEC
News |
Chart |
Request a new note
C
A
S
I |
Symbol/Exchange
Company Name
Industry Group |
PRICE |
CHANGE
(%Change) |
Day High |
Volume
(% DAV)
(% 50 day avg vol) |
52 Wk Hi
% From Hi |
Featured
Date |
Price
Featured |
Pivot Featured |
|
Max Buy |
ULTI
-
NASDAQ
Ultimate Software Group
INTERNET - Internet Software and Services
|
$205.72
|
-2.43
-1.17% |
$206.36
|
337,210
133.81% of 50 DAV
50 DAV is 252,000
|
$216.27
-4.88%
|
10/28/2015
|
$204.38
|
PP = $195.28
|
|
MB = $205.04
|
Most Recent Note - 11/6/2015 1:21:22 PM
G - Color code is changed to green after rising above its "max buy" level. Prior highs in the $195 area define initial support to watch on pullbacks.
>>> FEATURED STOCK ARTICLE : Technical Breakout Backed By Heavy Volume - 10/28/2015 |
View all notes |
Set NEW NOTE alert |
Company Profile |
SEC
News |
Chart |
Request a new note
C
A
S
I |
ULTA
-
NASDAQ
Ulta Salon Cosm & Frag
SPECIALTY RETAIL - Specialty Retail, Other
|
$174.08
|
+2.52
1.47% |
$174.10
|
370,605
49.75% of 50 DAV
50 DAV is 745,000
|
$176.77
-1.52%
|
10/22/2015
|
$168.02
|
PP = $170.31
|
|
MB = $178.83
|
 Most Recent Note - 11/10/2015 7:23:04 PM
Y - Posted a gain today with light volume, ending within close striking distance of its all-time high. No resistance remains due to overhead supply, however, its has not posted a gain above the pivot point backed by at least +40% above average volume, and a convincing gain is still needed to trigger a proper technical buy signal.
>>> FEATURED STOCK ARTICLE : Recent Gains Lacked Volume Indicative of Institutional Buying Demand - 10/29/2015 |
View all notes |
Set NEW NOTE alert |
Company Profile |
SEC
News |
Chart |
Request a new note
C
A
S
I |
FLTX
-
NYSE
Fleetmatics Group Plc
Computer Sftwr-Enterprse
|
$60.70
|
+1.06
1.78% |
$61.53
|
492,561
119.55% of 50 DAV
50 DAV is 412,000
|
$60.50
0.33%
|
9/23/2015
|
$51.26
|
PP = $52.55
|
|
MB = $55.18
|
Most Recent Note - 11/10/2015 7:17:30 PM
G - Hit another new high today, getting more extended from its prior base. Recent highs in the $56 area define near-term support to watch above its 50 DMA line ($51.85).
>>> FEATURED STOCK ARTICLE : Earnings News Due May Contribute to Volatility Next Week - 10/30/2015 |
View all notes |
Set NEW NOTE alert |
Company Profile |
SEC
News |
Chart |
Request a new note
C
A
S
I |
LXFT
-
NYSE
Luxoft Holding Inc Cl A
Comp Sftwr-Spec Enterprs
|
$70.30
|
+0.72
1.03% |
$70.51
|
192,295
87.81% of 50 DAV
50 DAV is 219,000
|
$71.92
-2.25%
|
10/22/2015
|
$66.65
|
PP = $68.95
|
|
MB = $72.40
|
Most Recent Note - 11/10/2015 7:20:40 PM
Y - Reported encouraging Sep '15 earnings and guidance after the close. It has been stubbornly holding its ground near its 52-week high, still trading below its "max buy" level.
>>> FEATURED STOCK ARTICLE : Retreat Into Prior Base Following Latest Breakout - 10/26/2015 |
View all notes |
Set NEW NOTE alert |
Company Profile |
SEC
News |
Chart |
Request a new note
C
A
S
I |
VBTX
-
NASDAQ
Veritex Holdings Inc
BANKING - Regional - Southwest Banks
|
$17.50
|
+0.25
1.45% |
$17.50
|
12,221
71.89% of 50 DAV
50 DAV is 17,000
|
$17.95
-2.51%
|
11/4/2015
|
$17.00
|
PP = $18.05
|
|
MB = $18.95
|
Most Recent Note - 11/10/2015 7:25:00 PM
Y - Finished at the session high as its light volume gain led to a best-ever close. Subsequent gains above its pivot point backed by at least +40% above average volume may trigger a technical buy signal.
>>> FEATURED STOCK ARTICLE : Perched Within Striking Distance of Highs in 19-Week Base - 11/4/2015 |
View all notes |
Set NEW NOTE alert |
Company Profile |
SEC
News |
Chart |
Request a new note
C
A
S
I |
Symbol/Exchange
Company Name
Industry Group |
PRICE |
CHANGE
(%Change) |
Day High |
Volume
(% DAV)
(% 50 day avg vol) |
52 Wk Hi
% From Hi |
Featured
Date |
Price
Featured |
Pivot Featured |
|
Max Buy |
NHTC
-
NASDAQ
Natural Health Trends
Cosmetics/Personal Care
|
$53.36
|
+0.81
1.54% |
$53.94
|
317,451
93.37% of 50 DAV
50 DAV is 340,000
|
$55.45
-3.77%
|
10/23/2015
|
$42.12
|
PP = $44.85
|
|
MB = $47.09
|
Most Recent Note - 11/10/2015 7:13:38 PM
G - Wedging higher with recent gains. Held its ground following a breakout and gains with much higher volume totals. See the latest FSU analysis for more details and a new annotated graph.
>>> FEATURED STOCK ARTICLE : Wedging Higher Following Volume-Driven Breakout - 11/10/2015 |
View all notes |
Set NEW NOTE alert |
Company Profile |
SEC
News |
Chart |
Request a new note
C
A
S
I |
|
|
|
THESE ARE NOT BUY RECOMMENDATIONS!
Comments contained in the body of this report are technical
opinions only. The material herein has been obtained
from sources believed to be reliable and accurate, however,
its accuracy and completeness cannot be guaranteed.
This site is not an investment advisor, hence it does
not endorse or recommend any securities or other investments.
Any recommendation contained in this report may not
be suitable for all investors and it is not to be deemed
an offer or solicitation on our part with respect to
the purchase or sale of any securities. All trademarks,
service marks and trade names appearing in this report
are the property of their respective owners, and are
likewise used for identification purposes only.
This report is a service available
only to active Paid Premium Members.
You may opt-out of receiving report notifications
at any time. Questions or comments may be submitted
by writing to Premium Membership Services 665 S.E. 10 Street, Suite 201 Deerfield Beach, FL 33441-5634 or by calling 1-800-965-8307
or 954-785-1121.
|
|
|