You are not logged in.
This means you
CAN ONLY VIEW reports that were published prior to Wednesday, April 9, 2025.
You
MUST UPGRADE YOUR MEMBERSHIP if you want to see any current reports.
AFTER MARKET UPDATE - WEDNESDAY, NOVEMBER 4TH, 2015
Previous After Market Report Next After Market Report >>>
|
|
|
|
DOW |
-50.57 |
17,867.58 |
-0.28% |
|
Volume |
909,115,620 |
-0% |
|
Volume |
1,926,963,560 |
+4% |
|
NASDAQ |
-2.65 |
5,142.48 |
-0.05% |
|
Advancers |
1,217 |
40% |
|
Advancers |
1,403 |
49% |
|
S&P 500 |
-7.48 |
2,102.31 |
-0.35% |
|
Decliners |
1,837 |
60% |
|
Decliners |
1,451 |
51% |
|
Russell 2000 |
-1.19 |
1,190.38 |
-0.10% |
|
52 Wk Highs |
100 |
|
|
52 Wk Highs |
83 |
|
|
S&P 600 |
-2.18 |
703.21 |
-0.31% |
|
52 Wk Lows |
30 |
|
|
52 Wk Lows |
46 |
|
|
 |
Indices Started Higher But Ended With Small Losses
Kenneth J. Gruneisen - Passed the CAN SLIM® Master's Exam
Stocks declined on Wednesday. The Dow lost 50 points to 17867. The S&P 500 was off 7 points to 2102. The NASDAQ fell 2 points to 5142. Volume totals were reported mixed, lighter on the NYSE and higher on the Nasdaq exchange. Breadth was negative as decliners led advancers by a 3-2 margin on the NYSE while the mix was fairly even on the Nasdaq exchange. There were 53 stocks that made it onto the BreakOuts Page, up from the prior session total of 49 high-ranked companies from the Leaders List that made a new 52-week high. New 52-week highs outnumbered new 52-week lows on the NYSE and on the Nasdaq exchange. There were gains for 6 of the 9 high-ranked companies currently on the Featured Stocks Page.
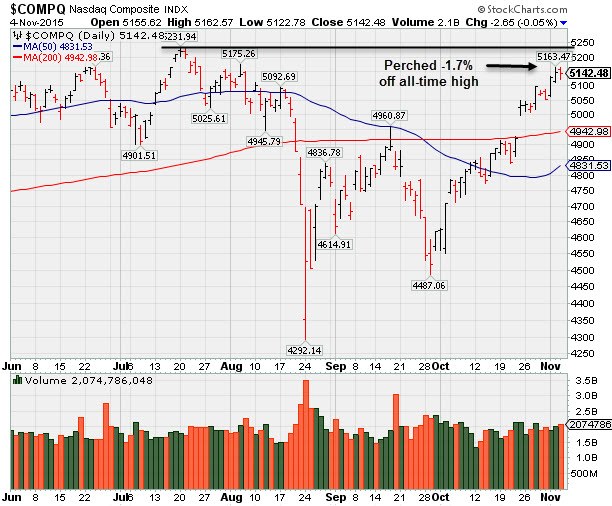
PICTURED: The Nasdaq Composite Index is perched -1.7% off its all-time high.
The major indices have established a confirmed uptrend (M criteria). Coupled with a reassuring expansion in leadership (stocks hitting new 52-week highs) big gains helped the S&P 500 Index, Dow Jones Industrial Average, and Nasdaq Composite Index unanimously rally above their respective 200-day moving average lines. The market environment is technically in healthier shape. New buying efforts may be considered in stocks meeting all key criteria, and some new candidates have met the strict guidelines of the fact-based investment system in the recent recovery.
The major averages retreaded amid earnings and economic news. In a speech to the House Financial Services Committee this morning, Federal Reserve Chairman Janet Yellen said that improving economic conditions are setting the tone for a December interest rate increase. In other economic news, ADP data released this morning shows that the labor market added 182,000 jobs in October, slightly above the 180,000 estimate. Another report showed a surprise increase in ISM non-manufacturing data. Nine out of ten sectors in the S&P 500 finished lower on the session. Energy and consumer discretionary stocks underperformed while the only sectors to advance were tech and utilities. In earnings, Tesla (TSLA +11.2%) rallied after the company released upbeat production projections for next year. Time Warner (TWX -6.6%) fell despite beating earnings expectations after management lowered forward guidance on their conference call. Treasuries moved lower after Janet Yellen’s comments this morning. The benchmark U.S. 10-year Treasury note declined 5/32 to yield 2.23%. Commodities were mostly lower. WTI crude slid 2.9% to $46.47/barrel while COMEX gold lost 0.6% to $1107.80/ounce. In FOREX, the dollar was higher with strength against all of its major peers The Featured Stocks Page saw some new names recently added. The most current notes with headline links help members have access to more detailed letter-by-letter analysis including price/volume graphs annotated by our experts. See the Premium Member Homepage for archives to all prior pay reports.
|
 Kenneth J. Gruneisen started out as a licensed stockbroker in August 1987, a couple of months prior to the historic stock market crash that took the Dow Jones Industrial Average down -22.6% in a single day. He has published daily fact-based fundamental and technical analysis on high-ranked stocks online for two decades. Through FACTBASEDINVESTING.COM, Kenneth provides educational articles, news, market commentary, and other information regarding proven investment systems that work in good times and bad.
Comments contained in the body of this report are technical opinions only and are not necessarily those of Gruneisen Growth Corp. The material herein has been obtained from sources believed to be reliable and accurate, however, its accuracy and completeness cannot be guaranteed. Our firm, employees, and customers may effect transactions, including transactions contrary to any recommendation herein, or have positions in the securities mentioned herein or options with respect thereto. Any recommendation contained in this report may not be suitable for all investors and it is not to be deemed an offer or solicitation on our part with respect to the purchase or sale of any securities. |
|
 |
Retail, Semiconductor, and Biotech Groups Rose
Kenneth J. Gruneisen - Passed the CAN SLIM® Master's Exam
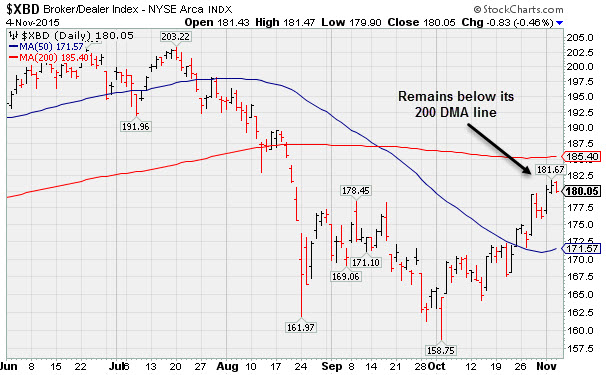
The Retail Index ($RLX +0.42%) posted a modest gain but financial shares had a negative influence on the major averages as the Broker/Dealer Index ($XBD -0.46%) and the Bank Index ($BKX -0.19%) both edged lower on Wednesday. The Semiconductor Index ($SOX +0.27%) and the Biotechnology Index ($BTK +0.61%) each posted a modest gain, meanwhile the Networking Index ($NWX -1.09%) slid. Energy-related shares had a negative bias as the Oil Services Index ($OSX -0.93%) and the Integrated Oil Index ($XOI -0.64%) both fell, and the Gold & Silver Index ($XAU -2.62%) ended solidly lower.PICTURED: The Broker/Dealer Index ($XBD -0.46%) remains below its 200-day moving average (DMA) line. Subsequent gains above that long-term average would be an encouraging sign.
| Oil Services |
$OSX |
186.97 |
-1.75 |
-0.93% |
-11.33% |
| Integrated Oil |
$XOI |
1,246.99 |
-7.99 |
-0.64% |
-7.50% |
| Semiconductor |
$SOX |
673.48 |
+1.79 |
+0.27% |
-1.95% |
| Networking |
$NWX |
398.55 |
-4.39 |
-1.09% |
+11.35% |
| Broker/Dealer |
$XBD |
180.05 |
-0.83 |
-0.46% |
-2.48% |
| Retail |
$RLX |
1,303.65 |
+5.40 |
+0.42% |
+26.23% |
| Gold & Silver |
$XAU |
50.49 |
-1.36 |
-2.62% |
-26.59% |
| Bank |
$BKX |
73.79 |
-0.10 |
-0.14% |
-0.63% |
| Biotech |
$BTK |
3,734.50 |
+22.62 |
+0.61% |
+8.59% |
|
|
|
 |
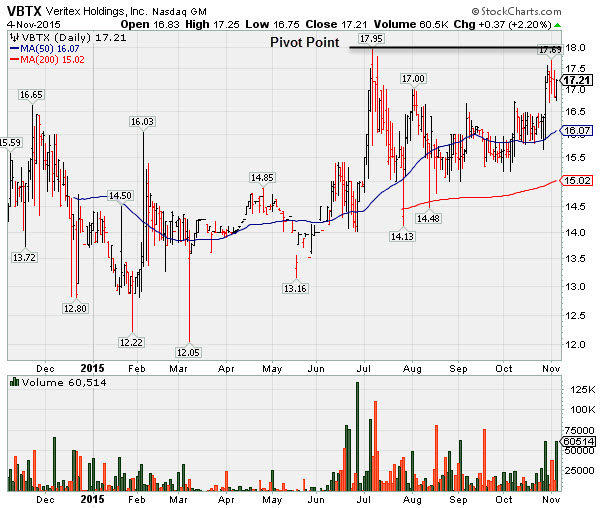
Perched Within Striking Distance of Highs in 19-Week Base
Kenneth J. Gruneisen - Passed the CAN SLIM® Master's Exam
Veritex Holdings Inc (VBTX +$0.37 or +2.20% to $17.21) was highlighted in yellow with pivot point cited based on its 7/08/15 high plus 10 cents in the earlier mid-day report (read here). It is consolidating within striking distance of a new 52-week high (N criteria). Subsequent gains above its pivot point backed by at least +40% above average volume may trigger a technical buy signal. The 200 DMA line recently acted as support. The number of top-rated funds owning its shares rose from 18 in Jun '15 to 20 in Sep '15. Its current Up/Down Volume Ratio of 1.2 is an unbiased indication its shares have been under slight accumulation over the past 50 days (I criteria). Its small supply of only 10.7 million shares (S criteria) in the public float can contribute top greater volatility in the event of institutional buying or selling. Reported earnings +64% on +31% sales revenue for the Sep '15 quarter and the past 8 quarterly comparisons earnings increases versus the year ago periods well above the +25% minimum guideline (C criteria). Its annual earnings history (A criteria) has been good, but its has a limited history since its Oct 2014 IPO at $13. Charts courtesy www.stockcharts.com
|
|
|
Color Codes Explained :
Y - Better candidates highlighted by our
staff of experts.
G - Previously featured
in past reports as yellow but may no longer be buyable under the
guidelines.
***Last / Change / Volume data in this table is the closing quote data***
Symbol/Exchange
Company Name
Industry Group |
PRICE |
CHANGE
(%Change) |
Day High |
Volume
(% DAV)
(% 50 day avg vol) |
52 Wk Hi
% From Hi |
Featured
Date |
Price
Featured |
Pivot Featured |
|
Max Buy |
SFNC
-
NASDAQ
Simmons First Natl Cp A
BANKING - Regional - Southeast Banks
|
$52.99
|
+0.75
1.44% |
$53.45
|
113,397
58.15% of 50 DAV
50 DAV is 195,000
|
$54.00
-1.87%
|
10/22/2015
|
$50.13
|
PP = $48.98
|
|
MB = $51.43
|
Most Recent Note - 11/3/2015 5:09:31 PM
G - Consolidating above its "max buy" level. Prior highs in the $48 area define initial support to watch on pullbacks. See the latest FSU analysis for more details and a new annotated graph.
>>> FEATURED STOCK ARTICLE : Slightly Extended From Prior Base After Breakout - 11/3/2015 |
View all notes |
Set NEW NOTE alert |
Company Profile |
SEC
News |
Chart |
Request a new note
C
A
S
I |
MANH
-
NASDAQ
Manhattan Associates Inc
COMPUTER SOFTWARE and SERVICES - Technical and System Software
|
$74.15
|
-0.79
-1.05% |
$75.49
|
475,566
89.06% of 50 DAV
50 DAV is 534,000
|
$75.48
-1.76%
|
10/21/2015
|
$69.18
|
PP = $69.91
|
|
MB = $73.41
|
Most Recent Note - 11/2/2015 5:34:01 PM
G - Consolidating above "max buy" level following volume-driven gains. Prior highs in the $69 area define initial support to watch on pullbacks. See the latest FSU analysis for more details and a new annotated graph.
>>> FEATURED STOCK ARTICLE : Prior Highs Define Support Following Recent Breakout - 11/2/2015 |
View all notes |
Set NEW NOTE alert |
Company Profile |
SEC
News |
Chart |
Request a new note
C
A
S
I |
JBSS
-
NASDAQ
Sanfilippo John B & Son
FOOD and BEVERAGE - Processed and Packaged Goods
|
$63.86
|
+2.71
4.43% |
$64.70
|
89,485
120.93% of 50 DAV
50 DAV is 74,000
|
$66.29
-3.67%
|
10/27/2015
|
$56.00
|
PP = $57.33
|
|
MB = $60.20
|
 Most Recent Note - 11/4/2015 7:21:30 PM
Y - Rallied for its 2nd best close today and its color code is changed to green after finishing well above its "max buy" level. Prior highs in the $57 area define initial support to watch on pullbacks.
>>> FEATURED STOCK ARTICLE : Small Supply in Food Firm Tecnically Breaking Out - 10/27/2015 |
View all notes |
Set NEW NOTE alert |
Company Profile |
SEC
News |
Chart |
Request a new note
C
A
S
I |
ULTI
-
NASDAQ
Ultimate Software Group
INTERNET - Internet Software and Services
|
$205.62
|
+1.18
0.58% |
$206.72
|
147,646
57.23% of 50 DAV
50 DAV is 258,000
|
$209.60
-1.90%
|
10/28/2015
|
$204.38
|
PP = $195.28
|
|
MB = $205.04
|
Most Recent Note - 11/4/2015 11:28:46 AM
Y - Holding its ground stubbornly and perched near its "max buy" level with volume totals cooling after 10/28/15 when it triggered a technical buy signal. Prior highs in the $195 area define initial support to watch on pullbacks.
>>> FEATURED STOCK ARTICLE : Technical Breakout Backed By Heavy Volume - 10/28/2015 |
View all notes |
Set NEW NOTE alert |
Company Profile |
SEC
News |
Chart |
Request a new note
C
A
S
I |
ULTA
-
NASDAQ
Ulta Salon Cosm & Frag
SPECIALTY RETAIL - Specialty Retail, Other
|
$170.12
|
-2.83
-1.64% |
$173.53
|
508,138
57.16% of 50 DAV
50 DAV is 889,000
|
$176.77
-3.76%
|
10/22/2015
|
$168.02
|
PP = $170.31
|
|
MB = $178.83
|
Most Recent Note - 11/4/2015 11:23:55 AM
Y - Perched near its all-time high and no resistance remains due to overhead supply. It has not posted a gain above the pivot point backed by at least +40% above average volume, and a convincing gain is still needed to trigger a proper technical buy signal.
>>> FEATURED STOCK ARTICLE : Recent Gains Lacked Volume Indicative of Institutional Buying Demand - 10/29/2015 |
View all notes |
Set NEW NOTE alert |
Company Profile |
SEC
News |
Chart |
Request a new note
C
A
S
I |
Symbol/Exchange
Company Name
Industry Group |
PRICE |
CHANGE
(%Change) |
Day High |
Volume
(% DAV)
(% 50 day avg vol) |
52 Wk Hi
% From Hi |
Featured
Date |
Price
Featured |
Pivot Featured |
|
Max Buy |
FLTX
-
NYSE
Fleetmatics Group Plc
Computer Sftwr-Enterprse
|
$57.90
|
+4.05
7.52% |
$59.73
|
1,542,884
409.25% of 50 DAV
50 DAV is 377,000
|
$57.15
1.31%
|
9/23/2015
|
$51.26
|
PP = $52.55
|
|
MB = $55.18
|
Most Recent Note - 11/4/2015 12:27:23 PM
G - Volume and volatility often increase near earnings news. Reported earnings +41% on +22% sales revenues for the Sep '15 quarter and rallied to a new high today, getting more extended from its prior base. Prior highs in the $52 area acted as support during its consolidation.
>>> FEATURED STOCK ARTICLE : Earnings News Due May Contribute to Volatility Next Week - 10/30/2015 |
View all notes |
Set NEW NOTE alert |
Company Profile |
SEC
News |
Chart |
Request a new note
C
A
S
I |
LXFT
-
NYSE
Luxoft Holding Inc Cl A
Comp Sftwr-Spec Enterprs
|
$70.52
|
+1.60
2.32% |
$71.92
|
486,997
225.46% of 50 DAV
50 DAV is 216,000
|
$70.94
-0.59%
|
10/22/2015
|
$66.65
|
PP = $68.95
|
|
MB = $72.40
|
Most Recent Note - 11/4/2015 11:20:49 AM
Y - No resistance remains due to overhead supply while hitting a new 52-week high today and approaching its "max buy" level. Due to report Sep '15 earnings after the close on Tuesday, 11/10/15.
>>> FEATURED STOCK ARTICLE : Retreat Into Prior Base Following Latest Breakout - 10/26/2015 |
View all notes |
Set NEW NOTE alert |
Company Profile |
SEC
News |
Chart |
Request a new note
C
A
S
I |
VBTX
-
NASDAQ
Veritex Holdings Inc
BANKING - Regional - Southwest Banks
|
$17.21
|
+0.37
2.20% |
$17.25
|
60,514
355.96% of 50 DAV
50 DAV is 17,000
|
$17.95
-4.12%
|
11/4/2015
|
$17.00
|
PP = $18.05
|
|
MB = $18.95
|
Most Recent Note - 11/4/2015 7:18:10 PM
Y - Posted a gain with above average volume. It was highlighted in yellow with pivot point cited based on its 7/08/15 high plus 10 cents. Subsequent gains above its pivot point backed by at least +40% above average volume may trigger a technical buy signal. The 200 DMA line recently acted as support. Reported earnings +64% on +31% sales revenue for the Sep '15 quarter and prior quarterly earnings increases were above the +25% minimum guideline (C criteria). See the latest FSU analysis for more details and a new annotated graph.
>>> FEATURED STOCK ARTICLE : Perched Within Striking Distance of Highs in 19-Week Base - 11/4/2015 |
View all notes |
Set NEW NOTE alert |
Company Profile |
SEC
News |
Chart |
Request a new note
C
A
S
I |
NHTC
-
NASDAQ
Natural Health Trends
Cosmetics/Personal Care
|
$49.32
|
-2.83
-5.43% |
$54.00
|
834,152
256.66% of 50 DAV
50 DAV is 325,000
|
$55.45
-11.06%
|
10/23/2015
|
$42.12
|
PP = $44.85
|
|
MB = $47.09
|
Most Recent Note - 11/4/2015 12:46:28 PM
G - Pulling back after a streak of volume-driven gains. Prior highs in the $44 area define initial support to watch following its recent breakout. Disciplined investors avoid chasing stocks extended more than +5% above prior highs and always limit losses by selling any stock that falls more than -7% from their purchase price.
>>> FEATURED STOCK ARTICLE : Finished Strong But Approaching Prior Resistance - 10/23/2015 |
View all notes |
Set NEW NOTE alert |
Company Profile |
SEC
News |
Chart |
Request a new note
C
A
S
I |
|
|
|
THESE ARE NOT BUY RECOMMENDATIONS!
Comments contained in the body of this report are technical
opinions only. The material herein has been obtained
from sources believed to be reliable and accurate, however,
its accuracy and completeness cannot be guaranteed.
This site is not an investment advisor, hence it does
not endorse or recommend any securities or other investments.
Any recommendation contained in this report may not
be suitable for all investors and it is not to be deemed
an offer or solicitation on our part with respect to
the purchase or sale of any securities. All trademarks,
service marks and trade names appearing in this report
are the property of their respective owners, and are
likewise used for identification purposes only.
This report is a service available
only to active Paid Premium Members.
You may opt-out of receiving report notifications
at any time. Questions or comments may be submitted
by writing to Premium Membership Services 665 S.E. 10 Street, Suite 201 Deerfield Beach, FL 33441-5634 or by calling 1-800-965-8307
or 954-785-1121.
|
|
|