You are not logged in.
This means you
CAN ONLY VIEW reports that were published prior to Wednesday, April 23, 2025.
You
MUST UPGRADE YOUR MEMBERSHIP if you want to see any current reports.
AFTER MARKET UPDATE - THURSDAY, SEPTEMBER 21ST, 2023
Previous After Market Report Next After Market Report >>>
|
|
|
|
DOW |
-370.46 |
34,070.42 |
-1.08% |
|
Volume |
854,739,350 |
+11% |
|
Volume |
5,037,686,800 |
+5% |
|
NASDAQ |
-245.14 |
13,223.98 |
-1.82% |
|
Advancers |
423 |
15% |
|
Advancers |
1,193 |
27% |
|
S&P 500 |
-72.20 |
4,330.00 |
-1.64% |
|
Decliners |
2,449 |
85% |
|
Decliners |
3,156 |
73% |
|
Russell 2000 |
-28.28 |
1,781.83 |
-1.56% |
|
52 Wk Highs |
15 |
|
|
52 Wk Highs |
29 |
|
|
S&P 600 |
-17.06 |
1,149.96 |
-1.46% |
|
52 Wk Lows |
207 |
|
|
52 Wk Lows |
450 |
|
|
Damaging losses have signaled a more serious market correction (M criteria). During market corrections, disciplined investors know to reduce exposure and raise cash by selling any weakening stocks on a case-by-case basis.
|
 |
Weak Action Signals a More Serious Market Correction
Kenneth J. Gruneisen - Passed the CAN SLIM® Master's Exam
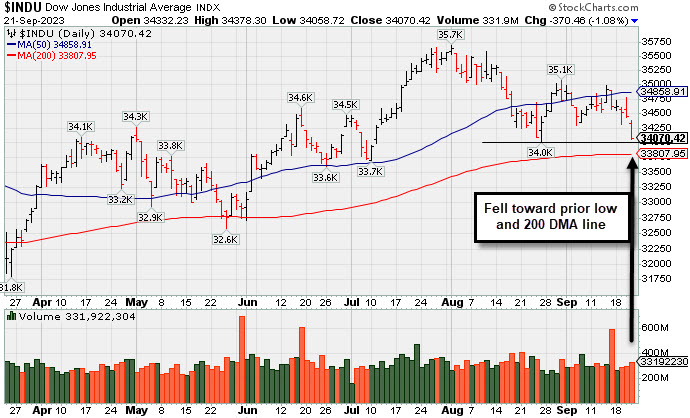
The major indices closed near the session lows with losses ranging from -1.1% to -1.8%. Volume totals reported were higher than the prior session on the NYSE and on the Nasdaq exchange, action indicative of increasing institutional selling pressure termed "distribution". Breadth was clearly negative as decliners led advancers by amore than a 5-1 margin on the NYSE and by almost a 3-1 margin on the Nasdaq exchange. Leadership evaporated as there were only 2 high-ranked companies from the Leaders List that hit a new 52-week high and were listed on the BreakOuts Page versus the total of 19 on the prior session. New 52-week lows totals expanded and solidly outnumbered shrinking new 52-week highs totals on the NYSE and on the Nasdaq exchange. The major indices are in a correction (M criteria). New buying efforts should be avoided until a new rally is confirmed by a solid follow-through day.
PICTURED: The Dow Jones Industrial Average fell toward the prior low and its 200-day moving average (DMA) line which define important near-term support to watch.
The major indices were under pressure from the start and faded further in the late afternoon. The biggest factor driving the weakness was the bump in market rates that started yesterday afternoon in response to the Fed's hawkish hold. The Fed indicated that it may not be done yet raising rates, that it is unlikely to cut rates in 2024 as much as the market had been thinking, and that the neutral rate might be higher than the estimated longer-run rate (2.5%). The 2-yr note yield settled at 5.14% after hitting 5.20% earlier. The 10-yr note yield rose another 13 basis points to 4.48%, its highest level since 2007.
Ten of the 11 S&P 500 sectors declined more than -1.0% today. The health care sector (-0.9%) saw the slimmest loss while the real estate sector (-3.5%) registered the sharpest decline. Paramount Global (PARA +0.45%) and FOX Corp. (FOXA +3.18%) logged gains after CNBC reported that a resolution to the Hollywood writers' strike may soon be reached. Splunk (SPLK +20.75%) gapped up and was a top performer after M&A news with Cisco (CSCO -3.89%).
|
 Kenneth J. Gruneisen started out as a licensed stockbroker in August 1987, a couple of months prior to the historic stock market crash that took the Dow Jones Industrial Average down -22.6% in a single day. He has published daily fact-based fundamental and technical analysis on high-ranked stocks online for two decades. Through FACTBASEDINVESTING.COM, Kenneth provides educational articles, news, market commentary, and other information regarding proven investment systems that work in good times and bad.
Comments contained in the body of this report are technical opinions only and are not necessarily those of Gruneisen Growth Corp. The material herein has been obtained from sources believed to be reliable and accurate, however, its accuracy and completeness cannot be guaranteed. Our firm, employees, and customers may effect transactions, including transactions contrary to any recommendation herein, or have positions in the securities mentioned herein or options with respect thereto. Any recommendation contained in this report may not be suitable for all investors and it is not to be deemed an offer or solicitation on our part with respect to the purchase or sale of any securities. |
|
 |
Retail, Financial, Tech, and Commodity-Linked Groups Fell
Kenneth J. Gruneisen - Passed the CAN SLIM® Master's Exam
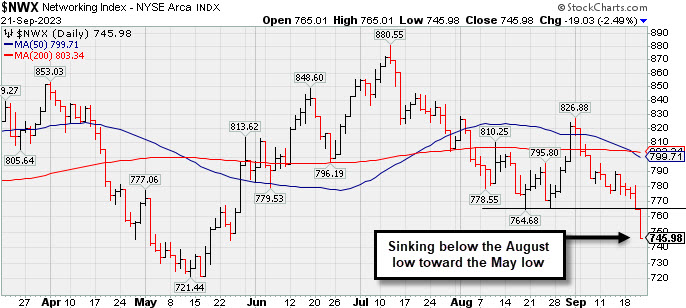
The Retail Index ($RLX -3.25%), Bank Index ($BKX -1.54%), and the Broker/Dealer Index ($XBD -2.15%) suffered big losses that weighed on the major indices on Thursday. The Networking Index ($NWX -2.49%), Semiconductor Index ($SOX -1.76%), and the Biotech Index ($BTK -1.40%) ended unanimously lower. Commodity-linked groups also slumped as the Oil Services Index ($OSX -2.07%), Integrated Oil Index ($XOI -0.98%) and the Gold & Silver Index ($XAU -2.51%) rounded out the widely negative session with losses.
PICTURED: The Networking Index ($NWX -2.49%) is sinking below the August low toward the May low.
| Oil Services |
$OSX |
92.82 |
-1.97 |
-2.07% |
+10.68% |
| Integrated Oil |
$XOI |
1,913.07 |
-18.99 |
-0.98% |
+7.04% |
| Semiconductor |
$SOX |
3,338.85 |
-59.95 |
-1.76% |
+31.86% |
| Networking |
$NWX |
745.98 |
-19.03 |
-2.49% |
-4.77% |
| Broker/Dealer |
$XBD |
491.31 |
-10.79 |
-2.15% |
+9.39% |
| Retail |
$RLX |
3,412.18 |
-114.52 |
-3.25% |
+23.90% |
| Gold & Silver |
$XAU |
115.09 |
-2.96 |
-2.51% |
-4.77% |
| Bank |
$BKX |
79.51 |
-1.24 |
-1.54% |
-21.16% |
| Biotech |
$BTK |
5,028.48 |
-71.20 |
-1.40% |
-4.78% |
|
|
|
 |
Violated 50-Day Moving Average With a Damaging Gap Down
Kenneth J. Gruneisen - Passed the CAN SLIM® Master's Exam
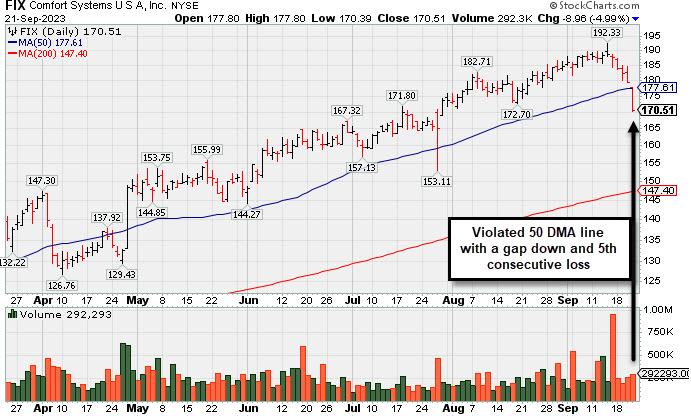
Comfort Systems U S A (FIX -$8.97 or -5.00% to $170.50) gapped down today violating its 50-day moving average (DMA) line ($177.72) triggering a technical sell signal. Only a prompt rebound above the 50 DMA line would help its outlook improve.
Fundamentals remain strong. Its annual earnings history (A criteria) has been strong and steady. It has a 98 Earnings Per Share Rating. It reported Jun '23 quarterly earnings +65% on +27% sales revenues versus the year-ago period. FIX was highlighted in yellow in the 2/23/23 mid-day report (read here) with a pivot point cited based on its 11/23/22 high plus 10 cents. It was last shown in greater detail on 8/21/23 with an annotated graph under the headline, "FIX Still Stubbornly Hovering Near High".
It hails from the Building - A/C & Heating Products group which is currently ranked 9th on the 197 Industry Groups list. It has a small supply of only 35.8 million shares outstanding (S criteria) which can contribute to greater price volatility in the event of institutional buying or selling. The number of top-rated funds that own its shares rose from 487 in Jun '22 to 652 in Jun '23, a reassuring sign regarding the I criteria. Its current Up/Down Volume Ratio of 0.9 is an unbiased indication its shares have been under slight distributional pressure over the past 50 days.
|
|
|
Color Codes Explained :
Y - Better candidates highlighted by our
staff of experts.
G - Previously featured
in past reports as yellow but may no longer be buyable under the
guidelines.
***Last / Change / Volume data in this table is the closing quote data***
Symbol/Exchange
Company Name
Industry Group |
PRICE |
CHANGE
(%Change) |
Day High |
Volume
(% DAV)
(% 50 day avg vol) |
52 Wk Hi
% From Hi |
Featured
Date |
Price
Featured |
Pivot Featured |
|
Max Buy |
 STRL
-
NASDAQ
STRL
-
NASDAQ
Sterling Infrastructure
Bldg-Heavy Construction
|
$71.95
|
-2.53
-3.40% |
$74.14
|
271,617
65.93% of 50 DAV
50 DAV is 412,000
|
$84.00
-14.35%
|
12/14/2022
|
$32.41
|
PP = $33.72
|
|
MB = $35.41
|
 Most Recent Note - 9/21/2023 5:24:17 PM
G - Fell near its 50 DMA line ($71.38) with today's big loss on below-average volume. Fundamentals remain strong.
>>> FEATURED STOCK ARTICLE : 7th Straight Loss Off High for Sterling Infrastructure - 9/13/2023 |
View all notes |
Set NEW NOTE alert |
Company Profile |
SEC
News |
Chart |
Request a new note
C
A
S
I |
FIX
-
NYSE
Comfort Systems USA
Bldg-A/C and Heating Prds
|
$170.50
|
-8.97
-5.00% |
$177.80
|
292,293
121.79% of 50 DAV
50 DAV is 240,000
|
$192.33
-11.35%
|
4/27/2023
|
$148.85
|
PP = $152.23
|
|
MB = $159.84
|
Most Recent Note - 9/21/2023 5:15:49 PM
G - Violated its 50 DMA line ($177.72) with today's gap down and 5th consecutive loss triggering a technical sell signal. Only a prompt rebound above the 50 DMA line would help its outlook improve. Fundamentals remain strong. See the latest FSU analysis for more details and a new annotated graph.
>>> FEATURED STOCK ARTICLE : Violated 50-Day Moving Average With a Damaging Gap Down - 9/21/2023 |
View all notes |
Set NEW NOTE alert |
Company Profile |
SEC
News |
Chart |
Request a new note
C
A
S
I |
KOF
-
NYSE
Coca Cola Femsa Sab Ads
FOOD and BEVERAGE - Beverages - Soft Drinks
|
$79.27
|
-2.10
-2.58% |
$80.95
|
189,510
131.60% of 50 DAV
50 DAV is 144,000
|
$91.23
-13.11%
|
6/9/2023
|
$88.61
|
PP = $91.33
|
|
MB = $95.90
|
Most Recent Note - 9/21/2023 5:19:36 PM
Closed below its 200 DMA line ($83.35) with today's loss backed by +32% above average volume raising greater concerns. Its Relative Strength Rating is currently 73, below the 80+ minimum guideline for buy candidates. It will be dropped from the Featured Stocks list tonight.
>>> FEATURED STOCK ARTICLE : Lingering Below 50 DMA Line and Relative Strength Rating Slumped - 9/14/2023 |
View all notes |
Set NEW NOTE alert |
Company Profile |
SEC
News |
Chart |
Request a new note
C
A
S
I |
CLH
-
NYSE
Clean Harbors
Pollution Control
|
$167.20
|
-2.06
-1.22% |
$169.07
|
262,030
84.25% of 50 DAV
50 DAV is 311,000
|
$178.33
-6.24%
|
3/10/2023
|
$136.89
|
PP = $136.74
|
|
MB = $143.58
|
Most Recent Note - 9/21/2023 5:02:04 PM
G - Slumped below its 50 DMA line ($169) with today's 2nd consecutive loss backed by below-average volume. Jun '23 quarterly earnings were -13% on +3% sales revenues versus the year-ago period, below the +25% minimum earnings guideline (C criteria), raising fundamental concerns.
>>> FEATURED STOCK ARTICLE : Enduring Distributional Pressure Near 50-Day Moving Average - 9/20/2023 |
View all notes |
Set NEW NOTE alert |
Company Profile |
SEC
News |
Chart |
Request a new note
C
A
S
I |
HUBB
-
NYSE
Hubbell
Electrical-Power/Equipmt
|
$304.46
|
-6.03
-1.94% |
$310.49
|
249,564
55.34% of 50 DAV
50 DAV is 451,000
|
$340.06
-10.47%
|
4/25/2023
|
$262.85
|
PP = $257.51
|
|
MB = $270.39
|
Most Recent Note - 9/21/2023 5:17:35 PM
Sank further below its 50 DMA line ($317.52) with today's loss and it will be dropped from the Featured Stocks list tonight. Prior low ($299.80 on 8/10/23) defines the next important support to watch. Fundamentals remain strong.
>>> FEATURED STOCK ARTICLE : Rebounded Near 50-Day Moving Average Line - 8/24/2023 |
View all notes |
Set NEW NOTE alert |
Company Profile |
SEC
News |
Chart |
Request a new note
C
A
S
I |
Symbol/Exchange
Company Name
Industry Group |
PRICE |
CHANGE
(%Change) |
Day High |
Volume
(% DAV)
(% 50 day avg vol) |
52 Wk Hi
% From Hi |
Featured
Date |
Price
Featured |
Pivot Featured |
|
Max Buy |
ANET
-
NYSE
Arista Networks
Computer-Networking
|
$177.86
|
-4.89
-2.68% |
$180.75
|
1,823,182
67.50% of 50 DAV
50 DAV is 2,701,000
|
$198.70
-10.49%
|
8/1/2023
|
$188.84
|
PP = $178.46
|
|
MB = $187.38
|
Most Recent Note - 9/21/2023 5:00:41 PM
G - Gapped down today violating its 50 DMA line ($180) with a loss on light volume triggering a technical sell signal and its color code is changed to green. Only a prompt rebound above the 50 DMA line would help its outlook improve. Fundamentals remain strong.
>>> FEATURED STOCK ARTICLE : Orderly Pullback Below "Max Buy" Level - 9/15/2023 |
View all notes |
Set NEW NOTE alert |
Company Profile |
SEC
News |
Chart |
Request a new note
C
A
S
I |
LSCC
-
NASDAQ
Lattice Semiconductor
Elec-Semicondctor Fablss
|
$82.87
|
-1.74
-2.06% |
$84.42
|
1,673,405
101.97% of 50 DAV
50 DAV is 1,641,000
|
$98.30
-15.70%
|
6/13/2023
|
$91.73
|
PP = $96.92
|
|
MB = $101.77
|
Most Recent Note - 9/21/2023 5:21:34 PM
Undercut prior lows and violated its 200 DMA line ($84.62) with today's 5th consecutive loss triggering a worrisome technical sell signal. It will be dropped from the Featured Stocks list tonight.
>>> FEATURED STOCK ARTICLE : Slumping Near 200 DMA Line and Still Only -12.3% Off High - 9/19/2023 |
View all notes |
Set NEW NOTE alert |
Company Profile |
SEC
News |
Chart |
Request a new note
C
A
S
I |
ESQ
-
NASDAQ
Esquire Financial Holdings
Finance-Commercial Loans
|
$44.91
|
-0.54
-1.19% |
$45.55
|
9,883
43.73% of 50 DAV
50 DAV is 22,600
|
$54.03
-16.88%
|
7/14/2023
|
$45.80
|
PP = $48.23
|
|
MB = $50.64
|
Most Recent Note - 9/21/2023 5:04:49 PM
Suffered a 5th consecutive loss today and it will be dropped from the Featured Stocks list tonight. A rebound above the 50 DMA line is needed for its outlook to improve.
>>> FEATURED STOCK ARTICLE : Met Resistance at 50-Day Moving Average After Slumping - 9/18/2023 |
View all notes |
Set NEW NOTE alert |
Company Profile |
SEC
News |
Chart |
Request a new note
C
A
S
I |
MEDP
-
NASDAQ
Medpace Holdings
Medical-Research Eqp/Svc
|
$240.81
|
-13.89
-5.45% |
$254.70
|
492,817
174.14% of 50 DAV
50 DAV is 283,000
|
$282.73
-14.83%
|
7/25/2023
|
$196.32
|
PP = $241.57
|
|
MB = $253.65
|
Most Recent Note - 9/21/2023 12:34:22 PM
G - Gapped down today on track for a 6th consecutive loss, abruptly retreating below the prior high ($269) and violating its 50 DMA line ($260) triggering a technical sell signal. Only a prompt rebound above the 50 DMA line would help its outlook improve. Fundamentals remain strong.
>>> FEATURED STOCK ARTICLE : Consolidating Above 50-Day Moving Average - 8/23/2023 |
View all notes |
Set NEW NOTE alert |
Company Profile |
SEC
News |
Chart |
Request a new note
C
A
S
I |
COKE
-
NASDAQ
Coca-Cola Consolidated
Beverages-Non-Alcoholic
|
$652.83
|
-7.63
-1.16% |
$662.68
|
19,016
45.28% of 50 DAV
50 DAV is 42,000
|
$745.53
-12.43%
|
8/3/2023
|
$718.56
|
PP = $694.30
|
|
MB = $729.02
|
Most Recent Note - 9/21/2023 5:03:08 PM
G - Suffered a loss today with light volume. Recently sputtering below its 50 DMA line ($671) after volume-driven losses. Only a prompt rebound above the 50 DMA line would help its outlook improve.
>>> FEATURED STOCK ARTICLE : Rebounded Above 50-Day Moving Average - 9/11/2023 |
View all notes |
Set NEW NOTE alert |
Company Profile |
SEC
News |
Chart |
Request a new note
C
A
S
I |
Symbol/Exchange
Company Name
Industry Group |
PRICE |
CHANGE
(%Change) |
Day High |
Volume
(% DAV)
(% 50 day avg vol) |
52 Wk Hi
% From Hi |
Featured
Date |
Price
Featured |
Pivot Featured |
|
Max Buy |
PLUS
-
NASDAQ
ePlus
Computer-Tech Services
|
$62.00
|
-0.08
-0.13% |
$62.58
|
79,772
73.86% of 50 DAV
50 DAV is 108,000
|
$75.90
-18.31%
|
8/8/2023
|
$67.60
|
PP = $62.92
|
|
MB = $66.07
|
Most Recent Note - 9/21/2023 5:23:05 PM
Y - Volume totals have been cooling while still testing support near the recent low and 50 DMA line in the $61 area. More damaging losses may trigger a technical sell signal.
>>> FEATURED STOCK ARTICLE : Still Consolidating Above 50 DMA Line - 9/12/2023 |
View all notes |
Set NEW NOTE alert |
Company Profile |
SEC
News |
Chart |
Request a new note
C
A
S
I |
|
|
|
THESE ARE NOT BUY RECOMMENDATIONS!
Comments contained in the body of this report are technical
opinions only. The material herein has been obtained
from sources believed to be reliable and accurate, however,
its accuracy and completeness cannot be guaranteed.
This site is not an investment advisor, hence it does
not endorse or recommend any securities or other investments.
Any recommendation contained in this report may not
be suitable for all investors and it is not to be deemed
an offer or solicitation on our part with respect to
the purchase or sale of any securities. All trademarks,
service marks and trade names appearing in this report
are the property of their respective owners, and are
likewise used for identification purposes only.
This report is a service available
only to active Paid Premium Members.
You may opt-out of receiving report notifications
at any time. Questions or comments may be submitted
by writing to Premium Membership Services 665 S.E. 10 Street, Suite 201 Deerfield Beach, FL 33441-5634 or by calling 1-800-965-8307
or 954-785-1121.
|
|
|